

Supply chain dashboard displays
Put supply chain dashboards from your existing platforms on shared screens. Procurement, operations, and planning teams track orders, disruptions, and KPIs as conditions change without switching between tools.
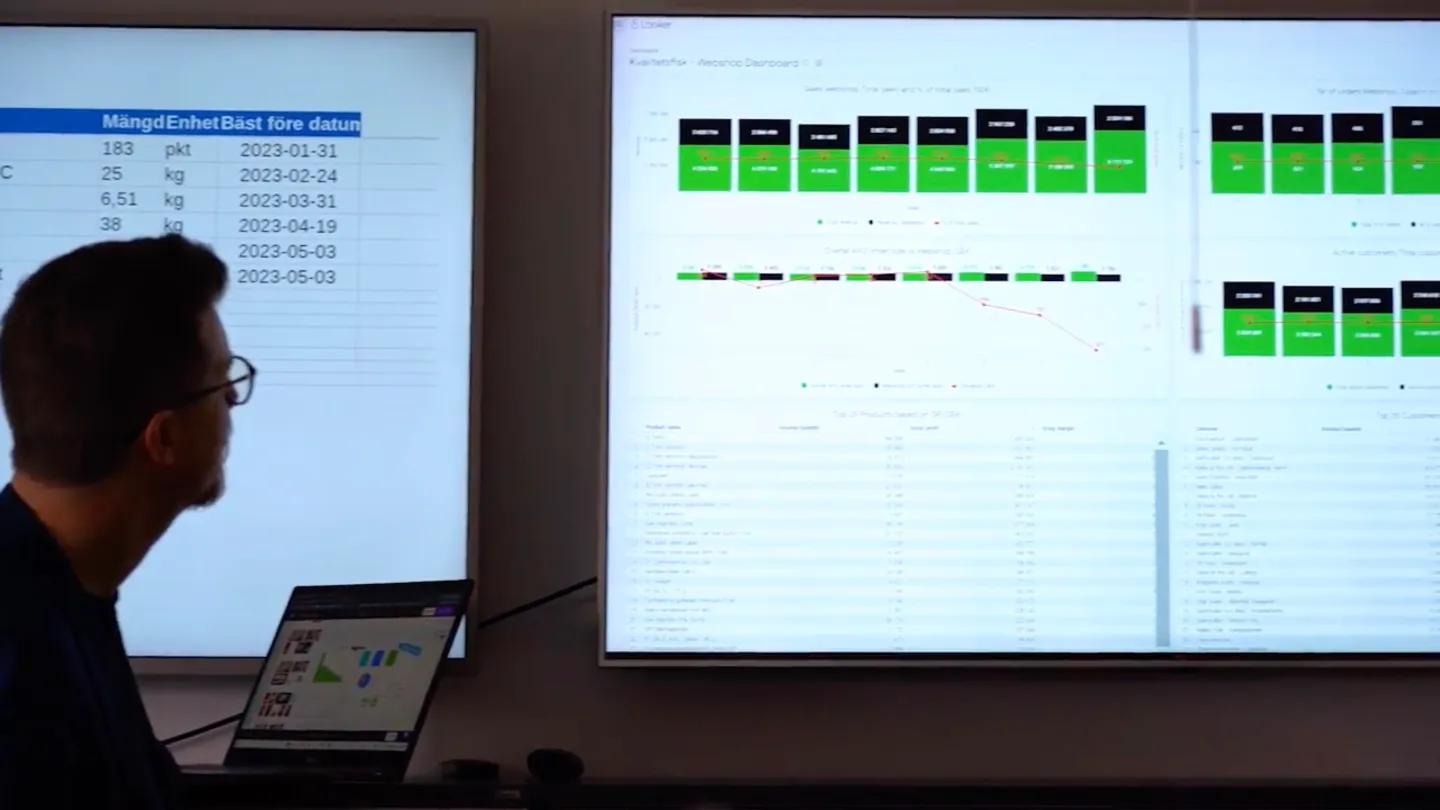
Why supply chain teams put dashboards on screens
Shared screens turn supply chain data into something the whole team can act on, not just whoever logged into the right system.
Surface disruptions before they cascade downstream
A delayed shipment or supplier issue on a shared screen gets noticed by everyone in the room. Teams react before the problem reaches customers or production lines.
Reduce cross-team status meetings about order status
When procurement, logistics, and planning all see the same live data, there are fewer meetings just to share updates everyone already has.
Keep procurement and operations looking at the same data
Both teams work from one set of numbers. Procurement sees what operations needs. Operations sees what procurement has ordered and when it arrives.
Track order lifecycle without switching between systems
Orders move through multiple systems from PO to delivery. A screen showing the full lifecycle saves teams from checking three or four tools individually.
Monitor supplier performance where the team can see it
On-time delivery rates, quality scores, and lead times stay visible throughout the day. The team notices trends before they become problems.
Support contingency decisions with visible risk data
When a supplier misses a deadline or a route is disrupted, risk data on screen helps the team decide on alternatives faster.
What supply chain teams show on screens
Supply chain displays typically combine order tracking, supplier metrics, and inventory data from your existing tools.
Order tracking and fulfillment status
Live order positions, fulfillment progress, and estimated delivery dates from your ERP or order management system.
Supplier performance scorecards
On-time delivery rates, quality metrics, and compliance scores by supplier from your procurement tools.
Inventory positions across locations
Stock levels, reorder points, and allocation status across warehouses and distribution centers.
Lead time trends and forecasts
Historical and projected lead times by supplier, category, or route from your analytics platform.
Risk and disruption alerts
Active disruptions, at-risk shipments, and supplier warnings that need immediate attention.
Cost variance and budget tracking
Spend against budget, freight cost trends, and cost variance by category or supplier.
Fugo features for supply chain displays
Fugo connects to your existing supply chain and analytics tools to put live data on any screen.
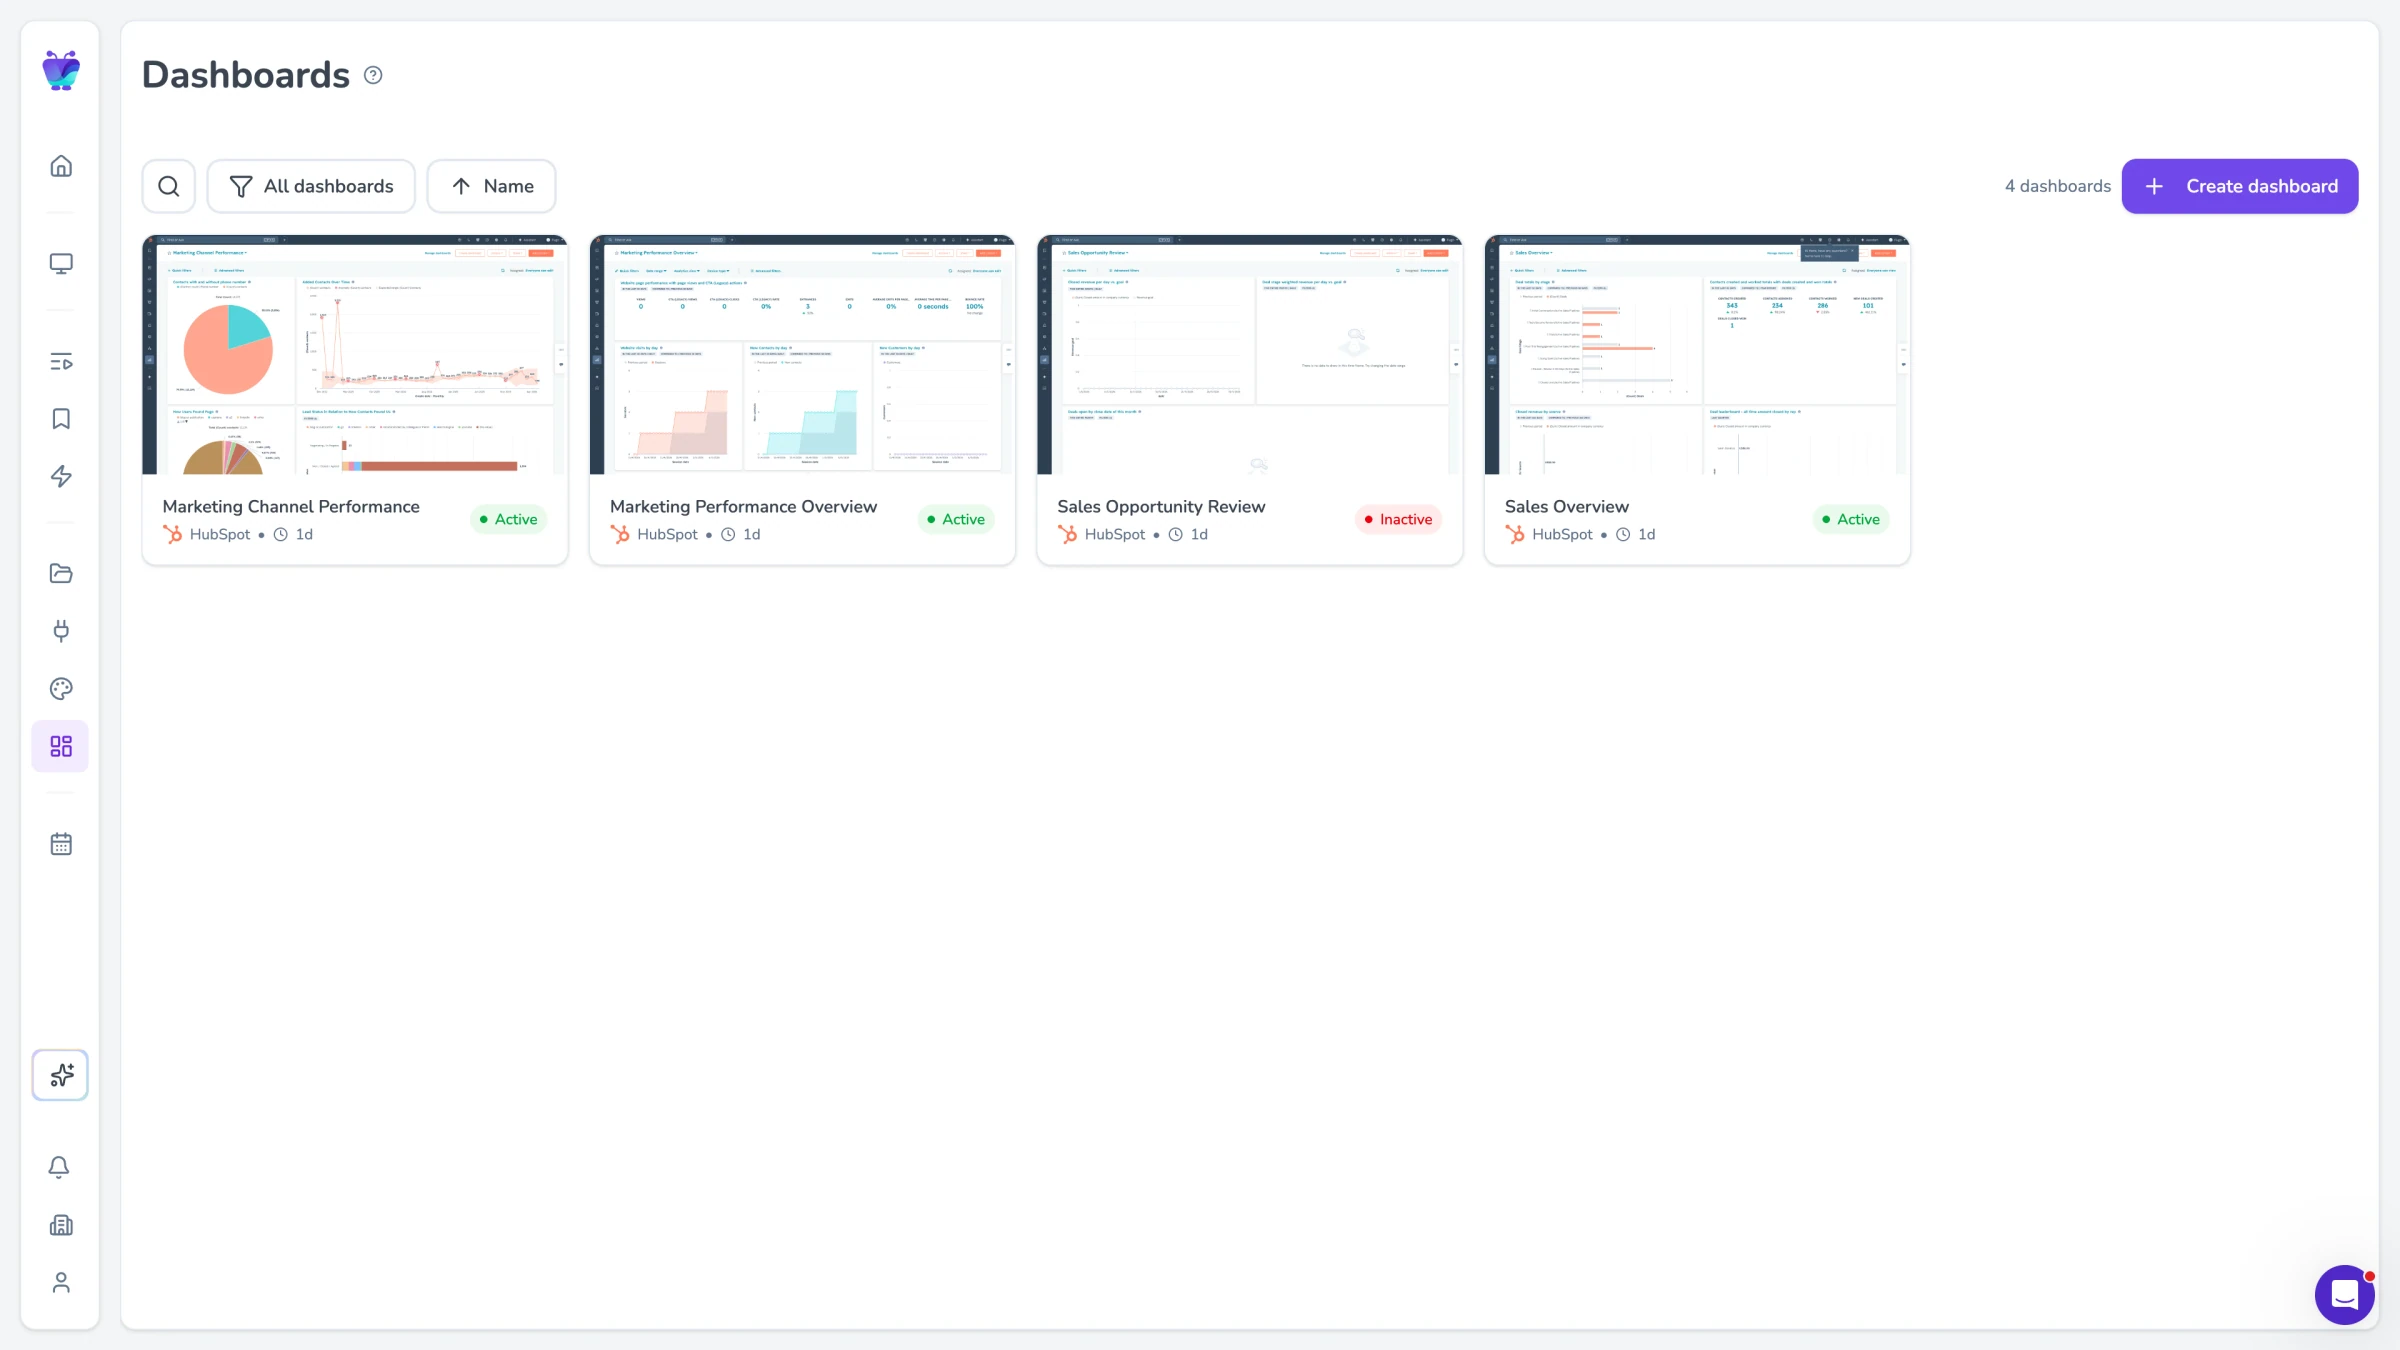
Dashboard integrations
Display dashboards from SAP, Oracle, Power BI, Tableau, or any web-based supply chain tool directly on screens.
Explore TV dashboards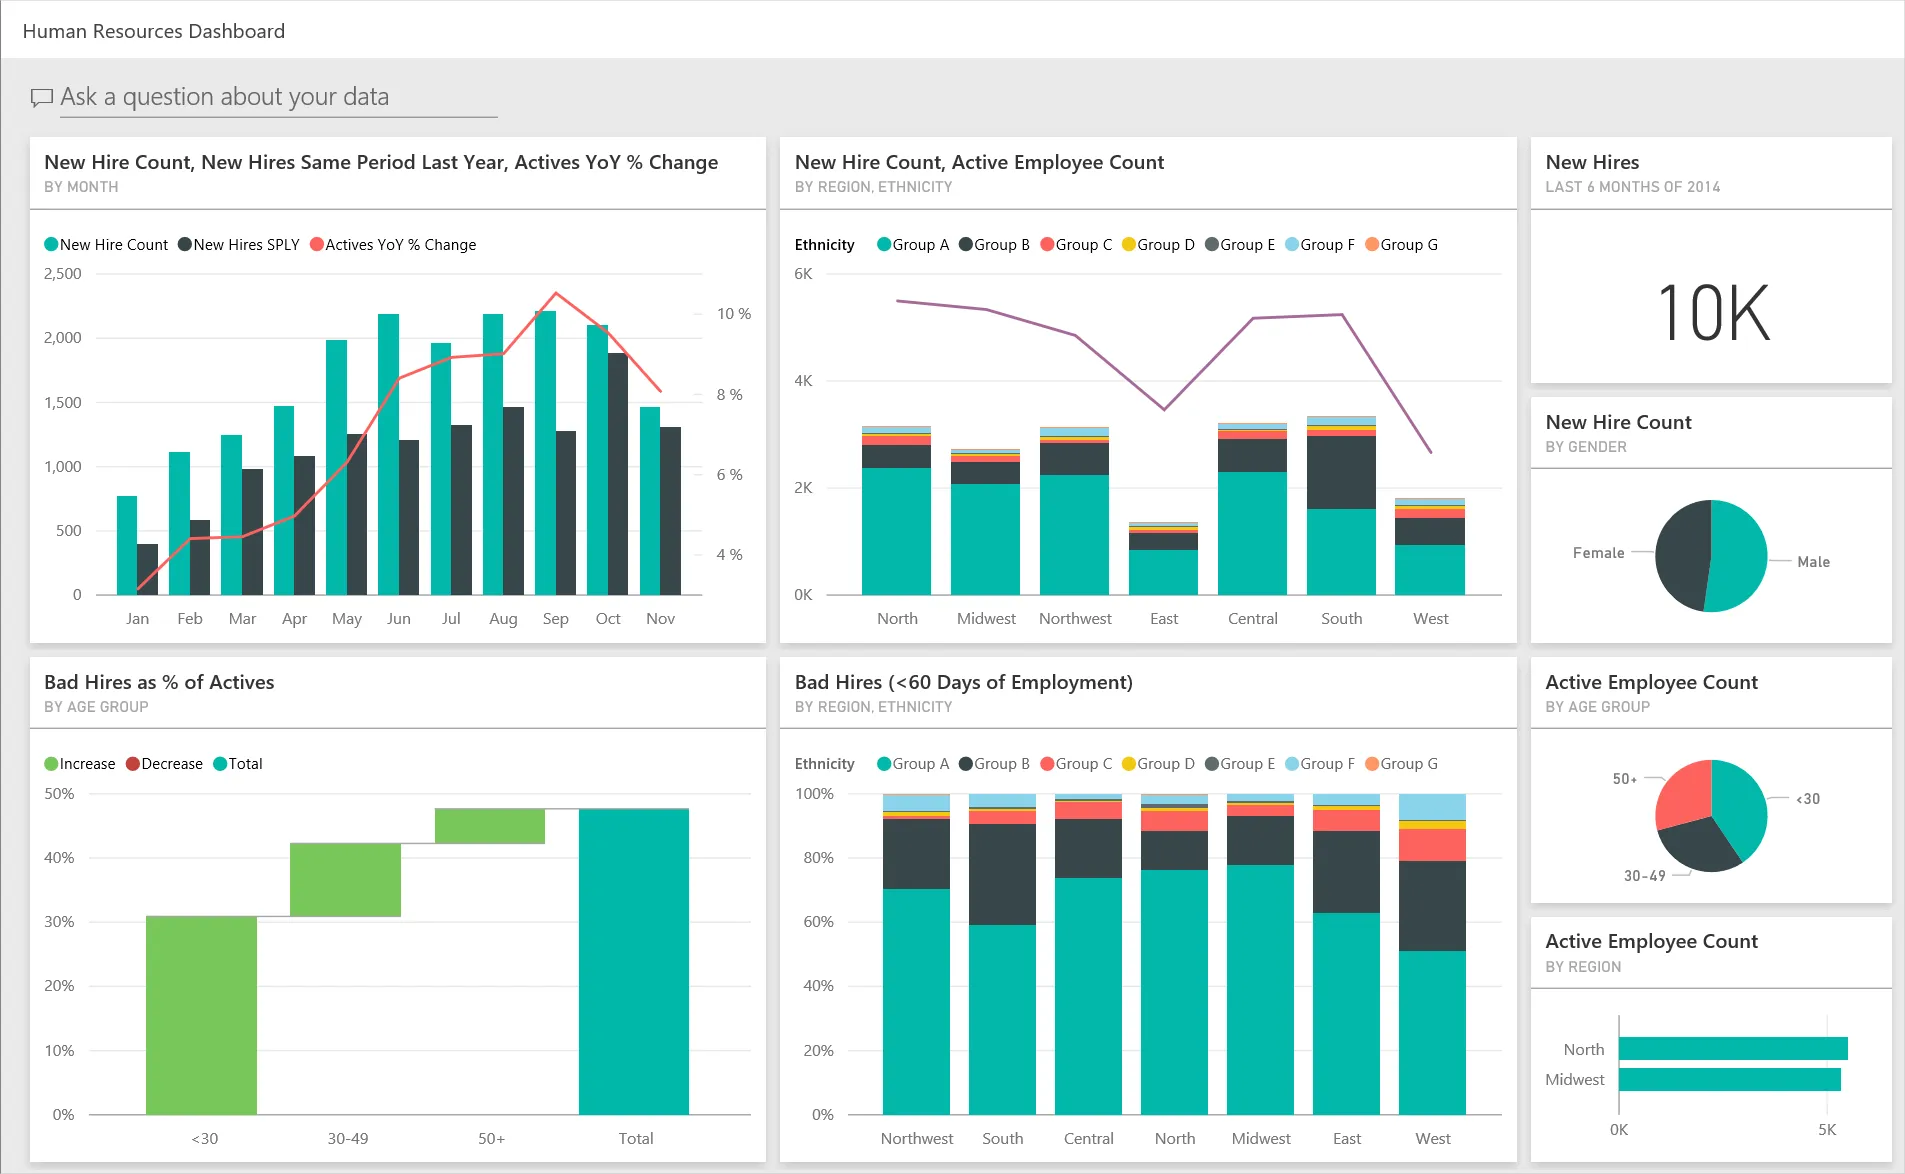
Power BI dashboards
Connect Power BI reports directly. Fugo handles authentication and keeps dashboards refreshing on screen.
Explore Power BI dashboards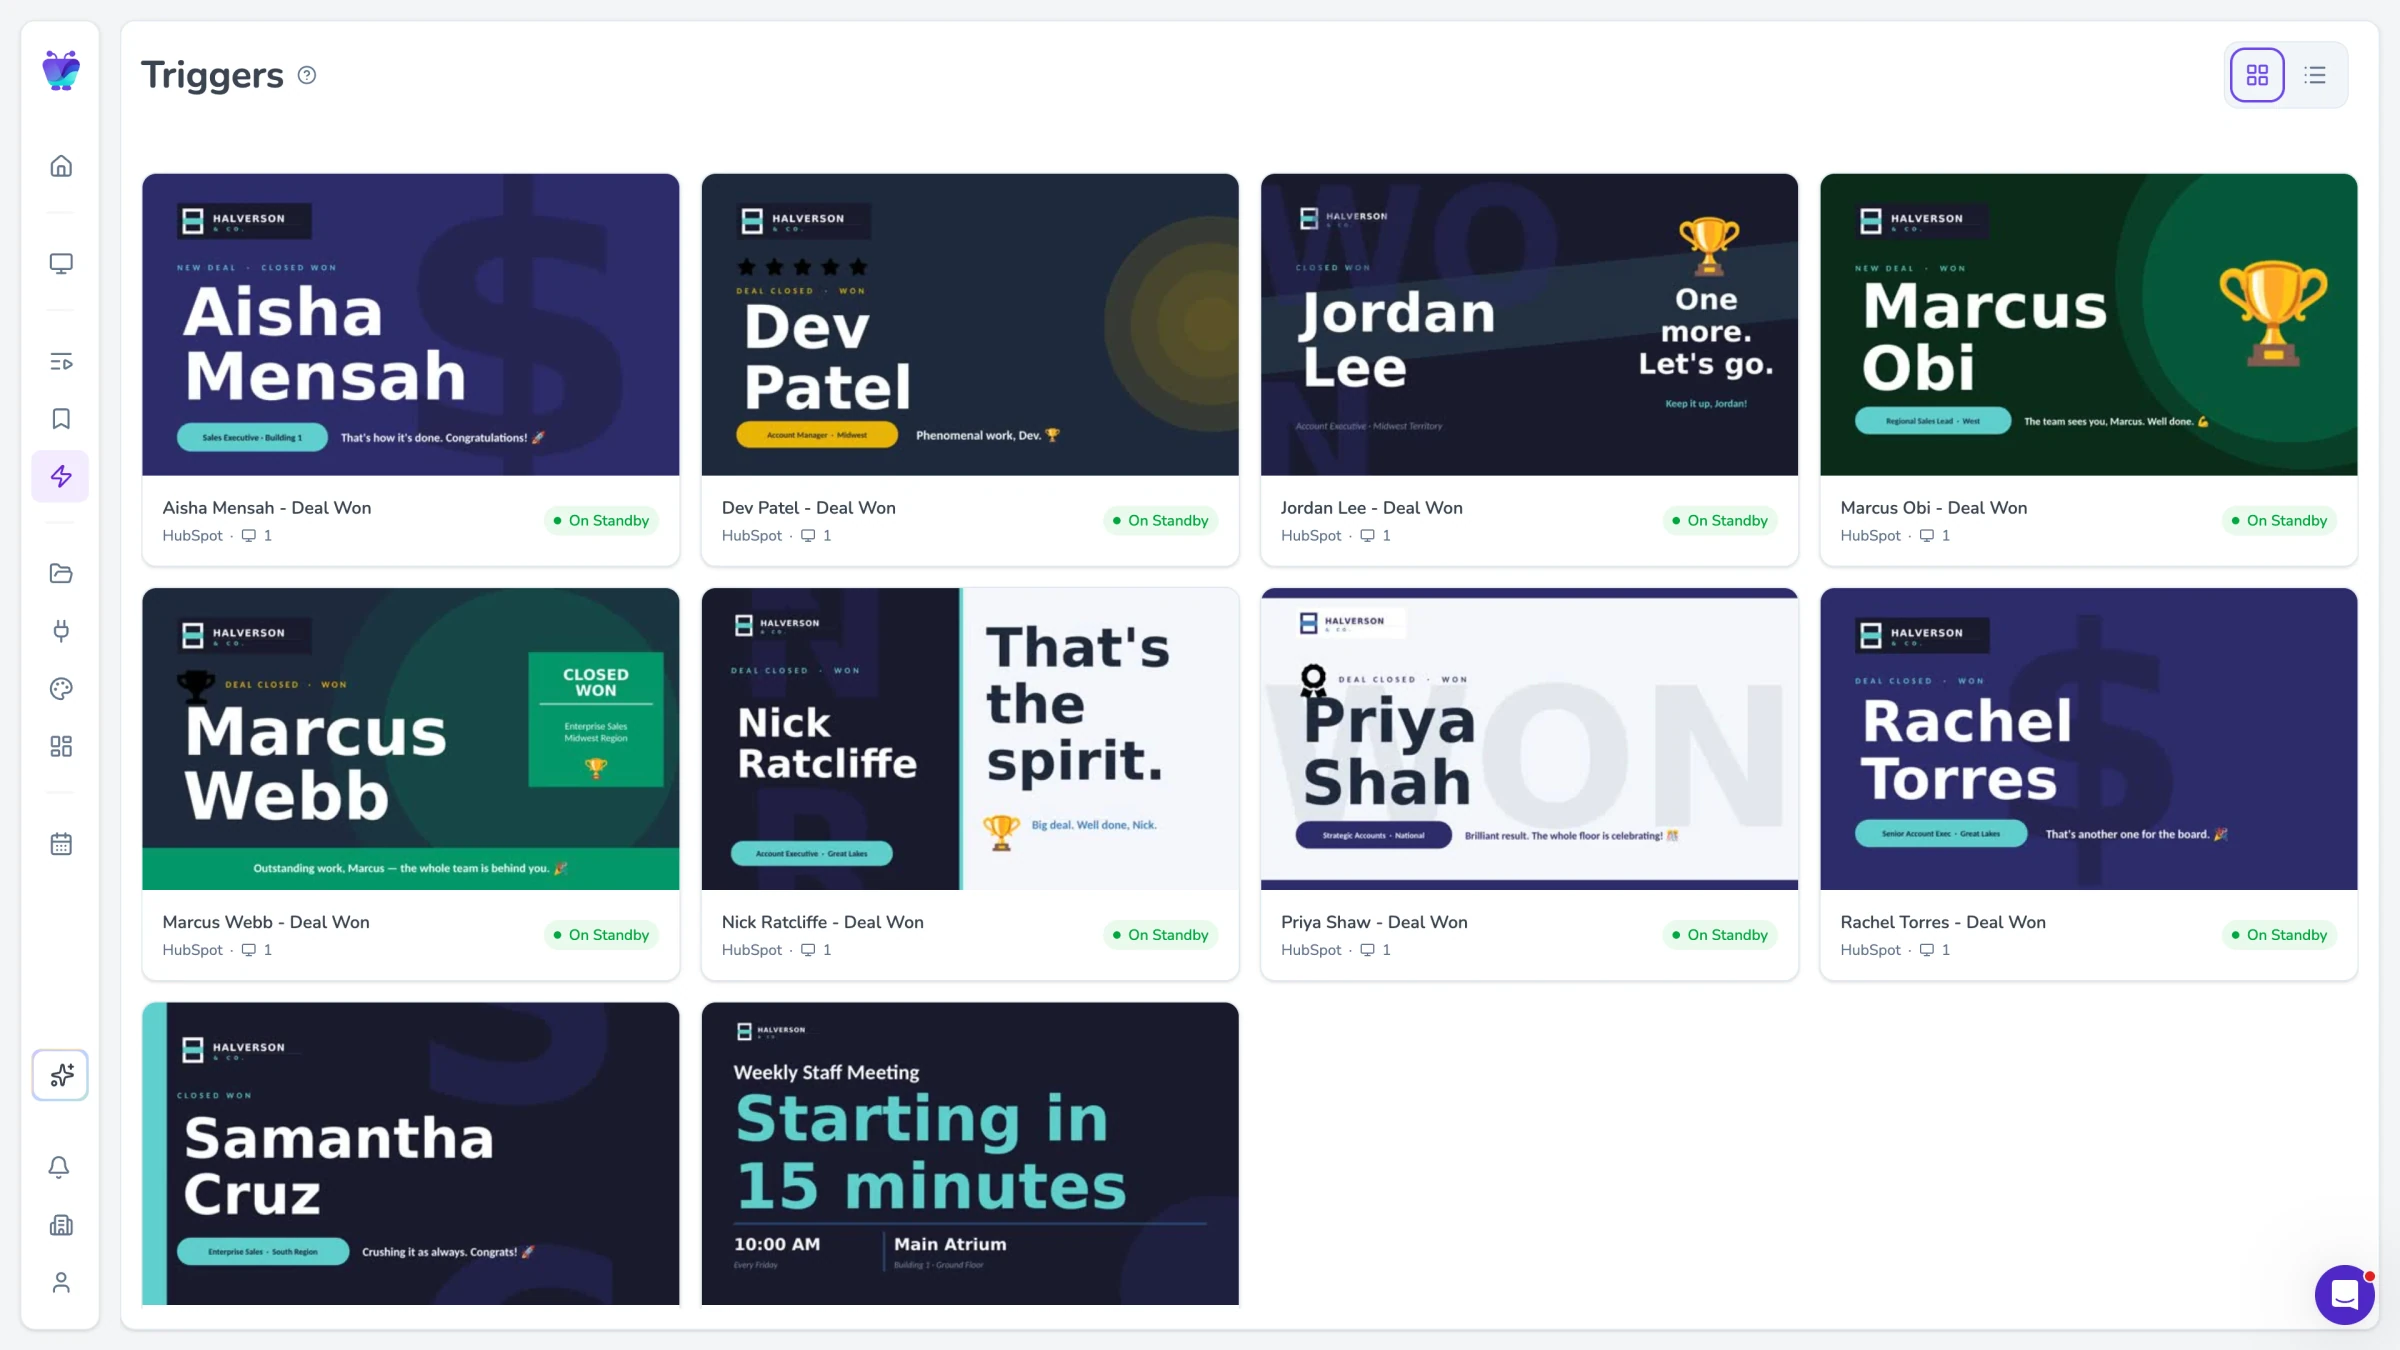
Content triggers
Automatically change what screens show when orders are delayed, inventory hits reorder points, or risks escalate.
See content triggers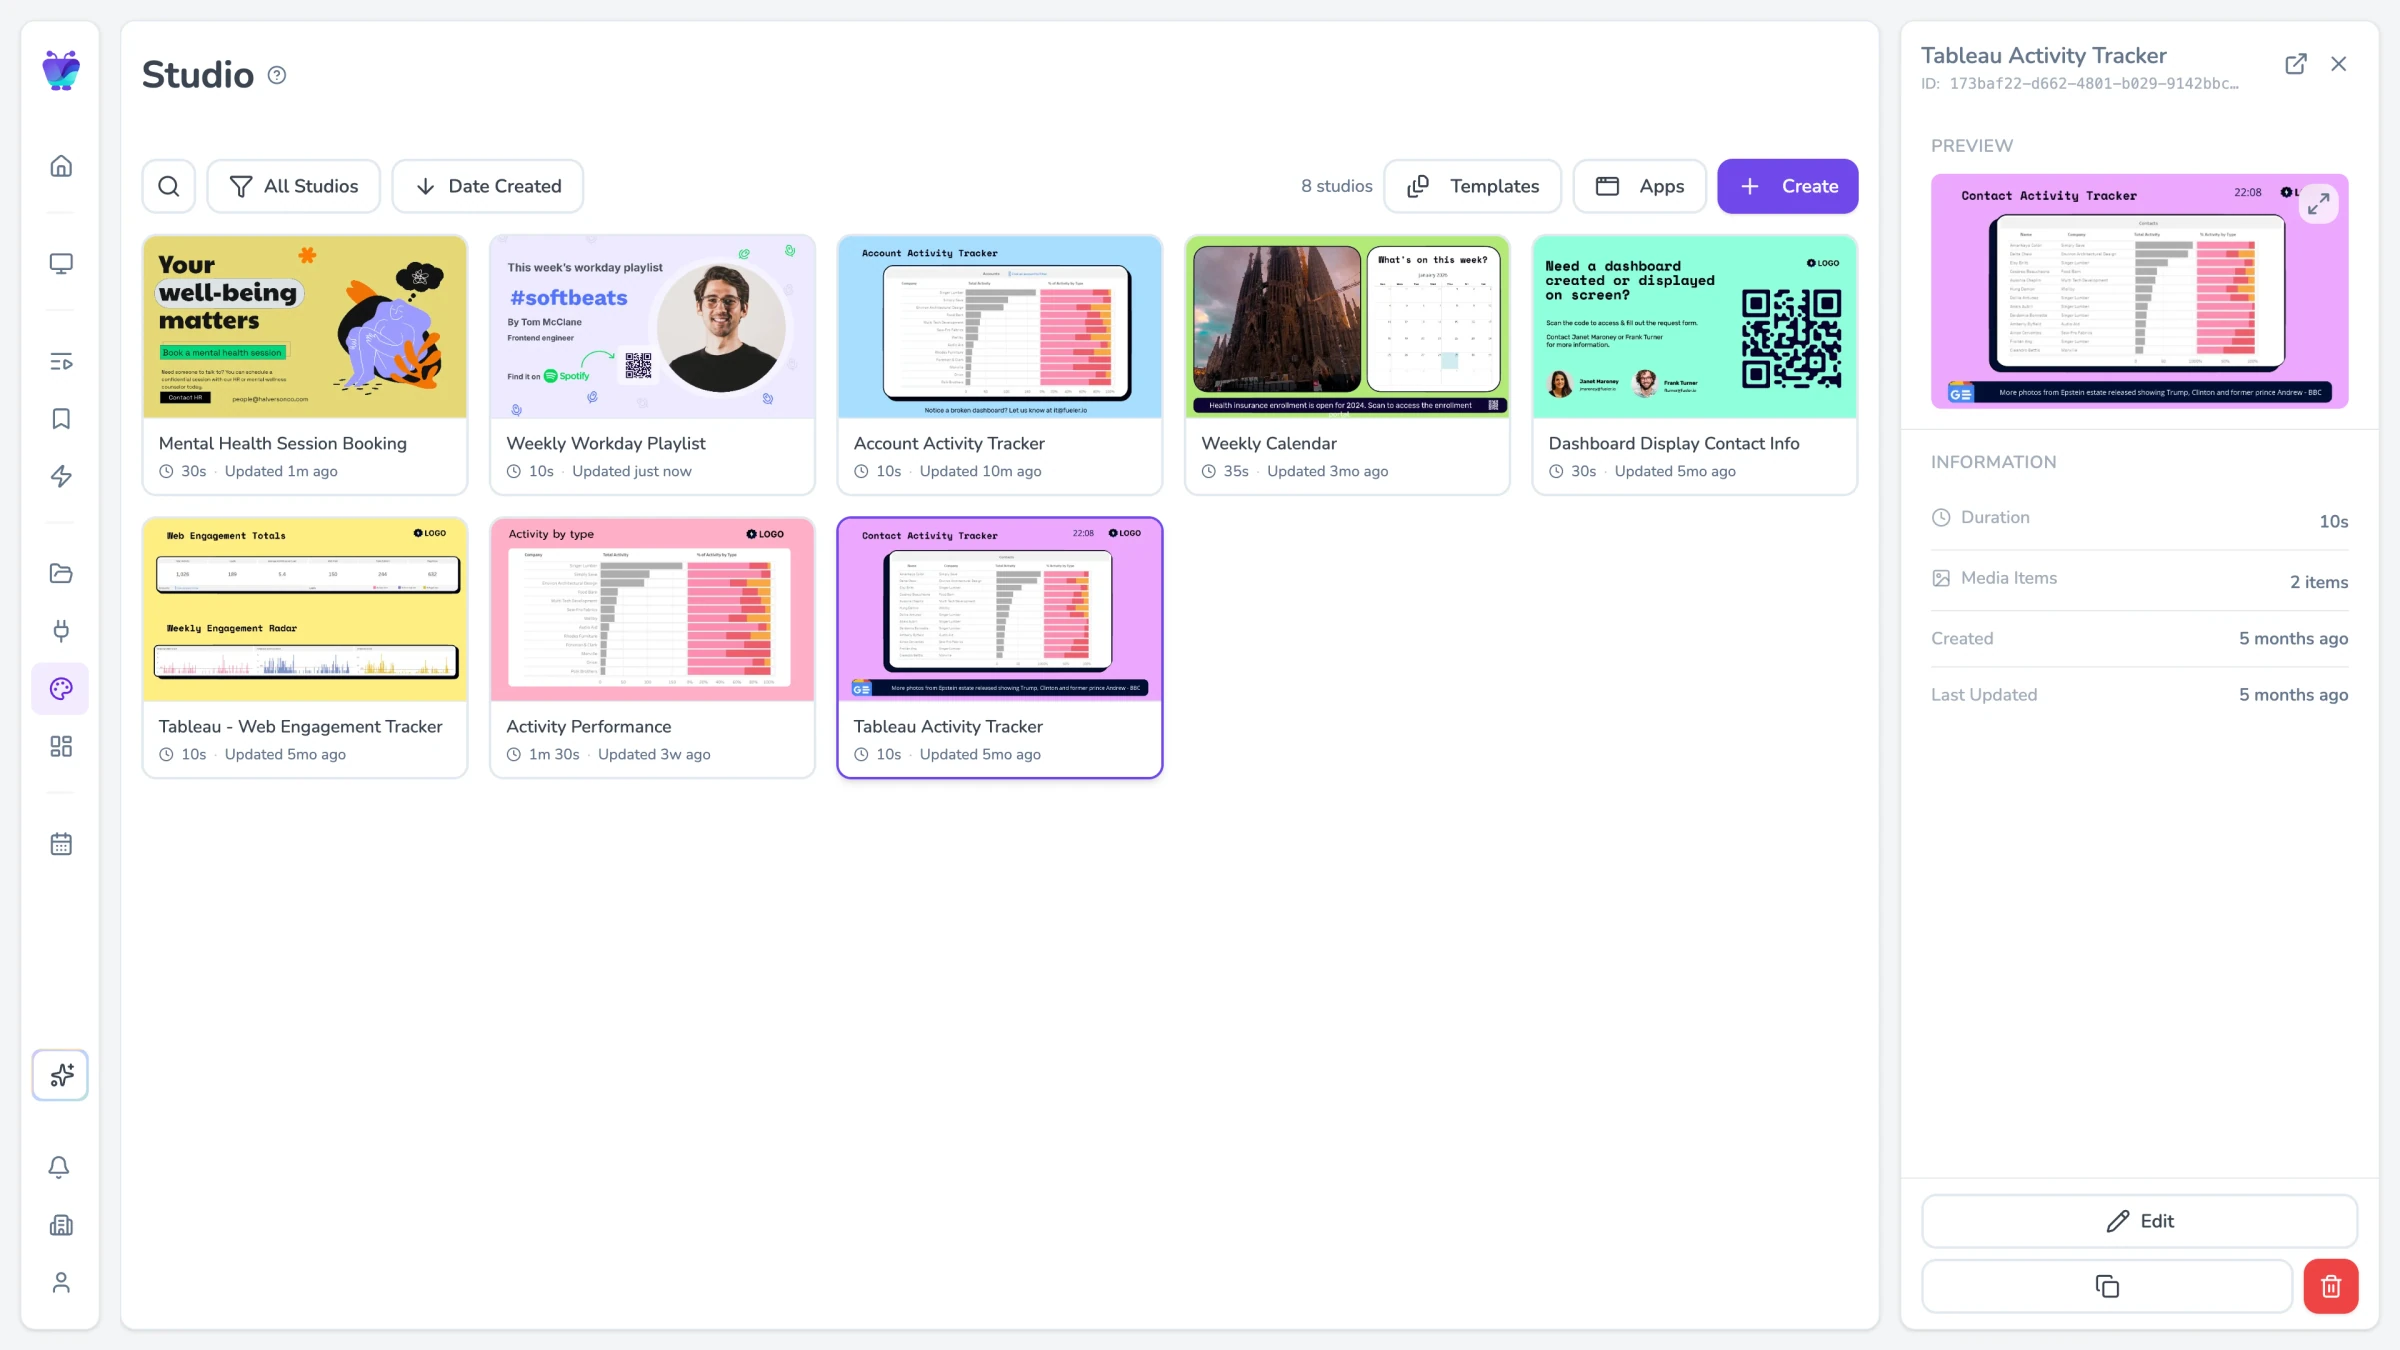
Design Studio
Build custom supply chain dashboards that combine data from multiple sources into a single screen layout.
Explore Design Studio