

Executive dashboard displays
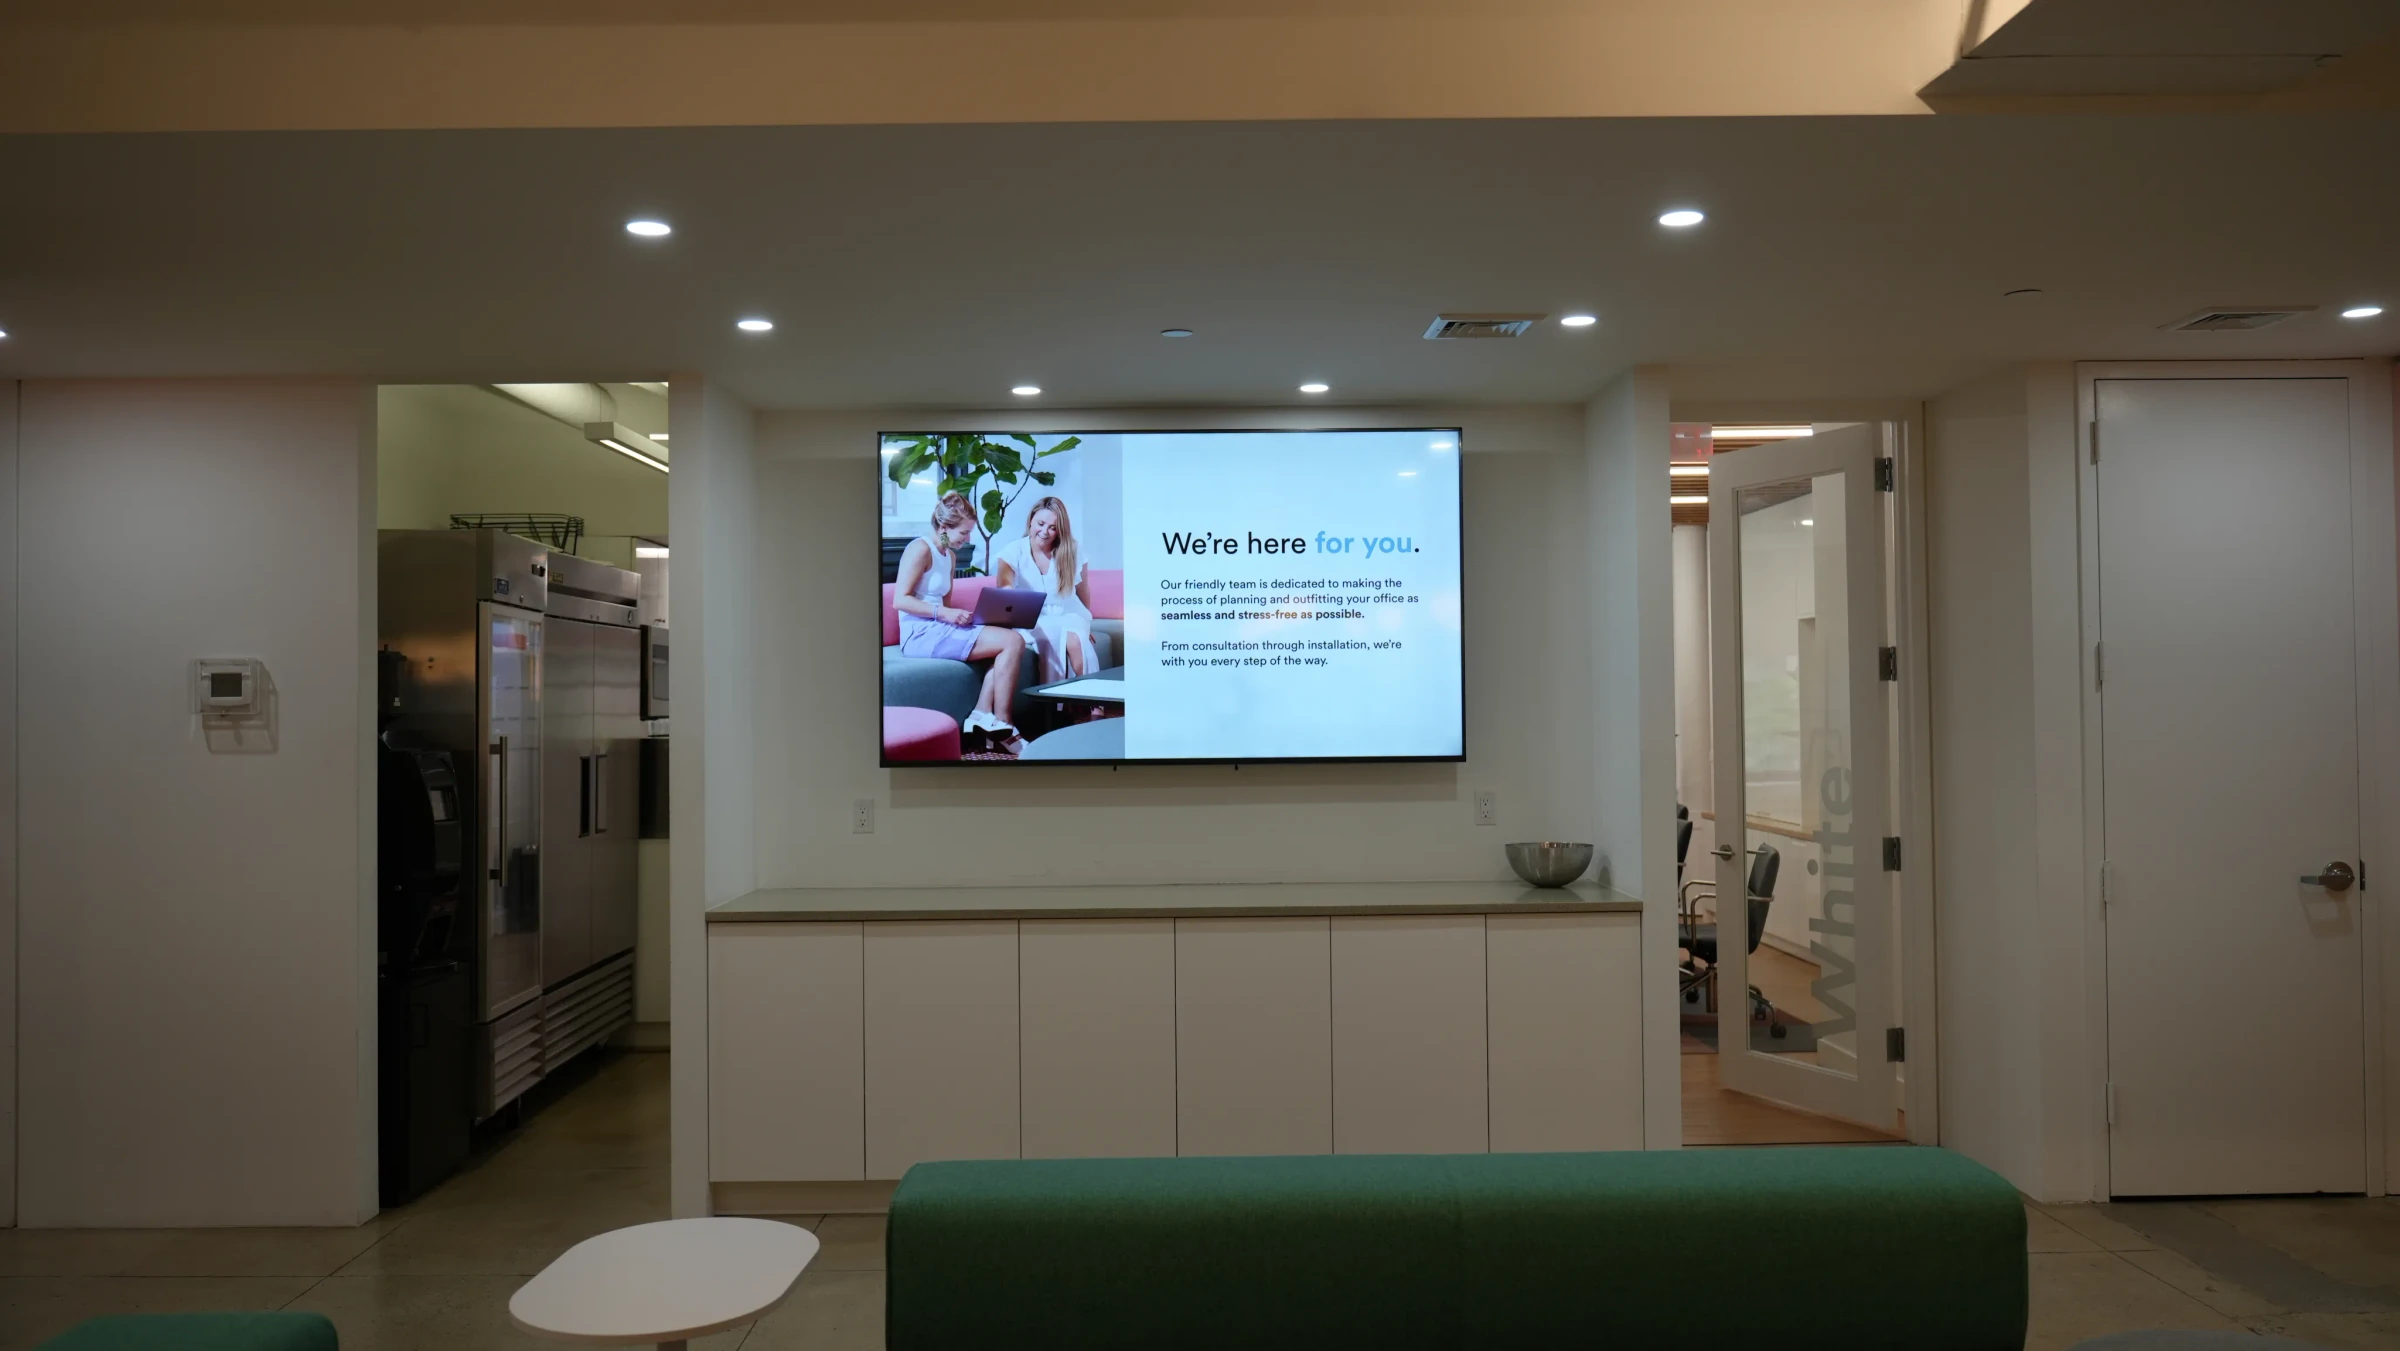
Put company-wide dashboards from Power BI, Tableau, and Looker on screens in executive areas. Leaders get persistent visibility into performance without requesting reports or scheduling status meetings.
Why leadership teams put dashboards on screens
Replace status meetings with persistent visibility
A screen showing live company health removes the need for recurring check-ins that exist only to share numbers. Leaders see the state of the business on the way to their next meeting.
Reduce lag between an event and executive awareness
Revenue misses, support spikes, and deployment failures show up on the screen as they happen. No one needs to escalate or send an email for leadership to notice.
Keep the leadership team aligned on the same numbers
When every executive sees the same dashboard, conversations start from shared context. Less time reconciling different reports, more time deciding what to do about them.
Support board-ready displays in briefing rooms
Put formatted dashboards on screens in boardrooms and executive briefing rooms. The data is already there when the meeting starts instead of buried in a slide deck.
Surface cross-functional trends that get buried in silos
Departmental reports stay in departments. A shared executive display pulls metrics from sales, engineering, support, and finance into one view that reveals how they connect.
Make strategic priorities visible where decisions happen
OKR progress, initiative status, and key results belong on screens near executive offices and meeting rooms. Visibility reinforces focus on what the company said matters most.
What leadership teams show on screens
Company-wide kPIs and health metrics
Top-level indicators like revenue, burn rate, NPS, and uptime in a single consolidated view.
Revenue growth and financial summaries
MRR, ARR, cash runway, and margin trends pulled from your financial reporting tools.
Departmental scorecards and comparisons
Side-by-side performance across sales, engineering, support, and marketing.
Strategic initiative progress
OKR completion, project milestones, and key results tracked against quarterly goals.
Risk and compliance status
Open audit items, security posture scores, and regulatory deadlines in one place.
Market and competitive indicators
Share price, analyst sentiment, and competitive win/loss ratios for context on external positioning.
Fugo features for executive displays
Power BI dashboards
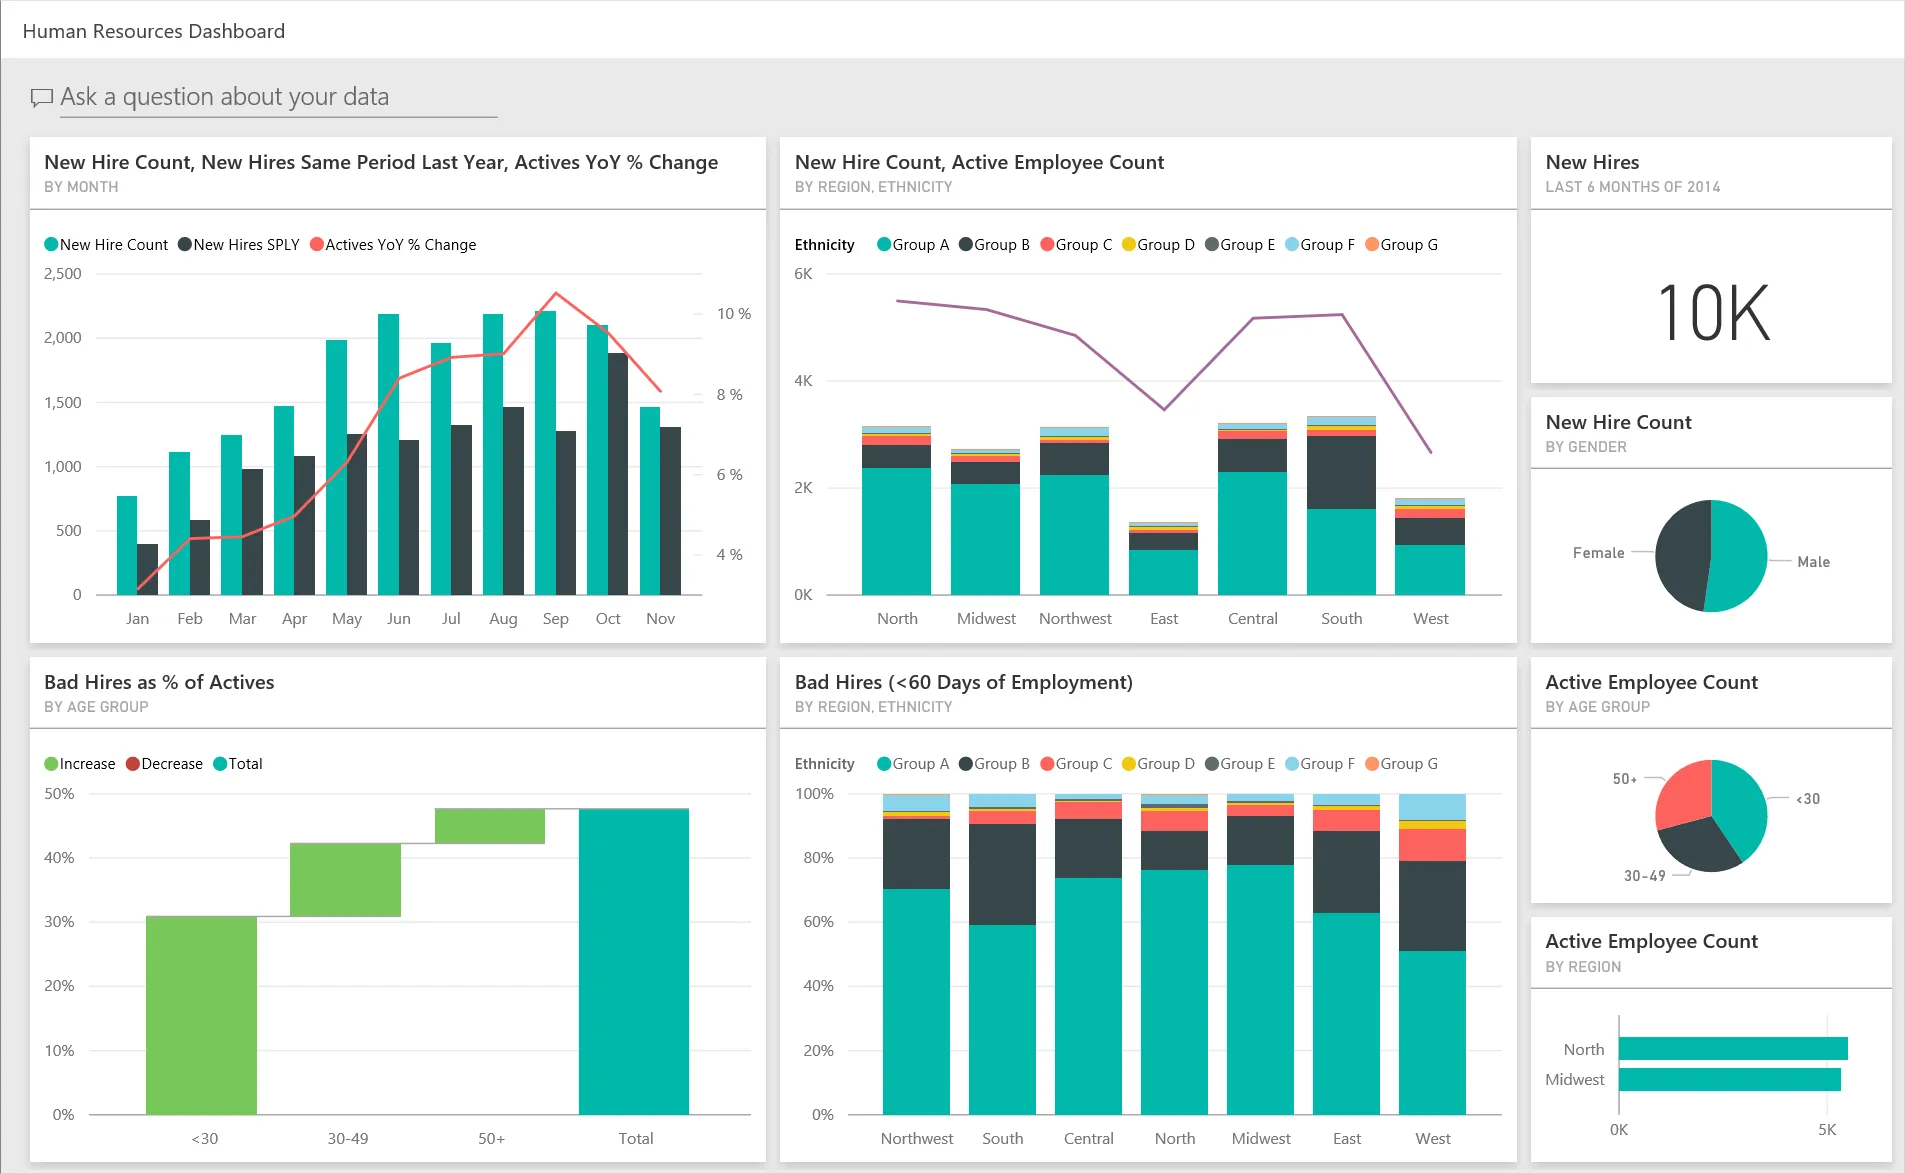
Display any Power BI report or dashboard on screen with secure embed. Connects through Microsoft SSO with read-only access to your existing reports.
Explore Power BI dashboards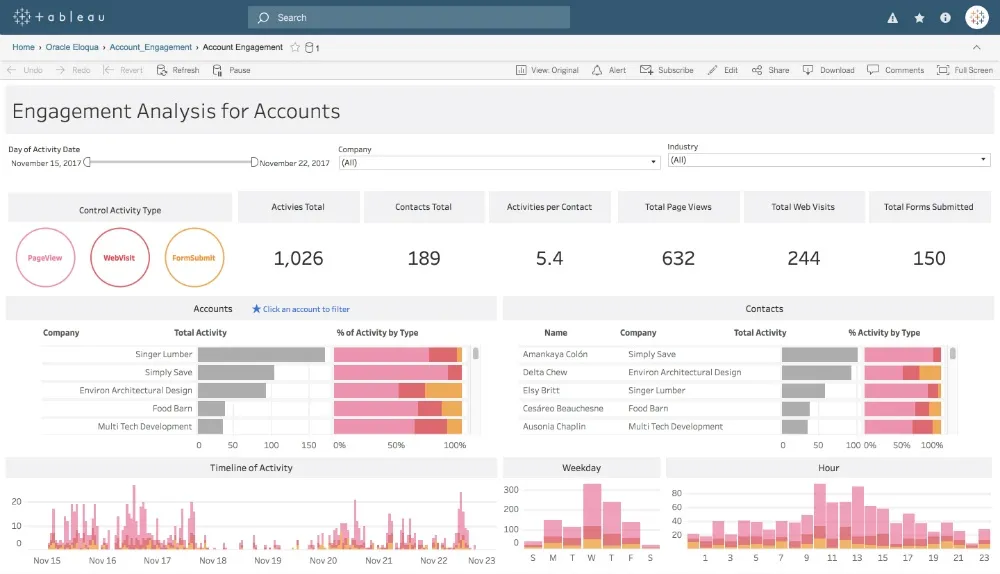
Tableau dashboards
Show Tableau views on TV screens without running a browser. Fugo handles authentication and refresh so the dashboard stays current throughout the day.
Explore Tableau dashboards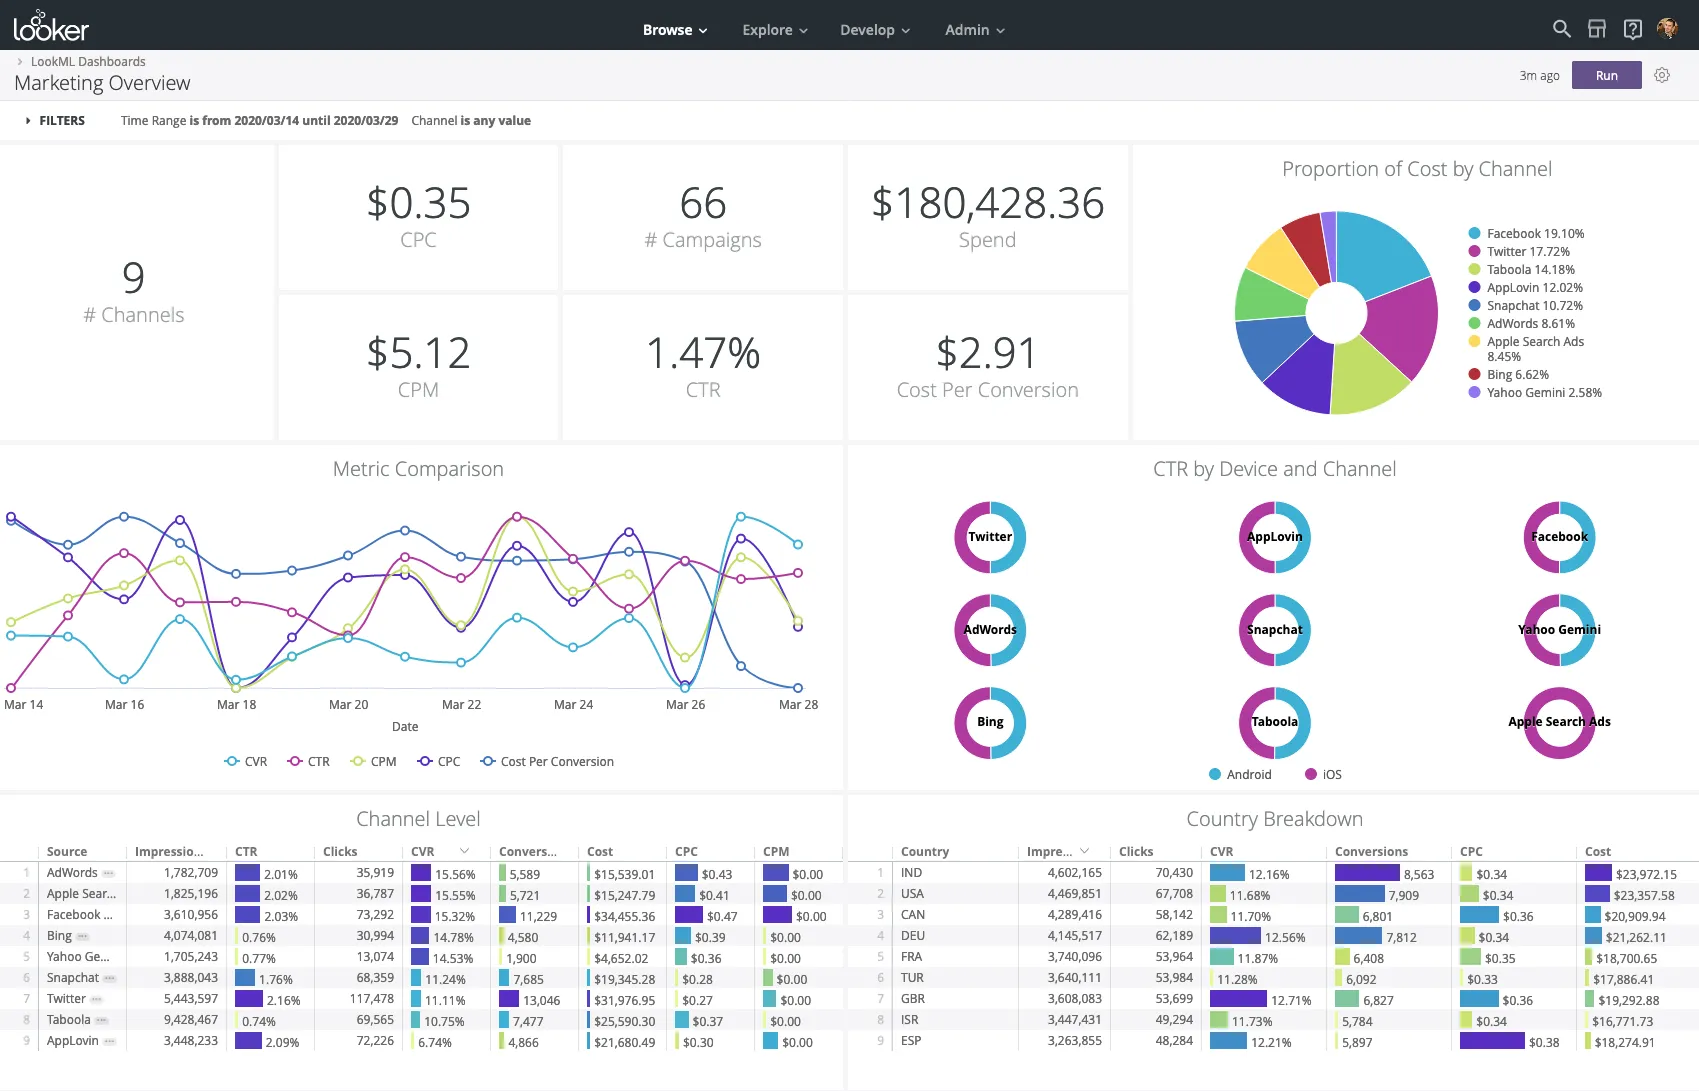
Looker dashboards
Put Looker Studio reports on screens in executive areas. Connects via embed URL and refreshes on your configured schedule.
Explore Looker dashboards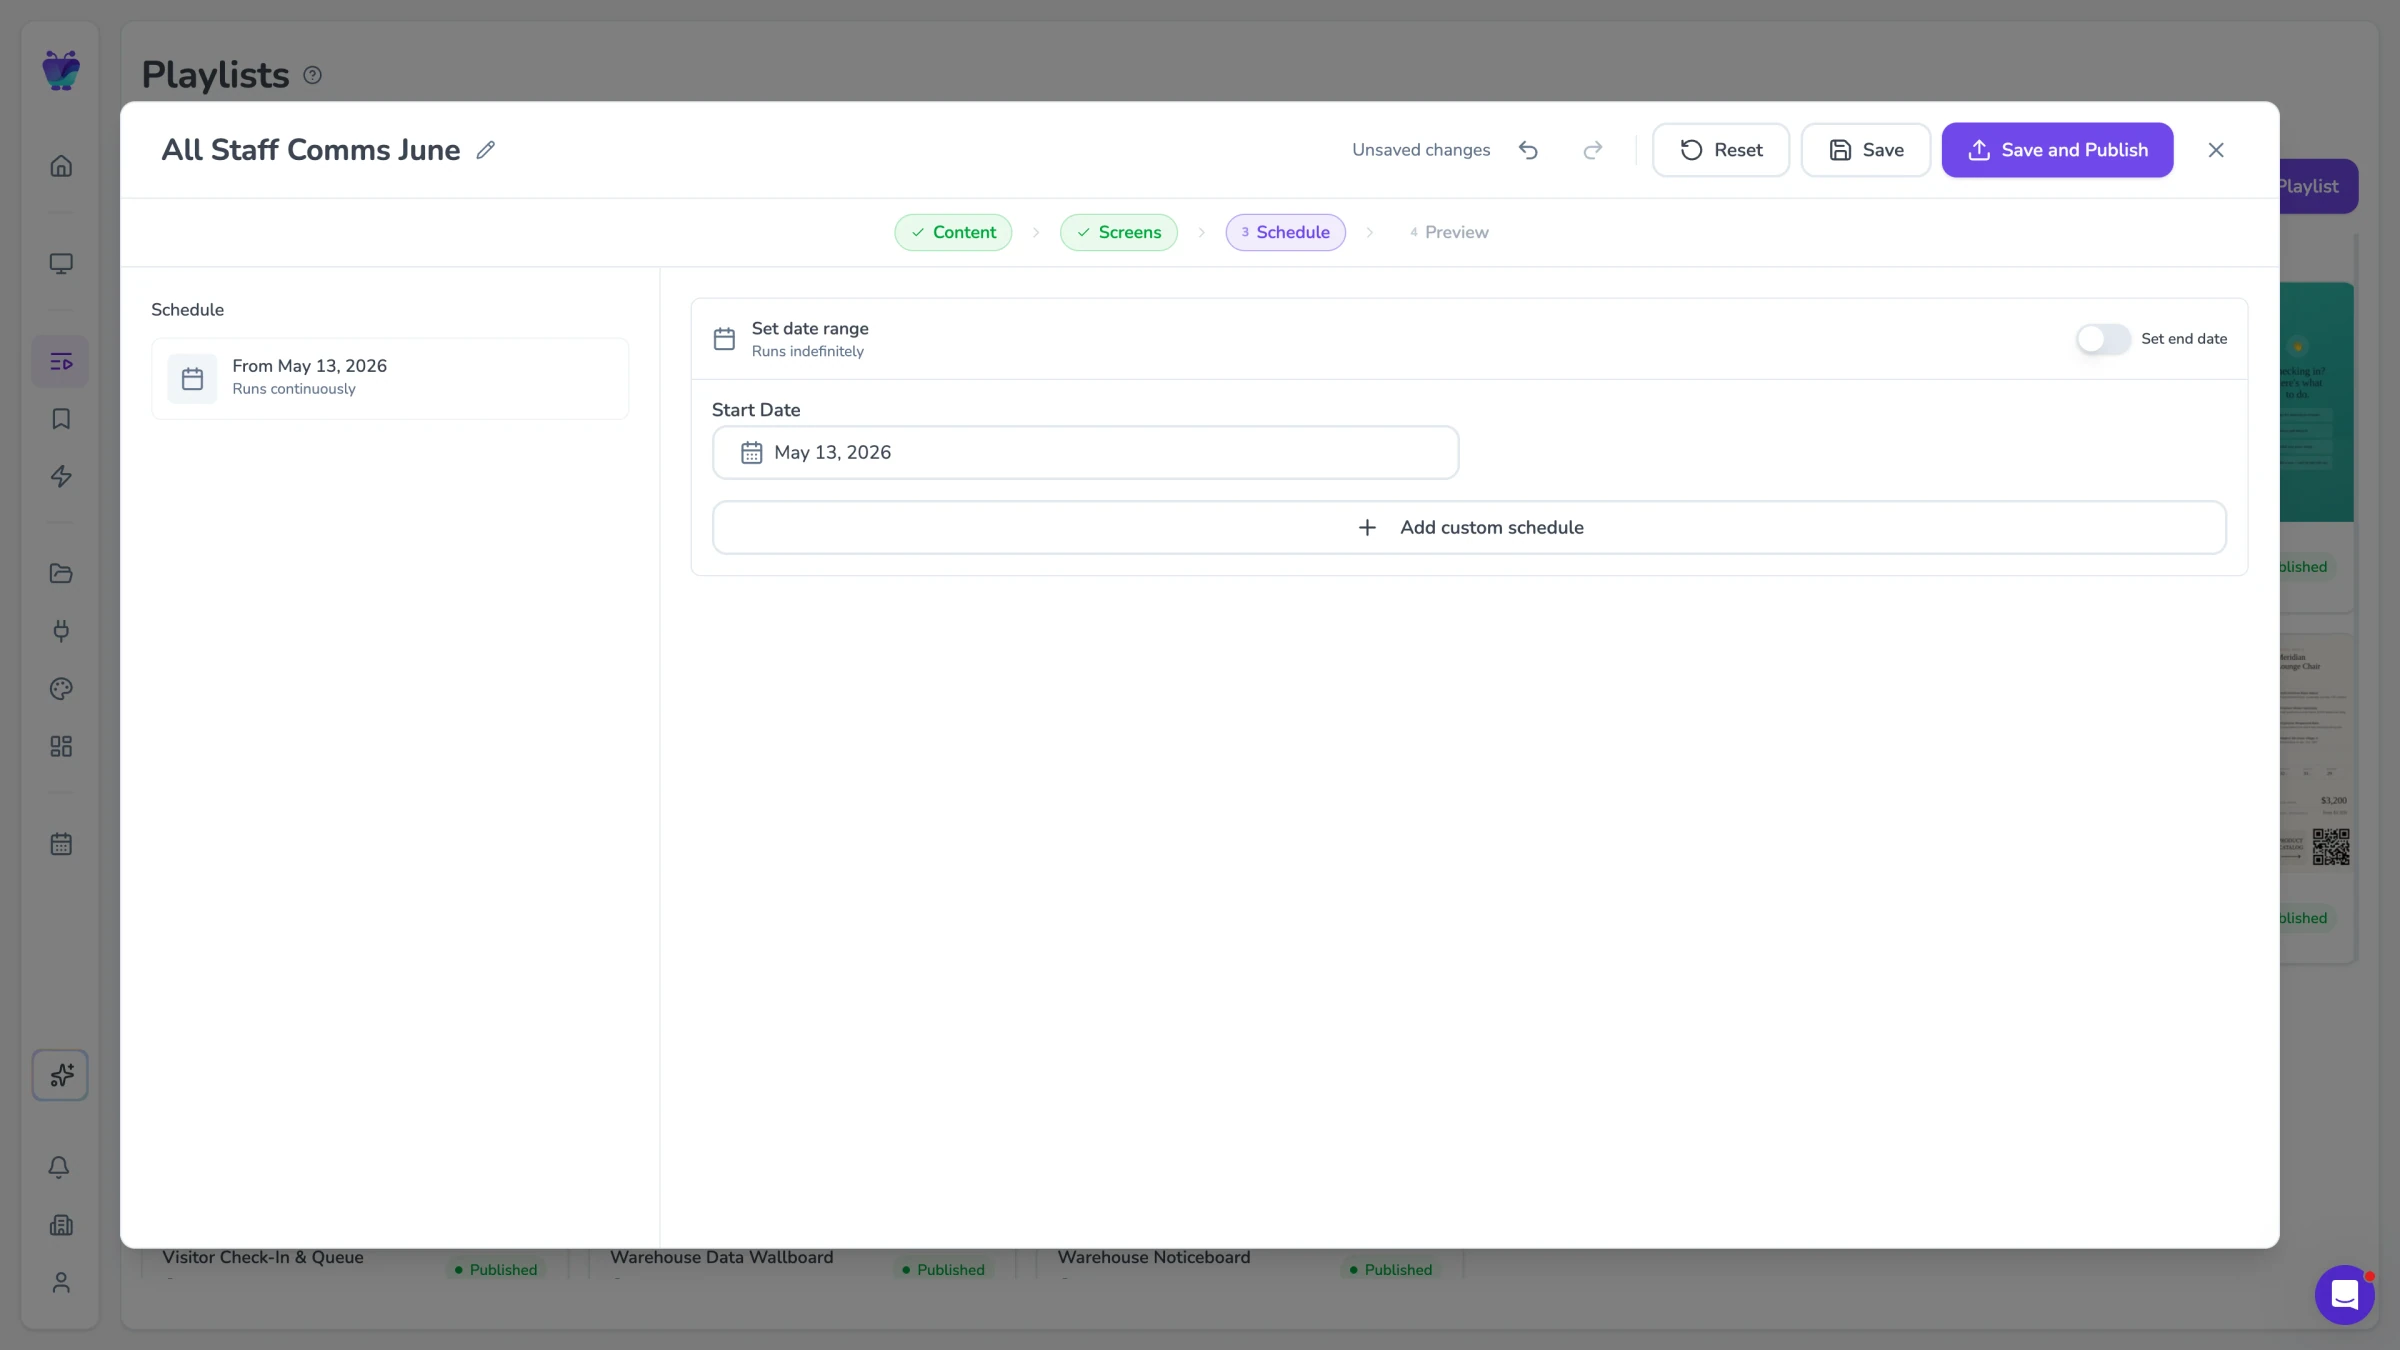
Content scheduling
Schedule different dashboards for different times. Show financial data during business hours, switch to strategic initiative boards during board meetings.
See content triggers