

Bloomberg Terminal
3 min read · Updated November 12, 2026
Access real-time financial data, analytics, and trading tools with the Bloomberg Terminal dashboard, designed for informed investment decisions.
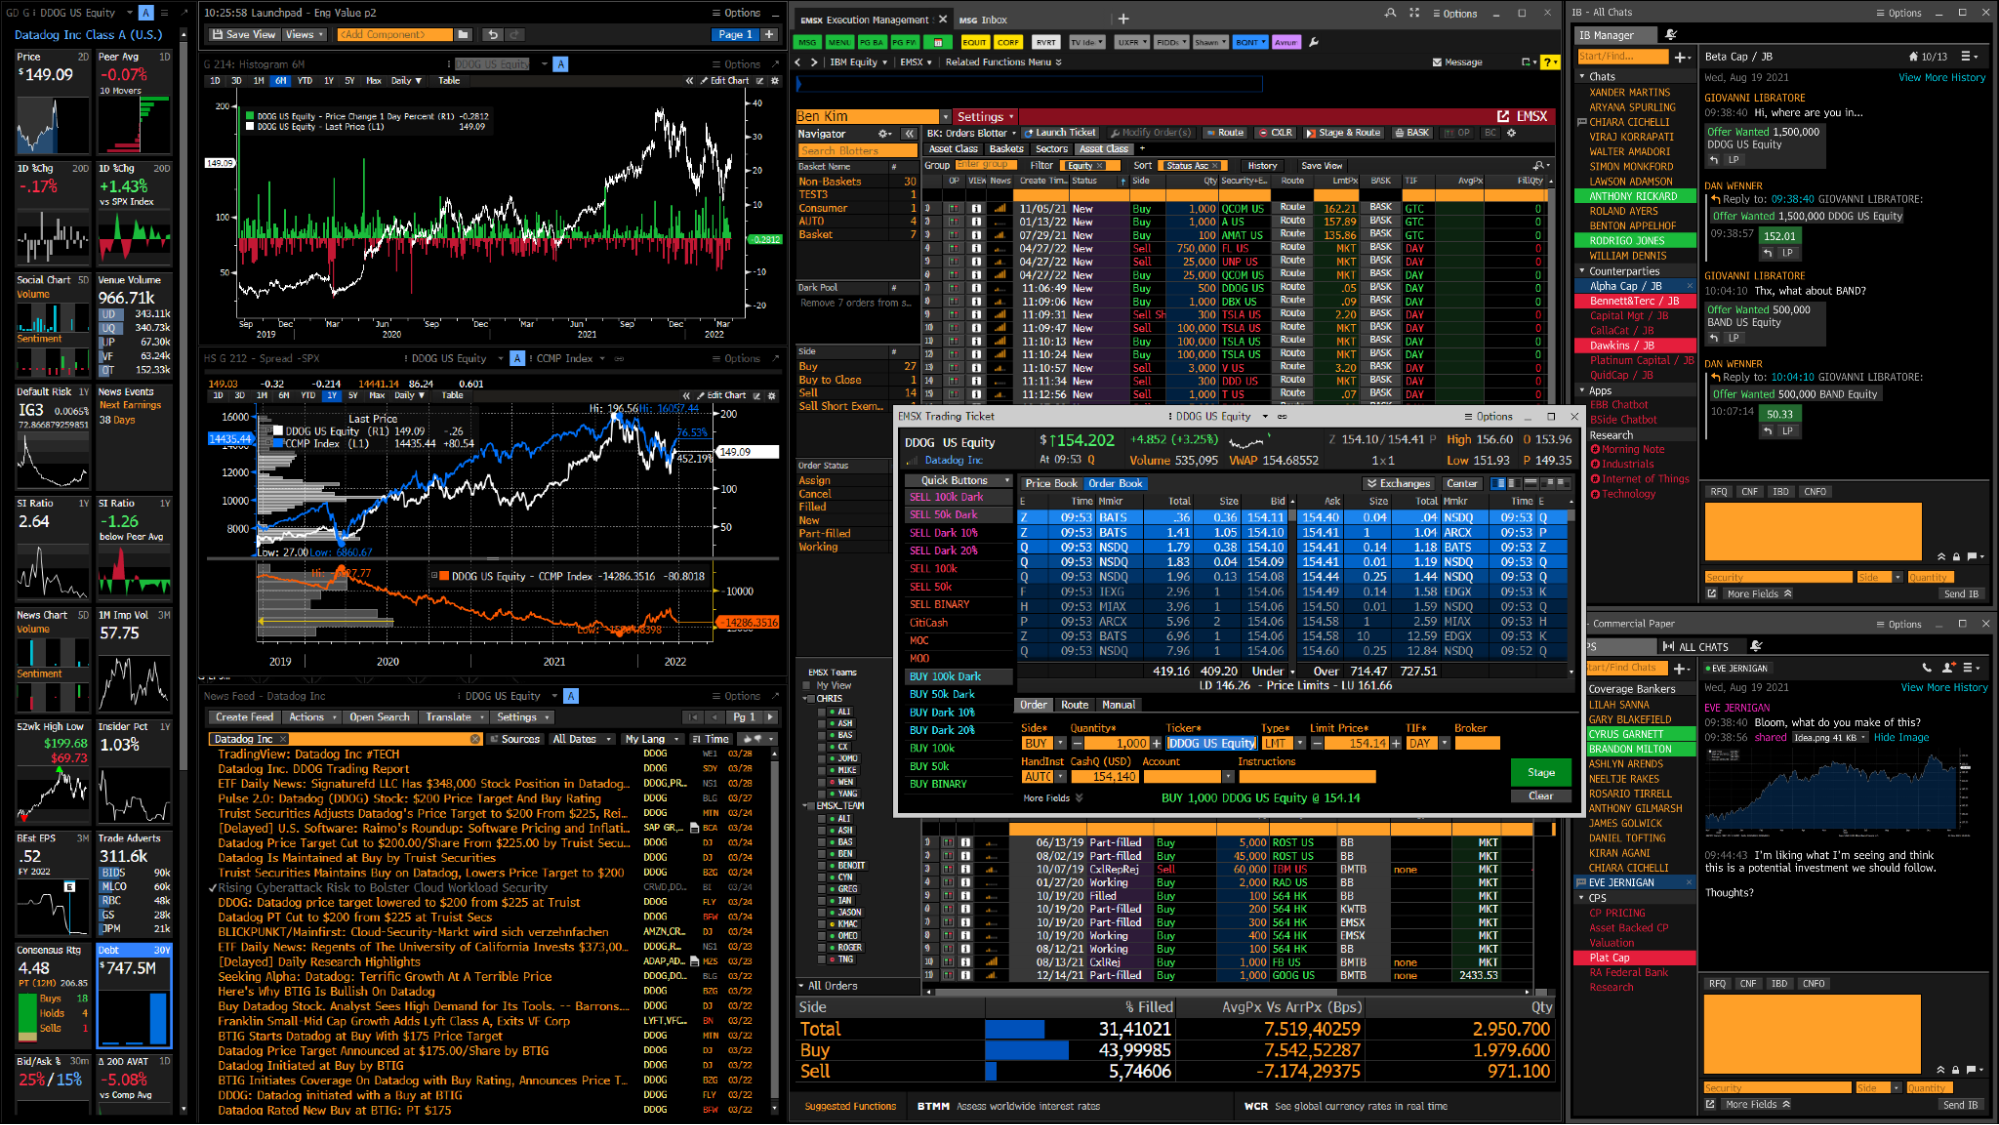
The Bloomberg Terminal is a software system that provides financial data, analytics and trading tools to professionals. Because it is a licensed desktop product, the practical question is which web-viewable market views can safely go on a shared screen.
Key takeaways
The Terminal covers market data, charting, economic indicators, news and portfolio tools.
Check what your Bloomberg agreement allows before displaying data on shared screens.
Fugo loads dashboards and web pages, so choose a view that can open in a browser.
Keep messaging and portfolio detail off the wall.
What the Terminal offers
These are the main capabilities. They help decide what is worth showing.
Real-time financial data
Market data is the core of the product, and a few key prices suit a wall.
Charting and technical analysis
Charts are readable at a distance if kept simple.
Economic indicators
Indicator releases give a trading floor a shared reference point.
Integrated news
Headlines keep a team aware of events that may move markets.
Portfolio tools
Portfolio views carry sensitive information and need extra caution.
Alerts
Customizable alerts show the thresholds a team already cares about.
Who uses it and what to show them
| Role | What to put on the screen |
|---|---|
| Traders | A short list of prices and a chart for the instruments they follow. |
| Analysts | Economic indicators and the research themes of the day. |
| Portfolio managers | Aggregate performance figures, with positions kept private. |
| Corporate treasurers | Rates and currency levels relevant to the business. |
Put a market view on a screen with Fugo
If your view can be opened as a web page, the process is short.
- 1
Pick a browser-viewable page
Choose a dashboard or web page with the prices, charts or indicators you need. Check that its terms allow display on shared screens.
- 2
Connect it to Fugo
Add the a market view page in Fugo and enter the sign-in details. Fugo stores the credentials encrypted and signs in on your behalf, and it can generate the one-time codes if the account uses two-factor authentication.
- 3
Crop and position the view
In Design Studio, crop the page to the charts that matter and set the scroll position, so the screen shows data rather than menus and toolbars.
- 4
Set the refresh interval
Choose how often Fugo loads a fresh view, from every few minutes to a few times a day. The screen shows a regularly refreshed snapshot, not a live video feed.
- 5
Add it to a playlist
Put the dashboard in a playlist, set how long it stays visible, and rotate it with other dashboards if the screen is shared. Then assign the playlist to the screens that need it.
Confirm the data rights first
Market data is usually licensed under specific conditions. Confirm with Bloomberg or your compliance team what may be shown on shared or public screens, and keep secure messaging and client information off the display. See financial dashboard displays for related layouts.
Frequently asked questions
What is the bloomberg terminal?
How can I customize the dashboard?
Can I access the terminal remotely?
Similar dashboards
Other dashboard tools that work with Fugo
Power BI for Education
Transform educational data into actionable insights with Power BI for Education, optimizing student performance and institutional efficiency.
Power BI for Utilities
Gain insights into utility operations with Power BI, enabling data-driven decisions through real-time analytics and performance metrics.

Revinate
Revinate's dashboard offers real-time insights and analytics to enhance guest experiences and streamline hotel operations efficiently.