

Loading dashboard information...
Loading dashboard information...
Gain insights into utility operations with Power BI, enabling data-driven decisions through real-time analytics and performance metrics.
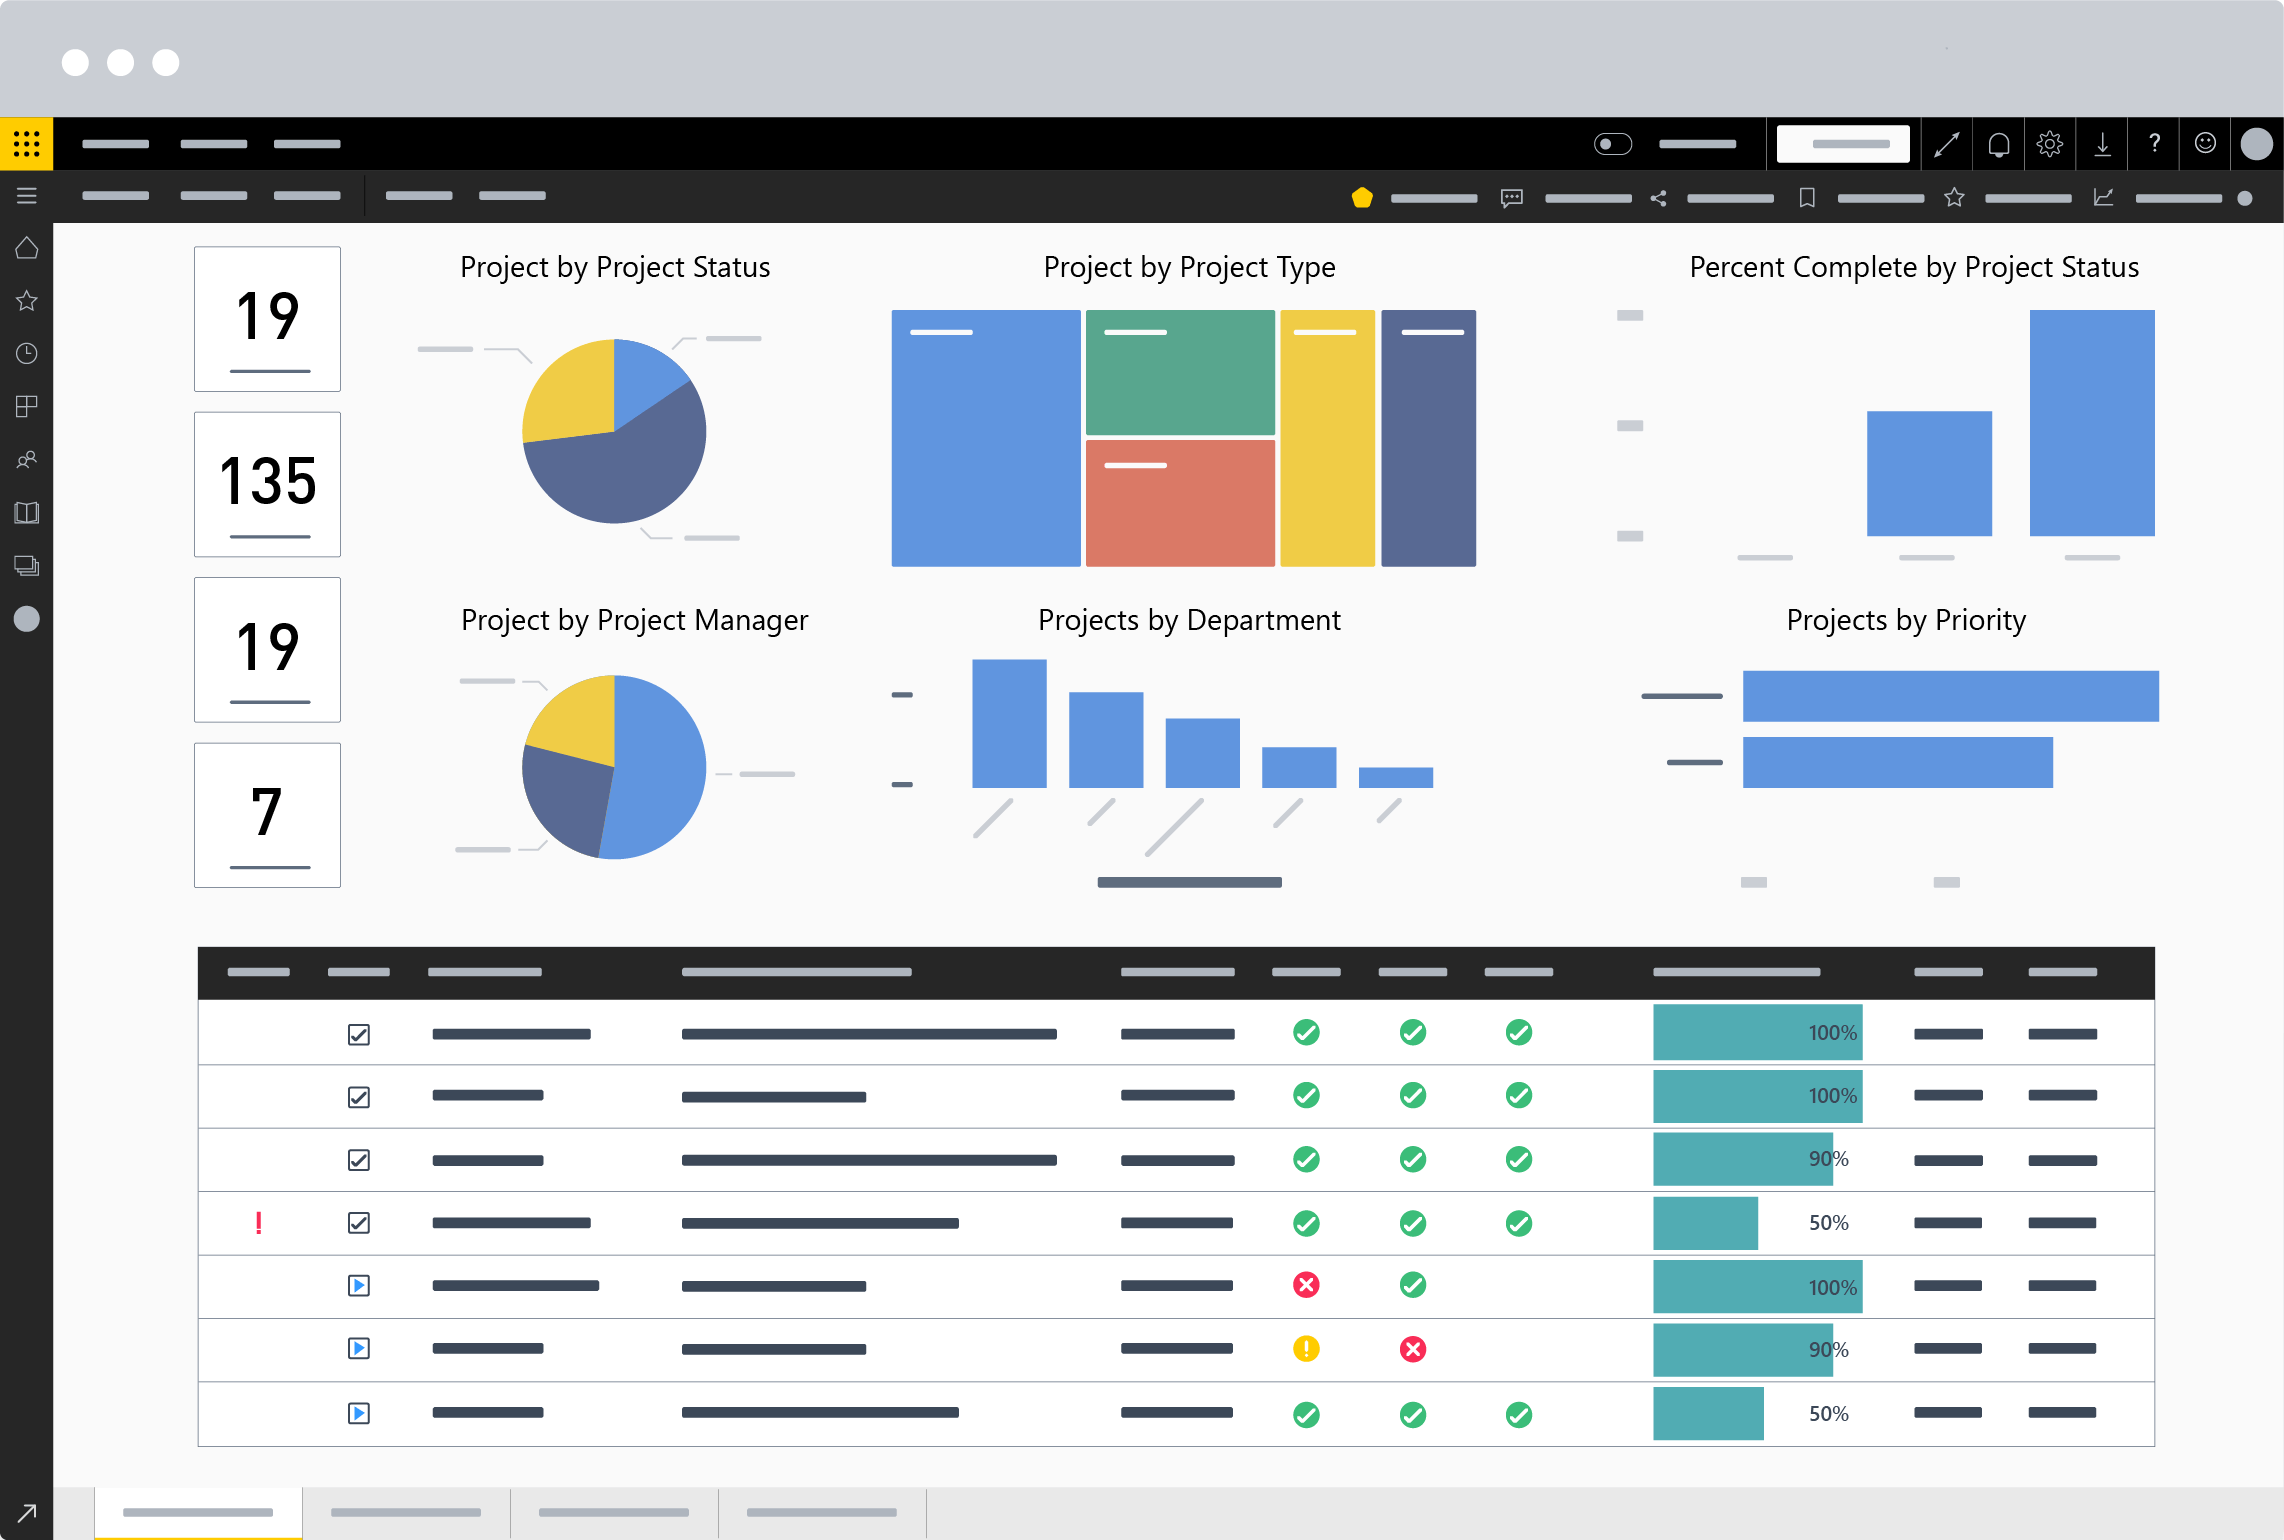
The Power BI for Utilities dashboard provides a comprehensive view of operational efficiency across various utility services. It integrates data from multiple sources, allowing utility companies to monitor energy consumption, water usage, and waste management in real-time. By visualizing key performance indicators (KPIs), utility managers can identify inefficiencies, optimize resource allocation, and reduce operational costs. The dashboard's interactive features enable users to drill down into specific data points, facilitating detailed analysis and strategic planning.

This dashboard is designed for utility companies, including energy, water, and waste management sectors, seeking to enhance their operational efficiency and decision-making processes. It is particularly beneficial for operations managers, data analysts, and executives who require a comprehensive understanding of their utility services' performance. Additionally, regulatory bodies and consultants in the utilities sector can leverage this dashboard to monitor compliance and advise on best practices.
Other dashboard tools that work with Fugo
Gain insights into utility operations with Oracle Utilities Analytics, enhancing decision-making through comprehensive data visualization.

Monitor and analyze real-time operational data efficiently with the OSIsoft PI System dashboard, enhancing decision-making and performance insights.
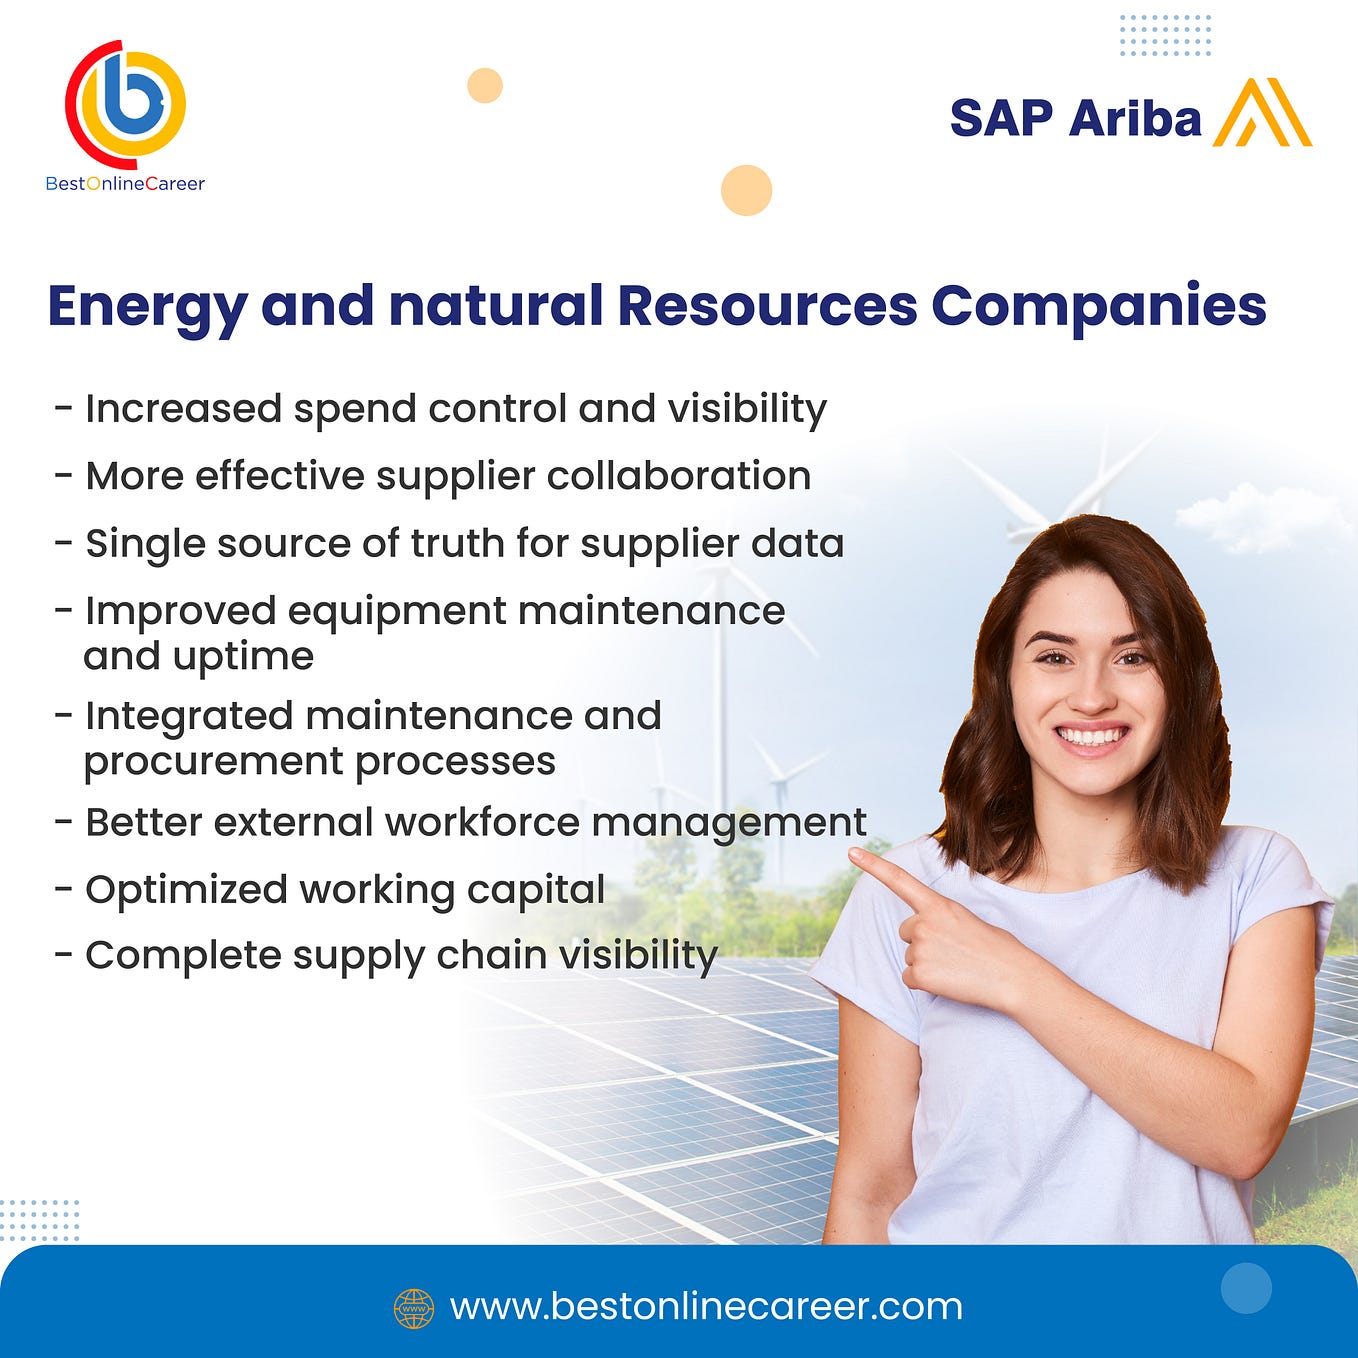
The SAP Energy and Natural Resources dashboard provides real-time insights and analytics to optimize operations and enhance decision-making efficiency.