

Financial dashboard displays
Put financial dashboards from NetSuite, QuickBooks, and Power BI on shared TV screens. Finance teams stay aligned on current numbers without waiting for monthly reports or chasing down ad-hoc data requests.
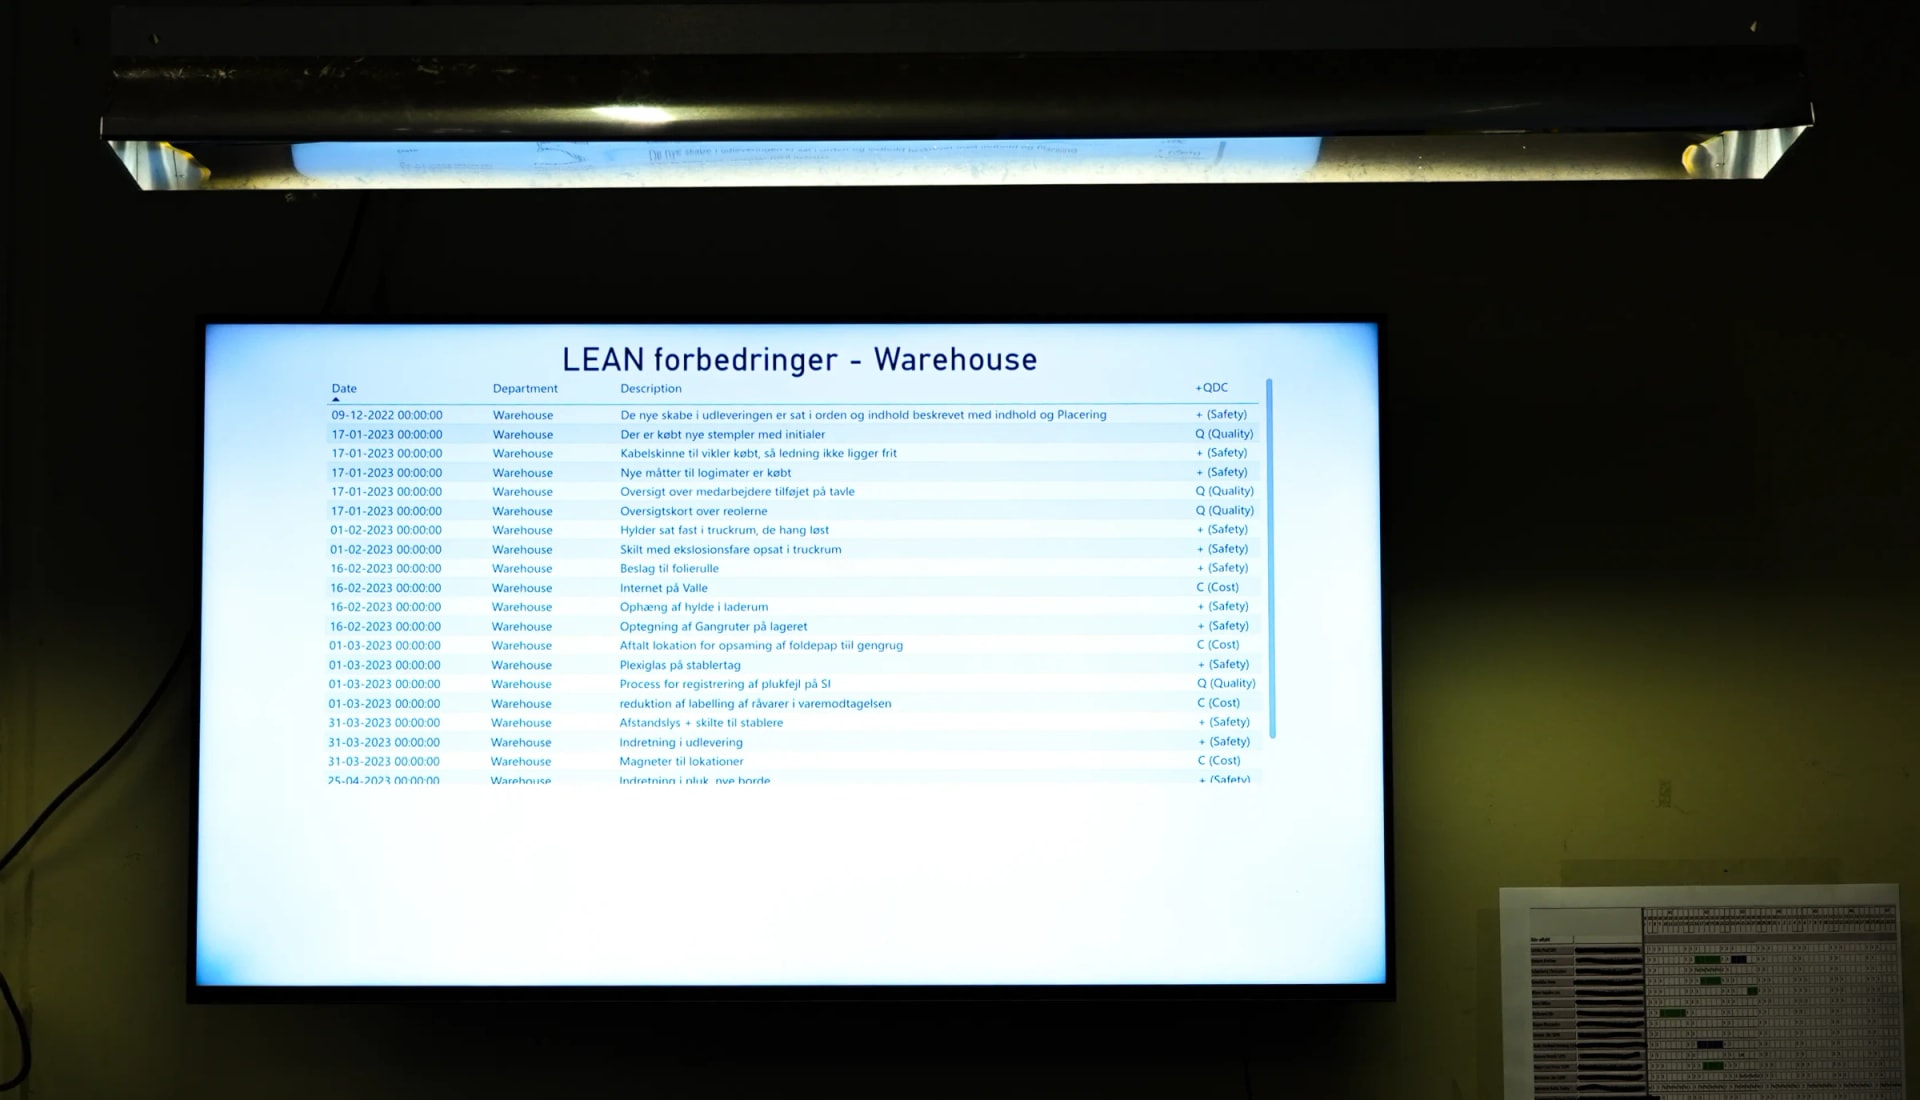
Why finance teams put dashboards on screens
Create a shared source of truth
When the same numbers are visible to everyone in the room, you cut the back-and-forth Slack threads asking "can you pull that number." One screen, one version of the data.
Reduce ad-hoc reporting burden
Finance teams spend hours fielding one-off data requests from department heads. A visible dashboard answers the most common questions before anyone has to ask.
Keep leadership aligned without slide decks
Executives and department heads see current financial performance as they walk past. No waiting for the monthly board deck to know where things stand.
Track close progress where the team can see it
During month-end close, a visible status board helps the team track reconciliation progress, spot bottlenecks, and hold each other accountable on deadlines.
Monitor cash positions without opening netSuite
Treasury and finance leadership can glance at cash and liquidity metrics throughout the day. No logging in, no waiting for reports to load.
Support budget accountability across departments
When budget vs. actual comparisons are visible on a shared screen, spending conversations happen naturally. Department heads self-correct before finance has to intervene.
What finance teams show on screens
Finance displays typically combine P&L metrics, cash flow data, and operational finance KPIs pulled from your existing reporting tools.
Revenue and p&L metrics
Revenue, margins, expenses, and profitability tracked against targets.
Cash flow and liquidity
Cash positions, burn rate, receivables, and payables in one view.
Budget vs. actual comparisons
Spending against budget with variance highlighting by department.
Month-end close progress
Reconciliation status, open items, and deadline tracking for close cycles.
Accounts receivable aging
AR aging buckets, collection rates, and outstanding invoice status.
Financial ratios and trend indicators
Key ratios, efficiency metrics, and trailing trend lines over time.
Fugo features for finance displays
Fugo connects to your existing financial tools and puts live dashboards on any screen you control.
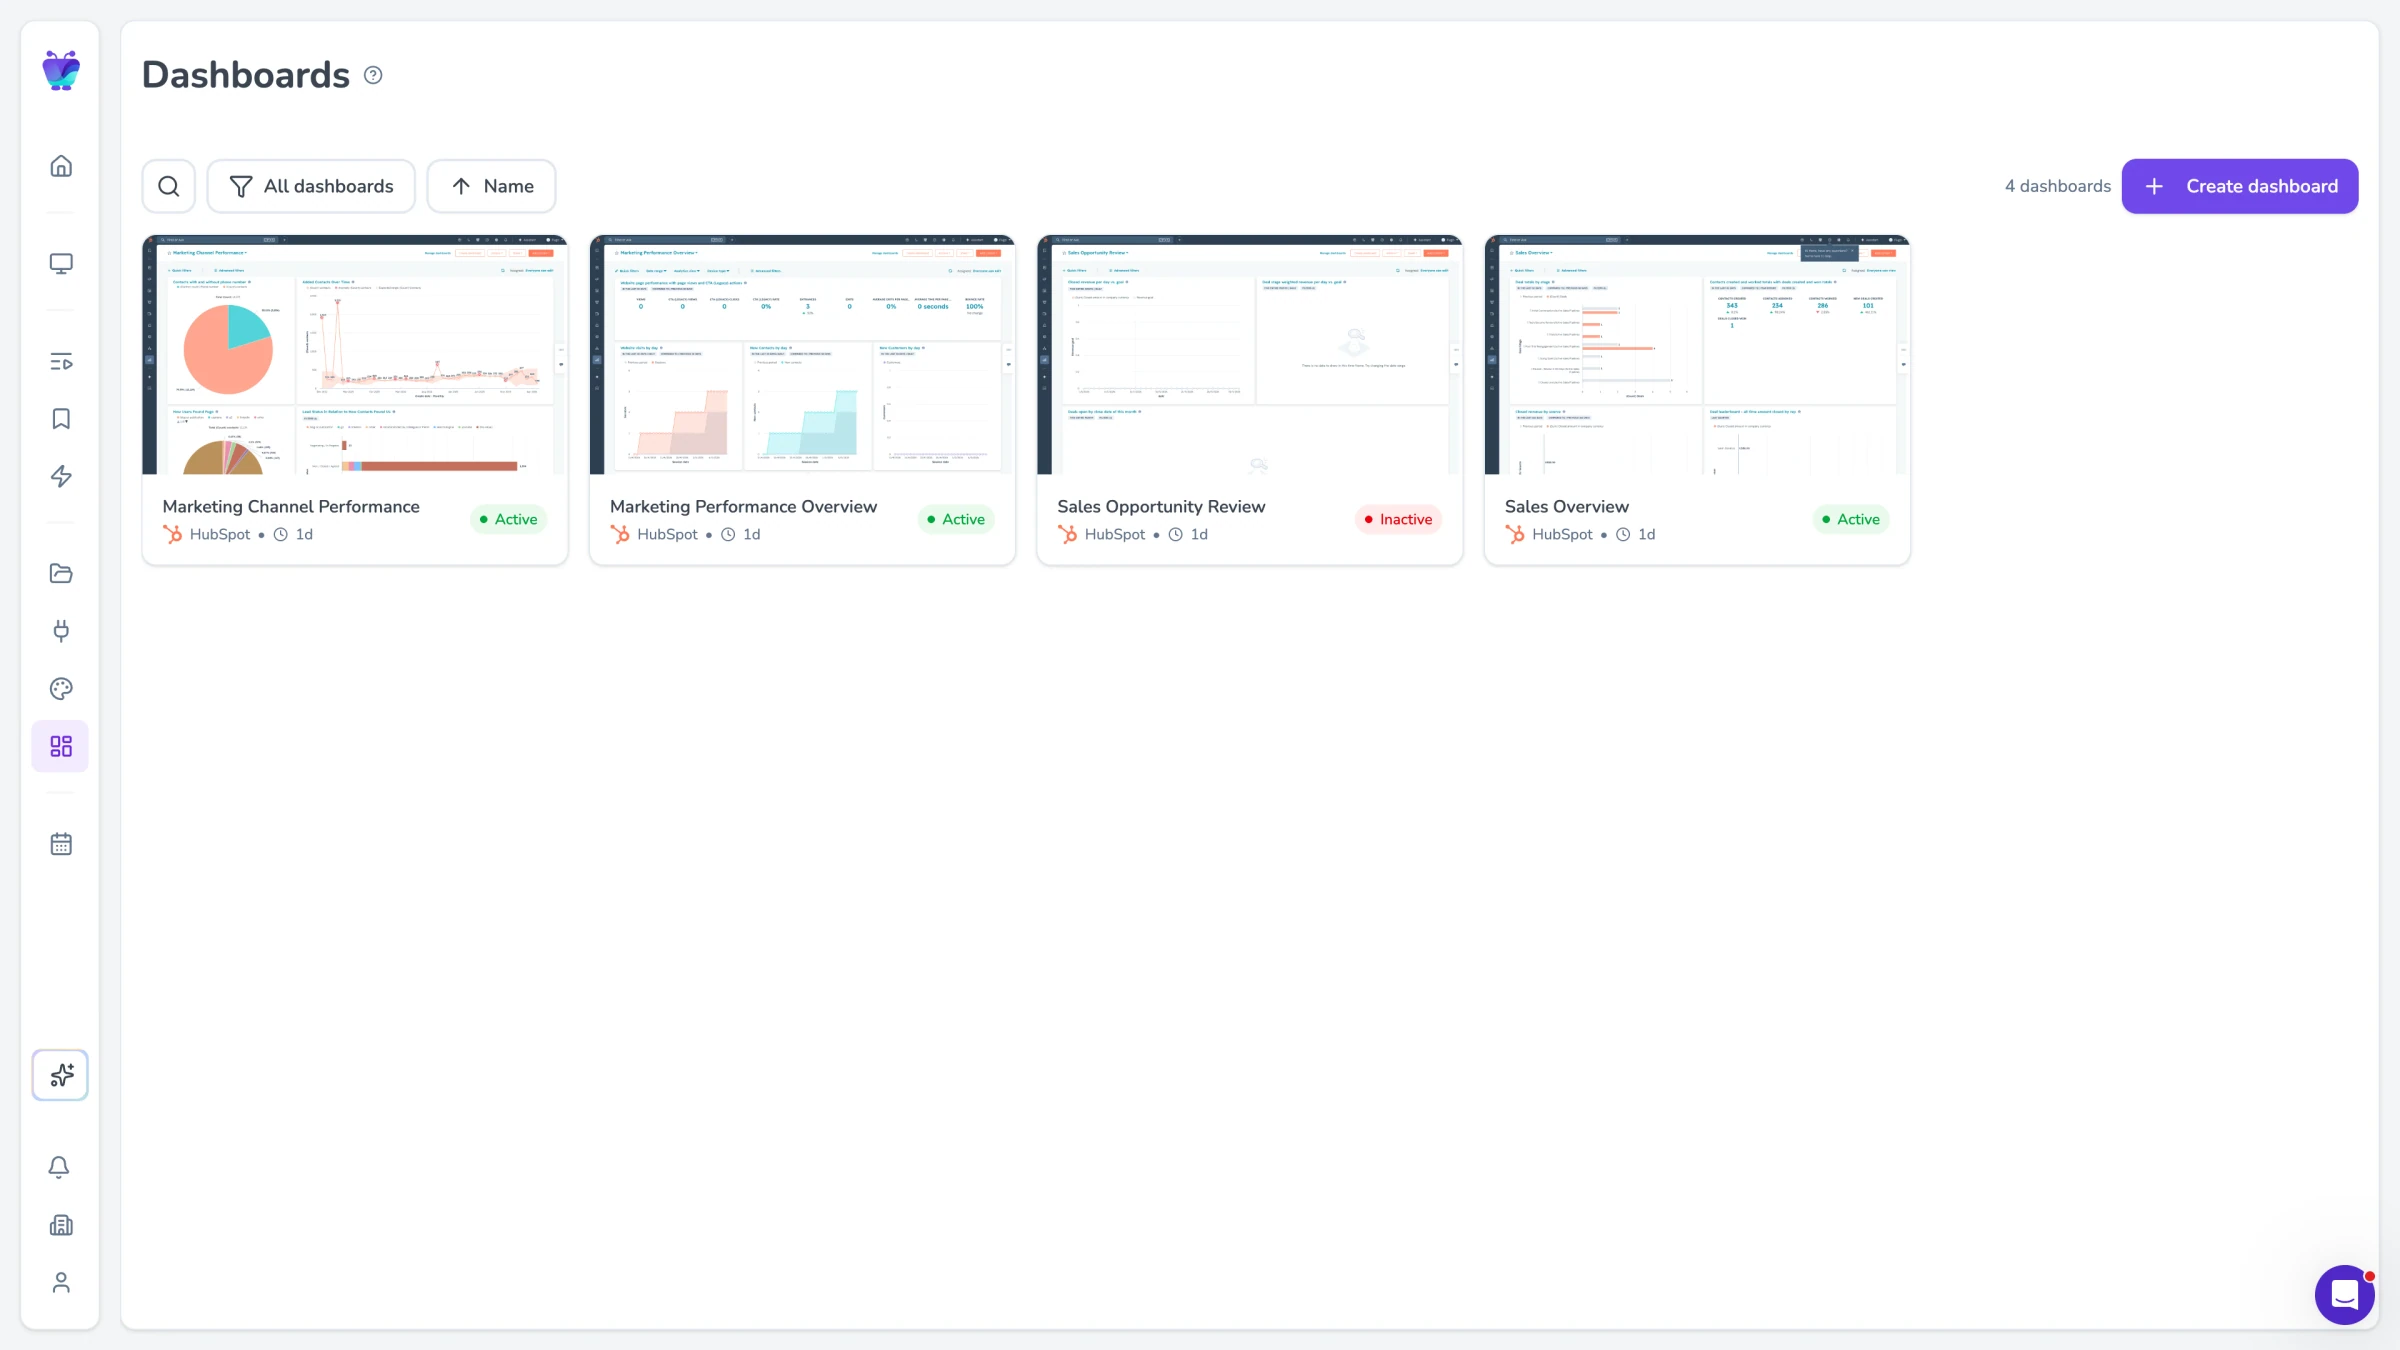
Dashboard integrations
Display dashboards from NetSuite, QuickBooks, Xero, Power BI, Tableau, or any tool with a web-based reporting view. If it runs in a browser, Fugo can show it on a screen.
Explore TV dashboards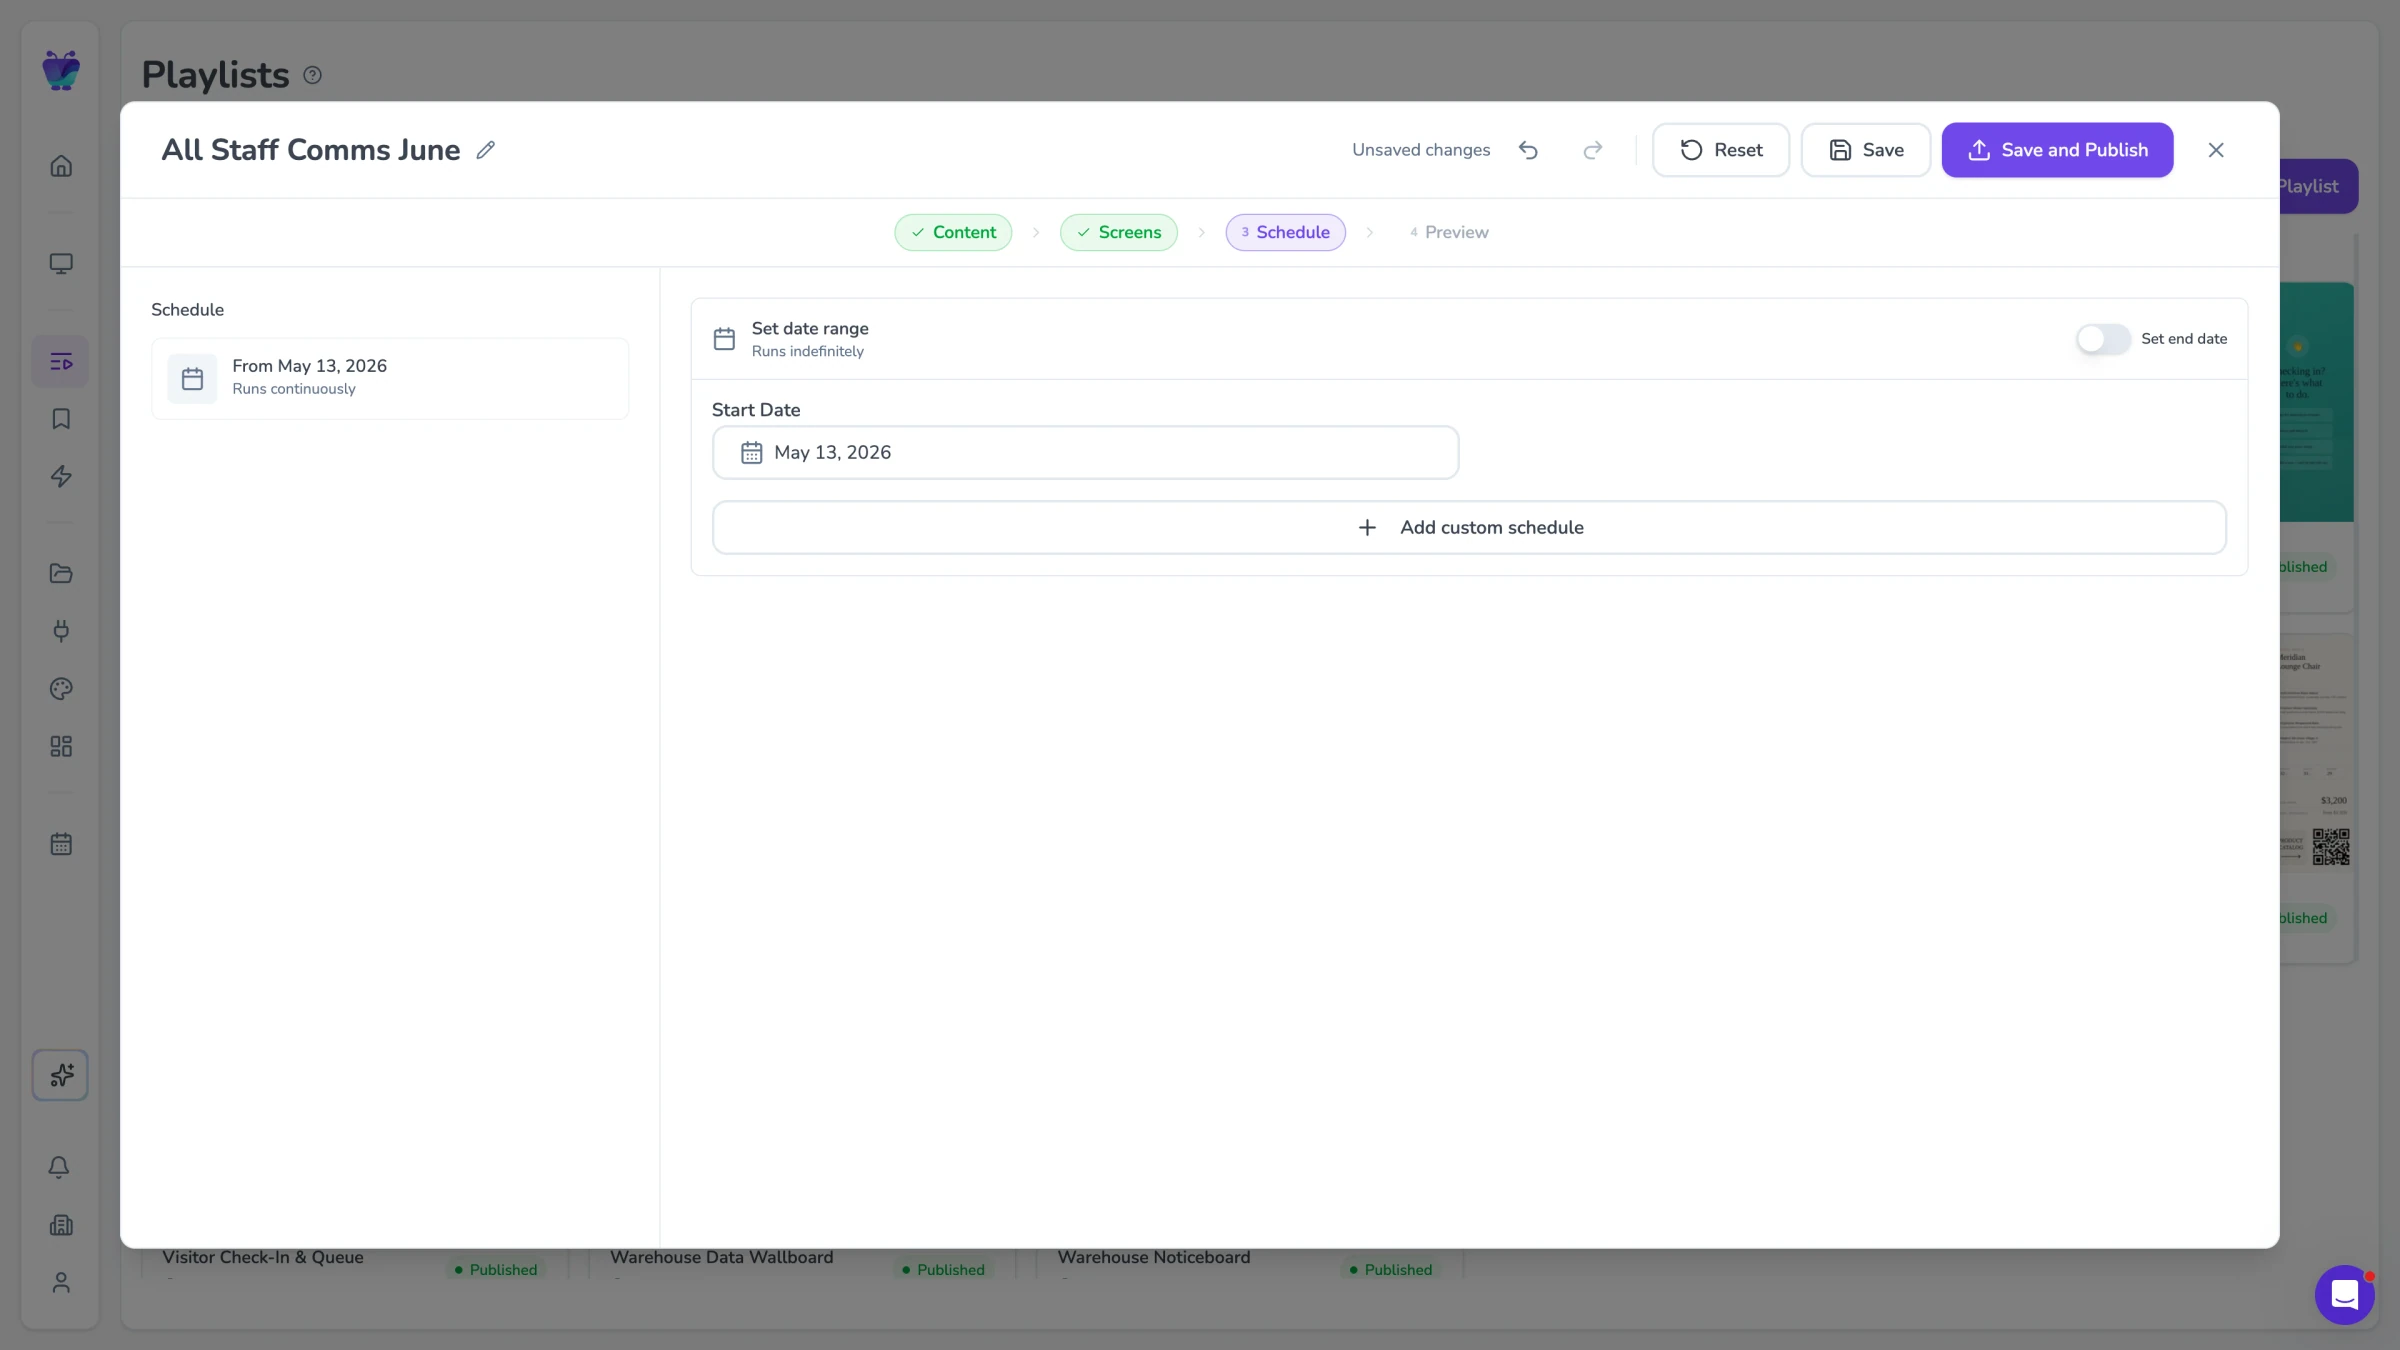
Content scheduling
Schedule different content for different audiences. Show detailed metrics during business hours and summary views after hours, or rotate between dashboards on a timer.
See content triggers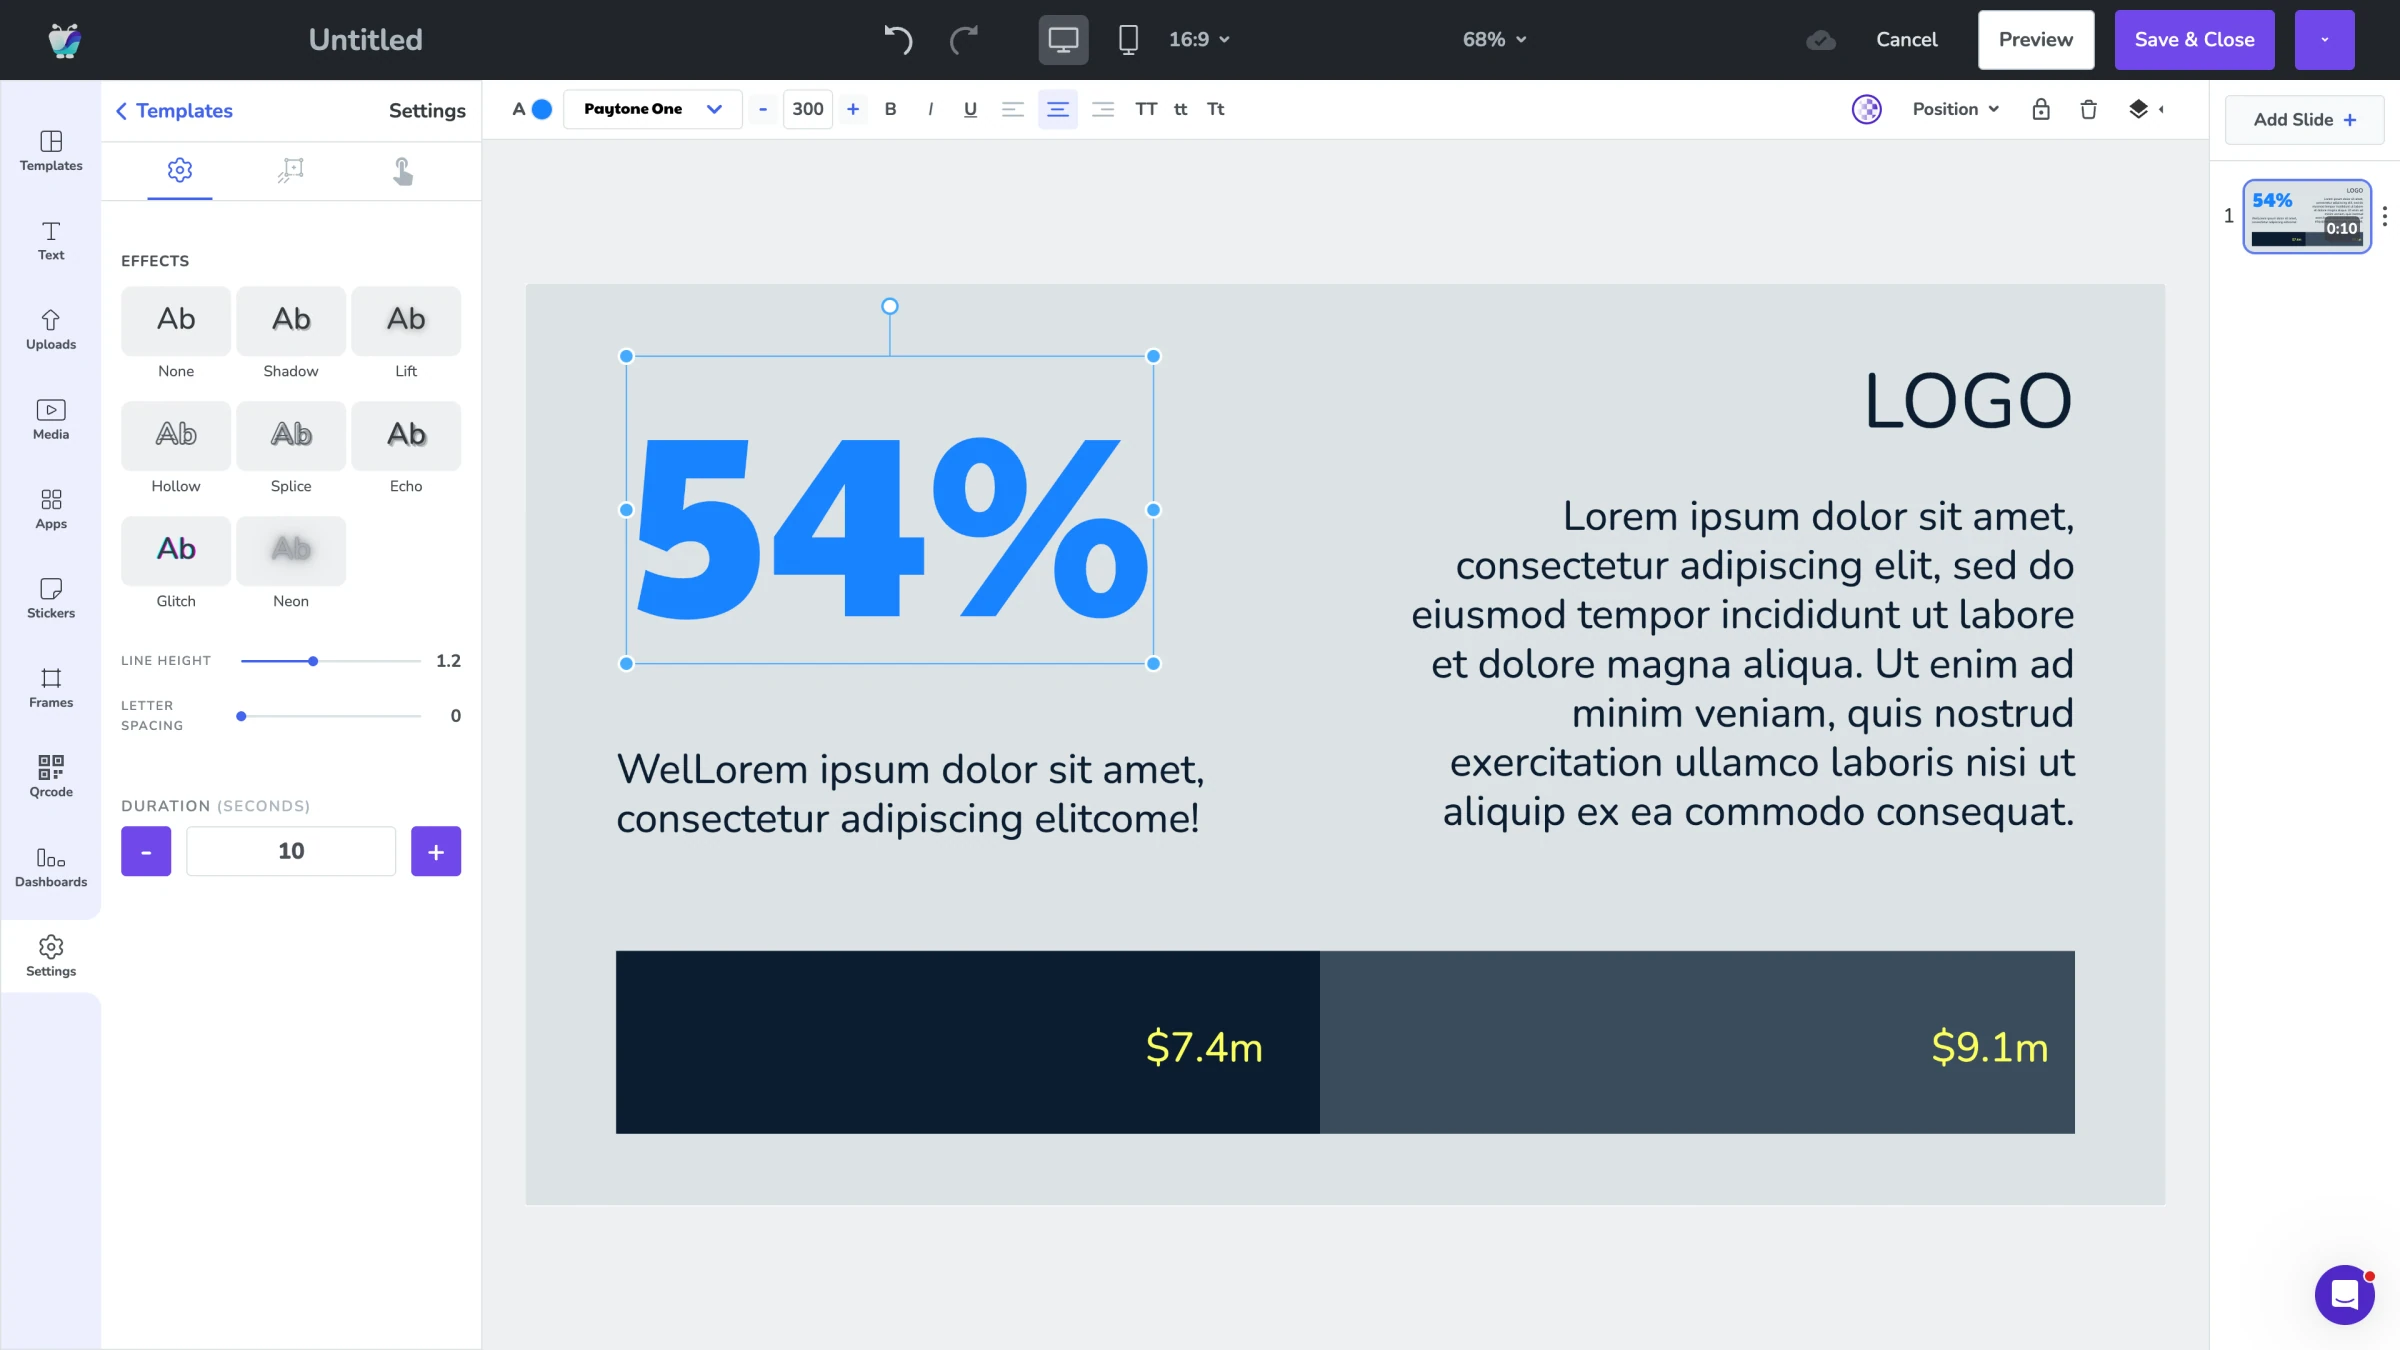
Design Studio
Combine multiple data sources on a single screen using the drag-and-drop editor. Place a P&L summary next to a cash flow chart and a close progress tracker.
Explore Design Studio
Screen and user management
Control who can configure financial displays, which screens show sensitive data, and manage everything from a single dashboard across locations.
See all features