


A production target in a supervisor's browser does little for the person packing the next order. Lean visual management brings that target, the current result, and any gap between them into the shared workspace.
The Lean Enterprise Institute describes visual management as putting the work and its performance indicators in plain view, so everyone can understand the status at a glance. A whiteboard can do that. So can a screen showing a dashboard your team already uses.
This guide covers the main board types, how to choose between physical and digital formats, and how to put a lean board on a shop-floor or office TV.
What lean visual management means
Visual management makes normal conditions and abnormalities visible. A good board lets a team see whether work is following the standard, where it has drifted, and what needs attention.
That definition includes more than performance charts. The Lean Enterprise Institute lists tools, parts, production activities, and performance indicators. A labeled parts location can be visual management. A light showing a stopped machine can be too.
A lean board adds a response. When planned output differs from actual output, someone records the problem, finds the cause, and agrees on the next action. The production analysis board is a problem-solving surface, rather than a scheduling tool.
The board belongs near the gemba, the place where the work happens. It supports direct observation, huddles, and follow-up. A screen in a distant office cannot give a line-side team the same shared picture.
Continuous improvement, or kaizen, gives the practice its longer-term purpose. Teams make small changes, examine the results, and update the standard. The board keeps those changes and their effects visible.
Visual management boards by job
A visual management board shows the state of work, the expected standard, and the actions that follow a gap.
| Board | What to show | Where | Refresh cadence | Best for |
|---|---|---|---|---|
| SQDC/P or hour-by-hour | Safety, quality, delivery, cost, and people; plan versus actual | Line or cell huddle area | Live or hourly during the shift | Production cells |
| Andon or status | Line state, downtime reason and duration, help requested | Above the line or an aisle-visible wall | Seconds to minutes | Fast response to stops |
| Kaizen or continuous improvement | Ideas, work in progress, completed changes, owners, and due dates | Team area or break-room TV | Daily or at each huddle | Improvement tracking |
| Gemba | Walk findings, open actions, standard versus actual | Near the process being observed | After each walk or daily | Leader standard work |
| Warehouse or operations | Pick rate, orders shipped, dock status, labor versus plan | Pick zones, docks, and staging | Live or every 5 to 15 minutes | Distribution teams |
| Office or support | Tickets, service levels, pipeline, work versus target | Team bay or stand-up TV | Every 5 to 15 minutes or hourly | Service and office teams |
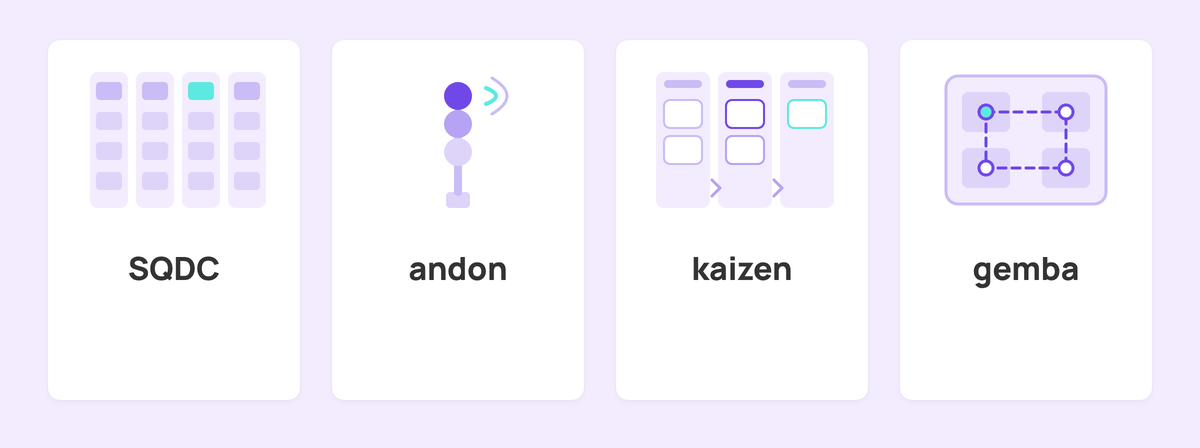
An andon board signals an abnormality and summons help. A kaizen board keeps improvement ideas visible until someone tests, completes, or rejects them. A gemba board records observations where value is created, adding context to the numbers.
For a warehouse-specific take on shared screens, see how to improve warehouse operations with digital signage.
Physical boards and digital boards
Physical and digital boards can both support lean. The useful question is who needs the information, how quickly it changes, and where it comes from.
| Option | Good fit | Main limitation |
|---|---|---|
| Printed sheets or a whiteboard | Co-located huddles, handwritten problem notes, and simple daily routines | Someone must transcribe and maintain the information |
| Dedicated andon or plant display | Machine events, immediate response, and controls built into the production process | Usually tied to plant systems and specialist integration |
| Laptop connected to a TV | A short trial or a temporary meeting display | Sleep, expired sessions, and a laptop left beside the screen |
| Digital signage | Existing browser-based dashboards across lines, shifts, sites, and office teams | The source dashboard and its refresh cycle still determine the data |
Whiteboards make discussion tactile. Writing a number or problem can be part of the huddle. They also depend on someone remembering to update every figure.
Digital boards reduce that transcription work and let several locations share one view. They still need an owner, a clear target, and a decision about what happens when a number turns red.
Keep the responsibilities straight. Plant systems calculate production metrics and manage machine-level alerts. Fugo is the display layer for dashboards those teams already use. It does not calculate OEE, connect directly to a PLC, or replace andon controls.
Many teams combine formats: a whiteboard for actions beside a screen for live status.
What makes a board useful
Start with the question the team needs to answer. "Are we having a good day?" is more useful than a collection of charts copied from a desktop report.
Mark Hamel's LEI guidance on visual management argues for simple, timely metrics against an unambiguous target, used in frequent team huddles. His warning about unmaintained "visual pollution" is a useful design test.
A workable board has five things:
- A small set of metrics. Keep the measures the team can understand and influence during its shift.
- A target and a clear state. Show plan versus actual, with one consistent meaning for colors.
- Readable hierarchy. Put the few decisive numbers first and size them for the viewing distance.
- A suitable cadence. Match updates to the response window, from a stopped line to a daily improvement review.
- An owner and a ritual. Name who acts on a gap, and use the board in the huddle where decisions happen.
A timestamp helps people judge freshness. So does an explicit unavailable state when a source stops responding.
For more on overloaded charts, missing context, and stale information, read our guide to common KPI board mistakes.
Continuous improvement boards that stay alive
A kaizen board makes small changes visible as work, rather than good intentions. A simple flow is enough: idea, agreed test, in progress, and done. Give each item an owner and a date for review.
Use the huddle to choose the next test and remove obstacles. Record what changed and what the team learned. A completed idea should lead to a new standard, another test, or a clear decision to stop.
A gemba board connects that work to direct observation. After a walk, record the condition, the gap from the standard, and the follow-up action for the next visit.
The same pattern works beyond manufacturing. An office team can track a recurring service failure on a shared screen, with the same improvement loop.
Review the board itself too. Remove resolved items, retire measures nobody uses, and keep the current standard visible. If your sources sit in separate BI tools, our roundup of BI dashboards on office screens compares common starting points.
How to put a lean board on a TV
Start with the dashboard your supervisor already trusts. Choose the view that answers the team's daily question, then simplify it for a wall. A dense analysis screen with filters and tiny tables will not become readable just because the TV is larger.
Next, decide where the screen belongs and how current the view needs to be. A line-side andon display has a different refresh requirement from a daily kaizen board. Check both the dashboard's own update cycle and the signage refresh interval.
For temporary use, a laptop and HDMI cable can test the idea. For an unattended screen, you need a setup that handles sign-in, refresh, and recovery without someone reopening a browser each shift.
Fugo TV Dashboards displays auto-updating snapshots of business dashboards, BI reports, and password-protected pages on signage screens. According to the setup guide, the basic flow is:
- Add the dashboard. Choose a supported provider or Custom, then enter its URL.
- Provide access once. Fugo stores the connection credentials and repeats the sign-in when it refreshes the dashboard. Password and 2FA-protected pages are supported.
- Choose where it renders. Cloud is the default. On-Premise and Local Player options cover dashboards that need access inside your network.
- Set the refresh. Fugo captures a fresh screenshot on your chosen interval while the dashboard is published to an active screen.
- Prepare the layout. Crop or combine dashboard content in Design Studio when the original page needs adjusting for a TV.
- Publish to the screen. Add the dashboard to a playlist, target the relevant screens, and publish the playlist.
The result is a renewed snapshot on a schedule, not a promise that every source is instantaneous. For Local Player on a supported Windows device, the guide also documents an optional live-streaming mode.
TV Dashboards is enabled through a demo call, so bring the actual dashboard URL and any network or sign-in requirements to that conversation.
FAQs
What is lean visual management?
Lean visual management puts work, standards, and performance in plain view so people understand the current status at a glance. It helps a team spot the gap between normal and actual conditions, discuss the cause, and respond. Boards support that system alongside huddles, observation, and ownership.
What is a visual management board?
A visual management board is a shared display that shows the state of work against an expected standard. It can be a whiteboard, a set of physical signals, or a digital screen. Useful boards make abnormalities and required actions clear to the people doing the work.
What should be on a visual management board?
Show the measures, conditions, and actions the team needs for its next decision. A production board might cover safety, quality, delivery, cost, and people, with plan versus actual. A kaizen board needs improvement items, owners, and review dates. Include targets and freshness.
What is the difference between a kaizen board and an andon board?
A kaizen board tracks improvement ideas and tests over days or weeks. An andon board signals a current abnormality and calls for a quick response. The first supports the improvement cycle; the second highlights immediate operating status. A team may use both.
Is a physical or digital visual management board better?
A physical board suits co-located huddles and handwritten updates. A digital board suits frequently changing information, existing dashboards, and several screens or locations. Choose by response time, maintenance, and audience. Combining a digital status display with handwritten action notes is also a practical option.
How do I display a lean board on a shop-floor TV?
For a quick test, connect a laptop and open the dashboard. For ongoing use, digital signage can hold the dashboard on screen, refresh it, and manage which locations see it. Simplify the source view for distance, then check sign-in, network access, and refresh requirements.
How often should a visual management board update?
Match updates to the decision. Machine status may need changes within seconds or minutes. Hour-by-hour production needs shift-level updates. Improvement boards can change at a daily huddle. A screen cannot make the underlying source update faster than it already does.
Can I show a password-protected dashboard on a factory screen?
Yes, with a setup designed for authenticated dashboards. Fugo TV Dashboards can sign in with stored credentials, support password and 2FA-protected pages, and capture refreshed snapshots. Cloud, On-Premise, and Local Player rendering are available. Feature setup begins with a demo call.
How does visual management support continuous improvement?
It keeps the current condition, target, and follow-up actions visible between improvement events. Teams can see whether a change held, where the standard slipped, and which problem to test next. Kaizen and gemba boards give those actions owners and review dates, while huddles provide the decision routine.
Start with one board
Choose one recurring problem, one team, and one lean visual management board. Put its standard, current status, and next action on it, then use that board in the next huddle. Add more only when the first view earns its place.
If the source is already a dashboard, we can help you assess the display setup. Explore Fugo TV Dashboards and book a demo to enable the feature with our team. For line, cell, and warehouse examples, see our approach to digital signage for manufacturing.


