


So you finally got Microsoft Power BI up and running for your team. The trouble is, you’re not sure how best to share your dashboards or reports with the people who need it — and all the stress is really throwing off your groove.
We have you covered with this comprehensive guide explaining everything you need to know about sharing Power BI data.
Looking to start sharing dashboards immediately? We also explain how you can use Fugo (for free) to display your reports in minutes inside a browser link (jump down to method 5.)
Now, let’s dive right into the meat and potatoes.
How To Share Power BI Reports: 5 Different Methods
Making data-driven decisions starts with data-driven collaboration. But if people on your team can’t access data effectively — including your Power BI reports — you can’t expect them to discover any detailed insights that drive your business forward.
Let’s look at the four different ways to share Power BI dashboards with your team, starting with the simplest method:
Method 1: Collaborate Inside Power BI
You know the old saying ‘if it ain’t broke, don’t fix it?’ That’s basically the philosophy of collaboration in Power BI. Rather than looking to alternative sources to share your data, you can use native tools on your user dashboard to share reports at a glance.
Just keep in mind collaborating inside Power BI isn’t a perfect solution for every circumstance — and if you manage a big team, it could get expensive fast.
Here’s what you need to do:
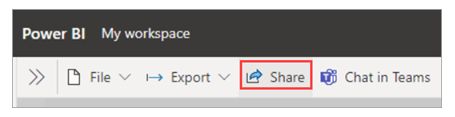
1. Log into your Power BI account and navigate to the top bar. If you have a Power BI Pro license, you should see a ‘share’ button like the one below.
2. Choose how you want to share your report. You can enter the recipients’ email address, change user permissions, or send report links manually. Just keep in mind only users with Power BI Pro licenses can access your reports.
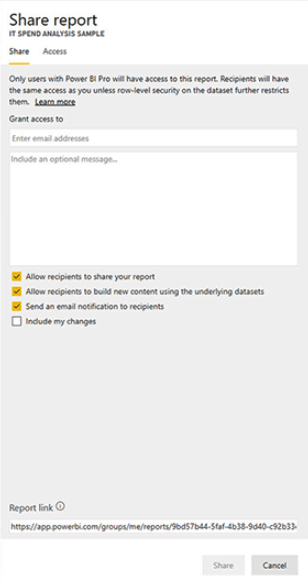
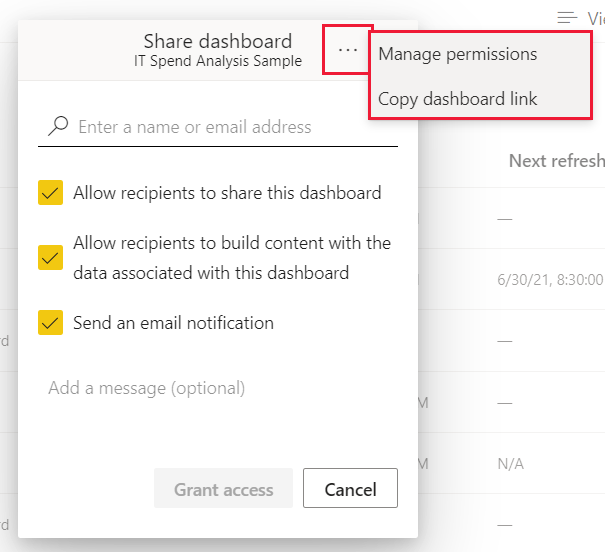
3. Change user permissions depending on what you want users to do with your data. You can allow recipients to share the dashboards with other users, or allow them to build additional content using the data attached to your report or dashboard.
Method Benefits
- You can keep sensitive data inside Power BI and reduce your risk for security breaches.
- Since everyone on your team is collaborating in the same place, you can create a one-stop shop to find all your company’s pertinent data.
- Company leaders can control access to data by assigning user authorization levels depending on specific needs.
Method Caveats
- You can't share reports from a Power BI Report Server, which could be annoying if that’s all you have to work with.
- You need a Power BI Pro license to share your dashboards and reports, and your team needs a Pro license to view them as well.
- If you don’t want to purchase licenses for everyone on your team, you have to put your content in a Premium workspace — a process that could get expensive fast.
- You can’t have more than 1,000 sharing links per report. If you need to send more links than that, you need to look for a Power BI sharing alternative.
Method 2: Integrate With A Third-Party Tool
Why reinvent the wheel when you can just use one that works? Third-party tools are a great way to share Power BI dashboards and reports without having to purchase extra licenses or navigate confusing interfaces.
If you’re already using a platform like Microsoft Teams, for example, you can easily send dashboards and reports to the right people at the right time. If you don’t already have a Microsoft Teams subscription, you may want to consider a simpler method (such as sharing data on TV dashboards, perhaps).
Regardless, here’s what you need to know:
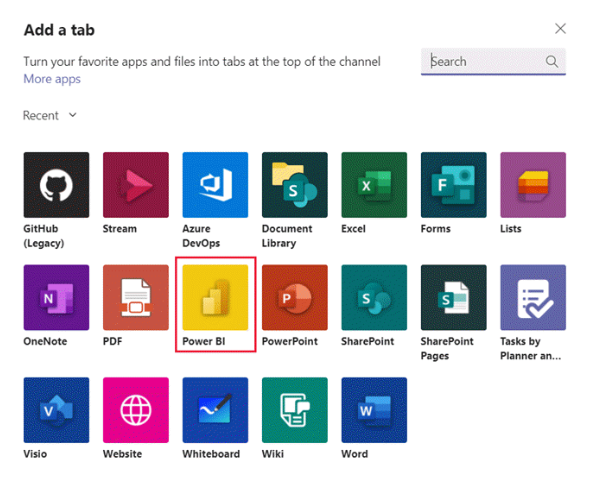
1. Start by logging into your Microsoft Teams account and pressing the ‘+’ button at the top of the screen.

2. Select the Power BI tab from other options and add it to the top of your channel.
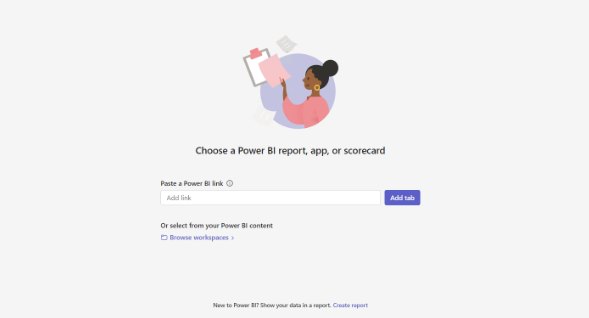
3. You’ll see a screen like the one below. Select ‘Save.’
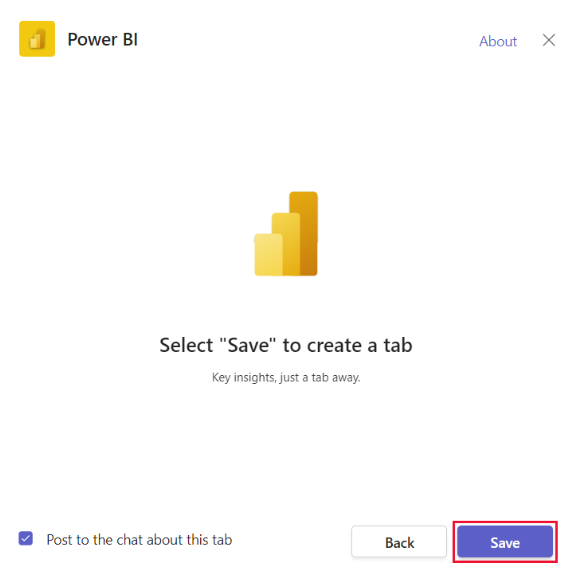
4. Paste a link to the Power BI report, app, or scorecard you want to share.
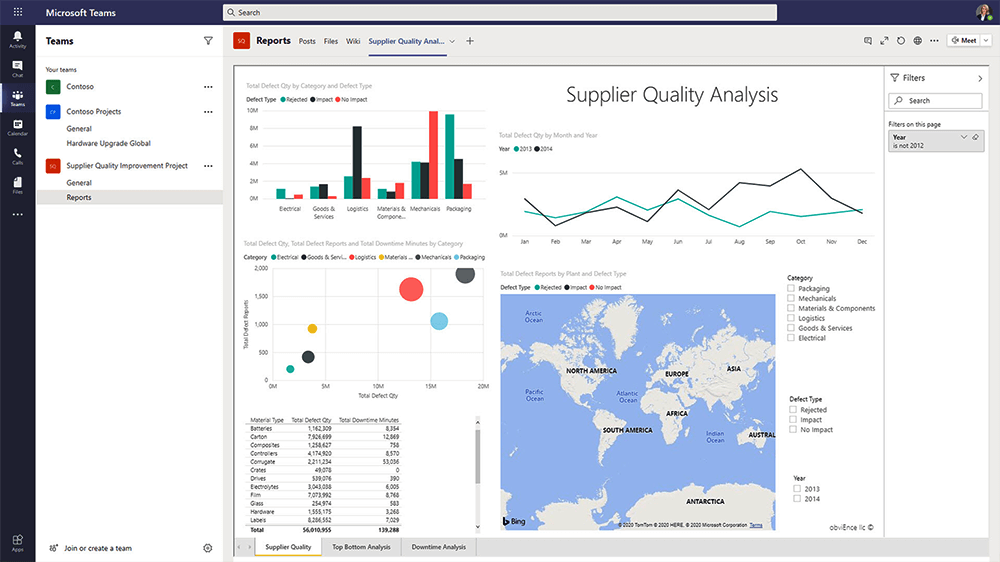
5. Now your report, app, or scorecard should show up in Microsoft Teams looking something like this:
Method Benefits
- If you already use Microsoft Teams, you can use this method to easily share access to reports without too much fuss.
- Everyone on your team can rely on a single source of truth for all their Power BI reports.
- Team members can start conversations around specific data and instantly comment on shared media.
Method Caveats
- If you don’t already have a Microsoft Teams subscription, this method probably isn’t worth it for you.
- Even if you do share reports and dashboards through Microsoft Teams, keep in mind your team members still need proper licensing to view or build with data.
- You can’t embed any Power BI dashboards in Microsoft Team’s Power BI tab. You can only share reports, apps, and scorecards — which can be frustrating if you’re trying to find a more effective workaround for dashboards.
- This method doesn’t require you to send links or fool around with emails, but you won’t be able to bookmark reports to navigate back to the data quickly. In other words, you still have to manually log in and click around until you find the report.
Method 3: Publish A Power BI App
So you don’t want to share reports directly with your team, and you don’t have a Microsoft Teams account to use. If you’re willing to get your hands dirty with some technical wizardry, you can get around these limitations by publishing an app.
The good news? You can send multiple reports and dashboards to specific users.
The bad news? It’s pretty involved.
Here’s everything you need to know about sharing Power BI dashboards and reports through an organizational app:
1. Before you even think about publishing an app, you need to create a shared workspace in Power BI to store reports and dashboards. Under the ‘Workspaces’ tab, select ‘Create Workspace.’
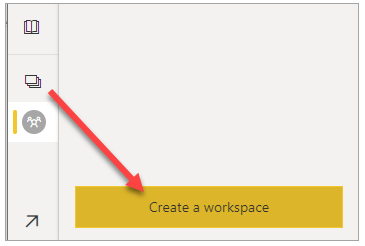
2. Once you name and customize your workspace, select ‘Save.’
3. Update the content in your workspace to reflect what you want in the final published app. Go ahead and add all the data you like — you have nothing to lose!
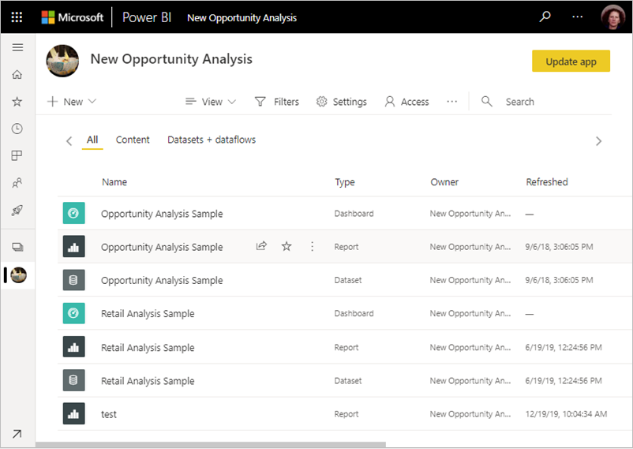
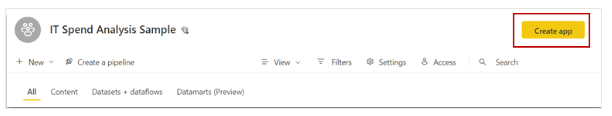
4. Now you can take the data you added and publish an app accordingly. First, in your workspace view list, click the button that says ‘Create App.’
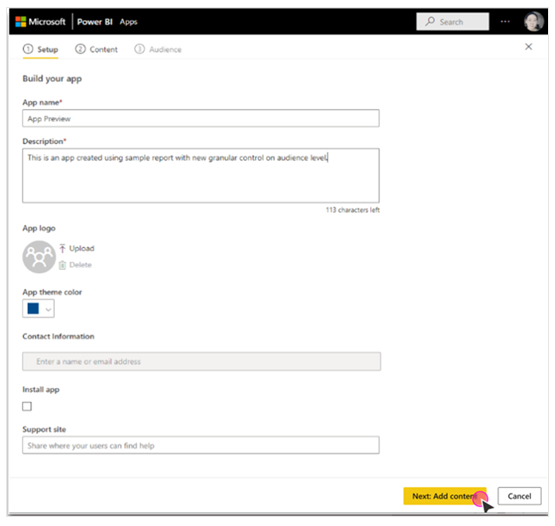
5. Fill out the necessary information to build your app. You need to provide a name and description at minimum, but you’re welcome to have fun with a logo, theme color, and additional support site.
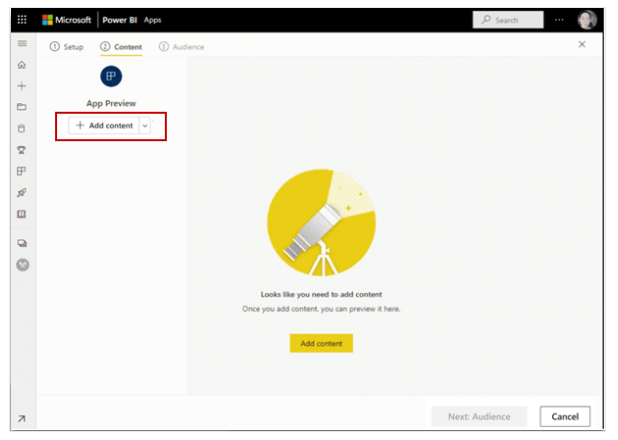
6. You can add more content to your app by clicking the ‘Add Content’ button.
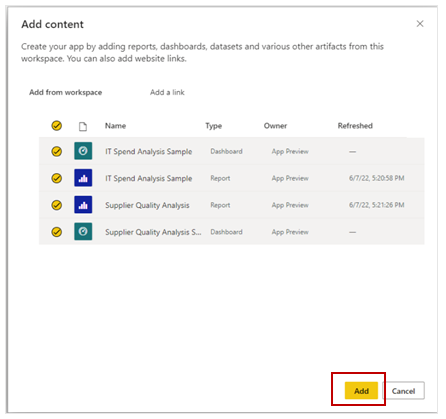
6. Apps by default include all data listed on the workspace, so be sure to customize your selection if need be.
7. Now you can create audiences with specific access to certain data. You can hide reports, dashboards, and even paginated reports from the demographics you specify. You can also adjust whether or not users can share data from your app depending on your preferences.
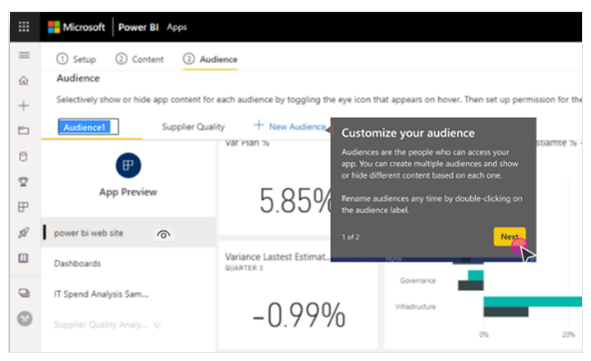
8. Once you’ve adjusted your audience’s access ability, click ‘Publish’ to make your app go live.

9. This takes you to the following screen, which provides a link to the now-published app.
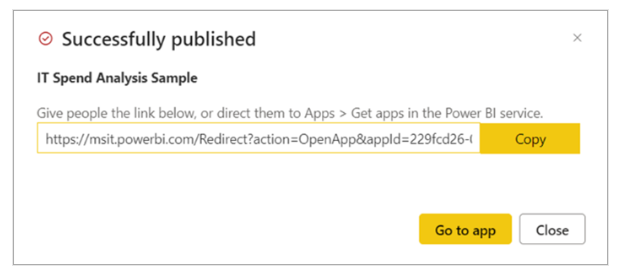
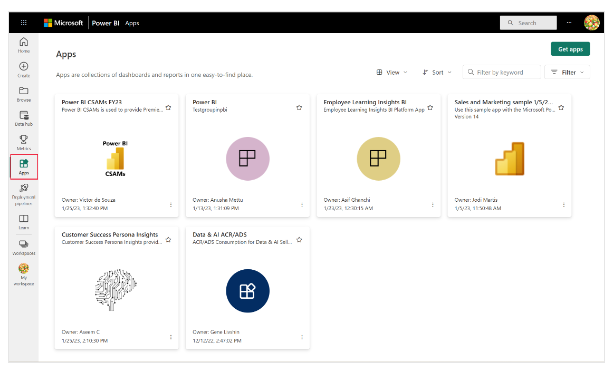
10. Now, users can only access the data you want them to see. Plus, they can slice and dice the numbers to their hearts’ content! Just don’t forget to have them install your organizational app to their phones or computers. You can find it listed under the ‘Organizational Apps’ tab in your dashboard.
Method Benefits
- Team members can view detailed business insights directly from their phones or computers.
- You can set limits on what specific audiences can see so you’re not overwhelming team members or showing the wrong data to the wrong people.
- You can also create template apps for other people to use, making it easier to distribute data in the future.
Method Caveats
- Both you and your team members need a Power BI Pro license to view apps. Otherwise, you need to store your published app in a Power BI Premium capacity — all of which costs serious cash.
- Not everyone wants to download an app to review your business data. It’s hard enough as it is to keep a solid boundary between personal and professional lives, so adoption may be low.
- Users need their own devices to view Power BI insights. If they don’t download the app to their mobile phone, laptop, or desktop, they can’t access the data provided.
Method 4: Display Power BI On TV Screens
Sharing Power BI dashboards via the methods desribed above can be complex and confusing, not to mention rather expensive. So what if there was a better way to share reports with your team — one that didn’t require tons of user licenses or complex technical know-how?
Enter TV screens.
It’s medium that everyone in your organization is already familiar with, but perhaps haven’t considered as a channel for sharing company data & other internal communications.
Their impact can be great when you use TV screens in tandem with a smart content management system to share your Power BI data to the right people, in the right place, at the right time - without sacrificing security.

There are two ways to use Fugo with your workplace TVs to get your Power BI dashboards & reports out to the troops:
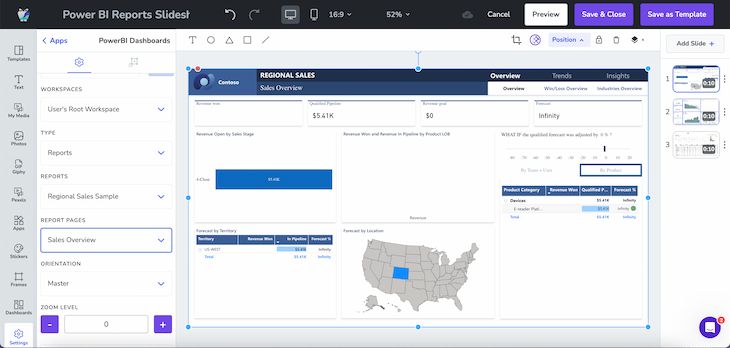
Fugo’s Power BI Integration
Fugo natively integrates with the Power BI platform for a simple and secure method of adding live reports or dashboards to static displays or rotating slide shows. You can think of it like having a Powerpoint or Google slide that updates with live data every time it appears in the slideshow rotation.
Fugo’s TV Dashboards Solution
Fugo’s Dashboards solution is clever bit of engineering that allows you to share data from almost any application - like Power BI - to TV screens, with zero licensing & security issues. In short, the feature authenticates with Power BI to take screenshots of your data and send them to TV screens at set intervals (every 10 minutes, every hour, etc…) This is a way to easily publish data on screens without overburdening your “dumb” TV with memory-eating dashboards.
Check out how it works:
A quick run through of the TV Dashboards feature in action
Both options for sharing Power BI on screens are available within the Fugo platform, free to test for 14 days. If you’ve already got a TV screen and/or media player laying around the office, you’re already set up with everything you need to see if this method is right for your team!
If you don’t have that extra hardware handy in the office already, you can still make use of the Fugo platform within your internet browsers and intranets. Jump down to Method 5 below to learn how!
Method Benefits
- As opposed to email, instant messages, and texts that usually only get acknowledged once and forgotten, screens can loop and amplify your data for much more effective uptake and information recall.
- TV screens can surface information in an ambient way that doesn’t disrupt workers.
- For workers who don’t sit at desks or have company devices or email addresses, TV dashboards are a great way to get data and KPIs in front of them every day.
- You won’t need to purchase any extra user seats or upgrade your Power BI plan in order to find the most effective way to scale your data sharing.
- Team members can view detailed business insights right there at their work station.
- You can easily set up who see’s what on which screens so you’re not overwhelming team members or showing the wrong data to the wrong people.
Method Caveats
- You’ll need to have TV screens and/or an attachable media player in place to use this method, which may require an upfront spend on the necessary hardware components.
Method 5: Share Power BI Reports In An Embeddable Company Channel
So you like the idea of a method that doesn’t involve you purchasing user seats, upgrading your Power BI plan, orchestrating email flows, or sharing public URLs.
But you don’t have a TV.
You can reap the same benefits of Fugo’s Power BI solutions right in your internet browser or inside your company intranets!
You can think of Fugo Channels as a virtual TV screen you can watch in a browser tab or embed into websites.
How does this apply to sharing Power BI reports, you ask? Well, you can use Embeddable Channels to create a URL where you add all your dashboards or reports to a presentation in the same place. Instead of creating a single content stream, you can list multiple reports and dashboards in the same tab, then cycle them over and over again in the spaces your team uses most. You can share out the URL itself, or copy the embed code to paste it into another tool (like your website).
Embeddable Channels are how you can use Fugo without a TV screen!
Here’s how it works:
1. Sign up for a 14-day free trial of Fugo. Since we never take credit card information during your trial, you don’t need to worry about getting billed before you’re ready.
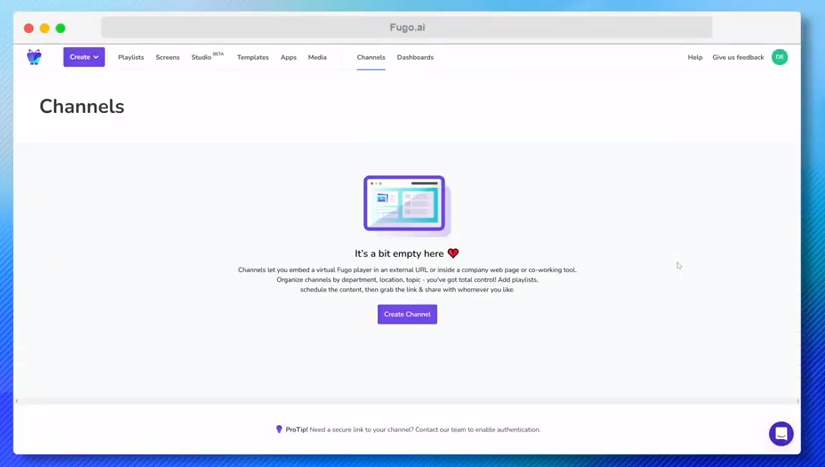
2. Now that you’re all signed up, you can start creating an Embeddable Channel. Just navigate to your Fugo dashboard and click ‘Create Channel.’
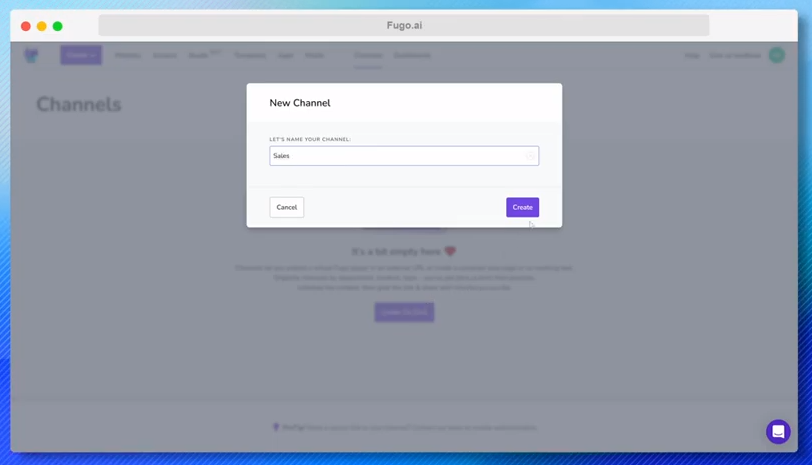
3. Give your new Channel a name that’s easy to remember — maybe something like Sales, for example. When you’re done, click ‘Create.’
4. Now if you look to the left, you can see a unique shortened link. This is the URL where all your Channel content lives. This is also the link your team members use to see your shared Power BI reports after publishing.
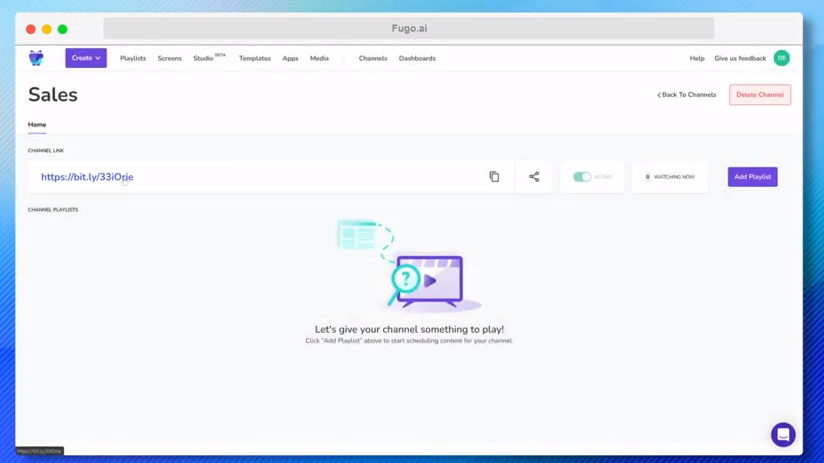
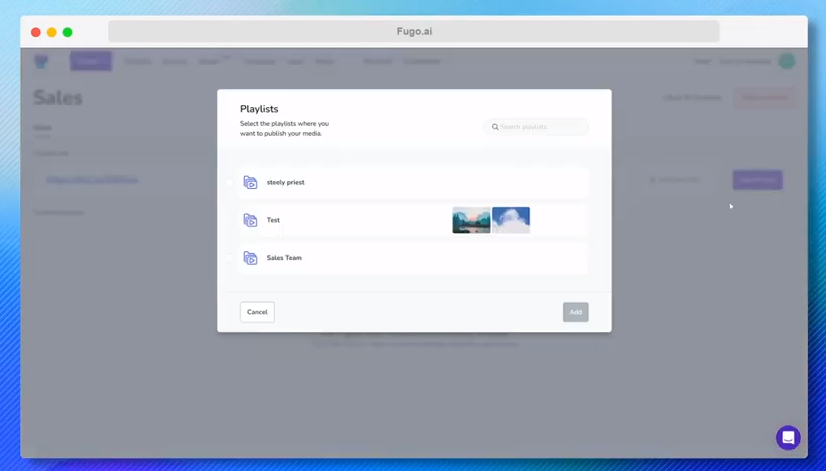
5. Let’s add some content to your Embeddable Channel. Click the ‘Add Playlist’ button on the right and select the content you want to add. If you haven’t done this before, no worries. We prompt you in-app to create your first set of content (and integrate with Power BI so you can send reports to your channel).
6. With Power BI dashboards and reports now added to your Embeddable Channel, you can share the Channel link with members of your team. You can either:
- Click the Copy button and distribute the link manually via text or another communication channel like Slack.
- Click the Share button to send the link via email, LinkedIn, Twitter, and Facebook.
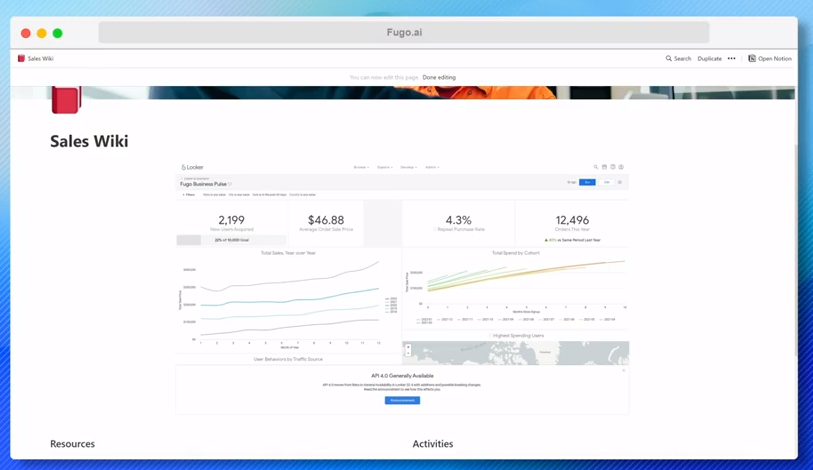
You can also see an embeddable code at the bottom of the popup. You can copy/paste this code on any website or collaboration channel that supports iframe players. Here’s what an Embeddable Channel looks like on a Notion board, for example:
Method Benefits
- No more expensive user licenses! Anyone in your organization can view reports and dashboards — regardless of their user status.
- Since you’re exhibiting data on a specific screen (or screens), you can easily display data in real-time without manually updating it yourself.
- You can customize your Fugo Embeddable Channels for in-office, hybrid, and distributed workforces. This means you can engage remote workers and frontline employees to make data-driven decisions wherever they happen to be.
- You don’t need to be a coding master to use Embeddable Channels for your content. We provide the code — you just copy/paste it to the right spot.
- We support interactive touch flows for touchscreen displays. This means your team can do more than just see the data; they can interact with it too!
Method Caveats
- If you do choose to create a URL to share your dashboards, you should know these can’t be considered 100% secure. Don’t send out links to people you don’t trust! Or contact Fugo to keep them password-protected.
Share Your Power BI Reports With A Little Help From Fugo
Power BI reports and dashboards are the lifeblood of growing brands. But without effective ways to share them at scale, they could hinder rather than help you succeed. One of the five methods above may help you bridge the gap, but only one allows you to save more money by avoiding extra user licenses — and that’s Fugo.
Fugo is a modernized solution for corporate digital signage, and one of the world’s most effective ways to display business data at scale. First, you can set up TV screens or an embeddable channel to display in business locations around the world. Then, you can customize the details with on-brand colors to personalize your internal content hub.
Check out how Nordward used Fugo to share their critical company data at scale
Best of all, Fugo comes with a 14-day free trial so you can test the features for yourself. All you need to do is connect your Power BI account to Fugo to start displaying business reports in minutes — no credit card required.
Why not get started today? Go ahead — our ‘free’ really means ‘free!’ Or book a demo to see how this might work inside your organization.
FAQ
- What are the easiest ways to share a Power BI dashboard with my team?
You can share Power BI dashboards using Microsoft Teams, SharePoint, direct links, email subscriptions, or digital signage solutions like Fugo depending on how and where your team consumes data. - Can I display a Power BI dashboard on a TV screen?
Yes, you can display Power BI dashboards on TV screens using tools like Fugo that support URL authentication and kiosk mode playback, making it ideal for office dashboards or retail signage. - Is there a way to share Power BI reports without giving edit access?
Absolutely. You can publish reports to the web with limited access or use Fugo's secure URL-sharing method to broadcast read-only versions of dashboards to screens. - How do I share Power BI dashboards in real time?
Real-time sharing can be achieved by embedding live dashboards in apps like Slack, Notion, or intranets - or using digital signage applications like Fugo to sync and auto-refresh dashboards displayed on internal or public-facing TV screens and monitors. - Do I need a Power BI Pro license to share dashboards?
Yes, to share dashboards with others outside your organization or give them access to interactive reports, both parties typically need a Power BI Pro license. - What’s the best way to share Power BI dashboards with non-technical stakeholders?
The best way is to display dashboards on screens in communal spaces using digital signage platforms like Fugo, which removes the friction of logins and training. - Can I control which report pages are shown on a shared dashboard?
Yes, when using Fugo or embedding tools, you can customize which tabs or pages are visible to the viewer. - What’s the difference between sharing dashboards via Microsoft Teams and Fugo?
Microsoft Teams is great for collaborative environments where users already use Teams, while Fugo is ideal for passive display on TVs and digital signage screens where engagement is visual and non-interactive.

