

Marketing dashboard displays
Put marketing dashboards from HubSpot, Google Analytics, and your other reporting tools on shared screens. Campaign performance stays visible to the whole team so people can react to results without everyone refreshing their own tabs.
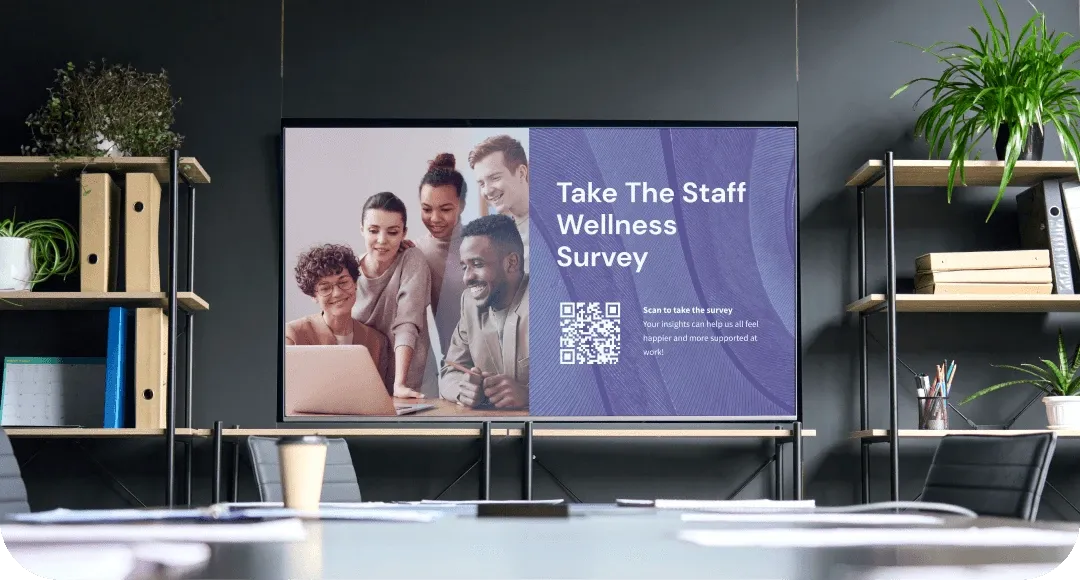
Why marketing teams put dashboards on screens
Keep campaign performance visible without opening HubSpot every hour
A screen on the wall shows current campaign numbers as they change. No one needs to log in, wait for a report to load, or remember to check. The data is just there.
Reduce "how's the campaign doing" questions from leadership
When executives can see campaign metrics on a screen in the hallway, they stop pinging the marketing team for updates. The numbers speak for themselves.
Celebrate launches and milestones where the whole team can see
Use screen takeovers to announce a product launch hitting its lead target or a campaign crossing a conversion milestone. Recognition happens in real time, not in a weekly standup.
Align content and demand gen teams around the same metrics
When both teams see the same funnel data on a shared screen, conversations shift from "what are your numbers" to "how do we move these numbers." Shared visibility drives shared ownership.
Surface attribution data for leadership without building a deck
Channel performance and attribution data on a visible screen replaces the monthly "where are our leads coming from" presentation. Leadership sees it daily instead of quarterly.
Support real-time monitoring during launch days and events
On launch day, put live campaign metrics on a big screen so the team can watch signups, traffic, and conversions roll in together. Spot issues early and celebrate wins as they happen.
What marketing teams show on screens
Marketing displays typically combine campaign metrics, lead data, and channel performance pulled from your existing analytics and CRM tools.
Campaign performance and conversion rates
Active campaign metrics, conversion funnels, and goal progress tracked in real time.
Lead generation and pipeline contribution
MQL and SQL counts, lead velocity, and marketing-sourced pipeline by channel.
Website traffic and content analytics
Page views, session data, top-performing content, and organic search trends.
Social media engagement metrics
Follower growth, engagement rates, and post performance across platforms.
Attribution and channel performance
Which channels drive leads and revenue, with cost-per-acquisition by source.
Launch countdowns and milestone tracking
Countdown timers for upcoming launches and live progress toward campaign goals.
Fugo features for marketing displays
Fugo connects to your marketing tools and puts live dashboards on any screen you control.
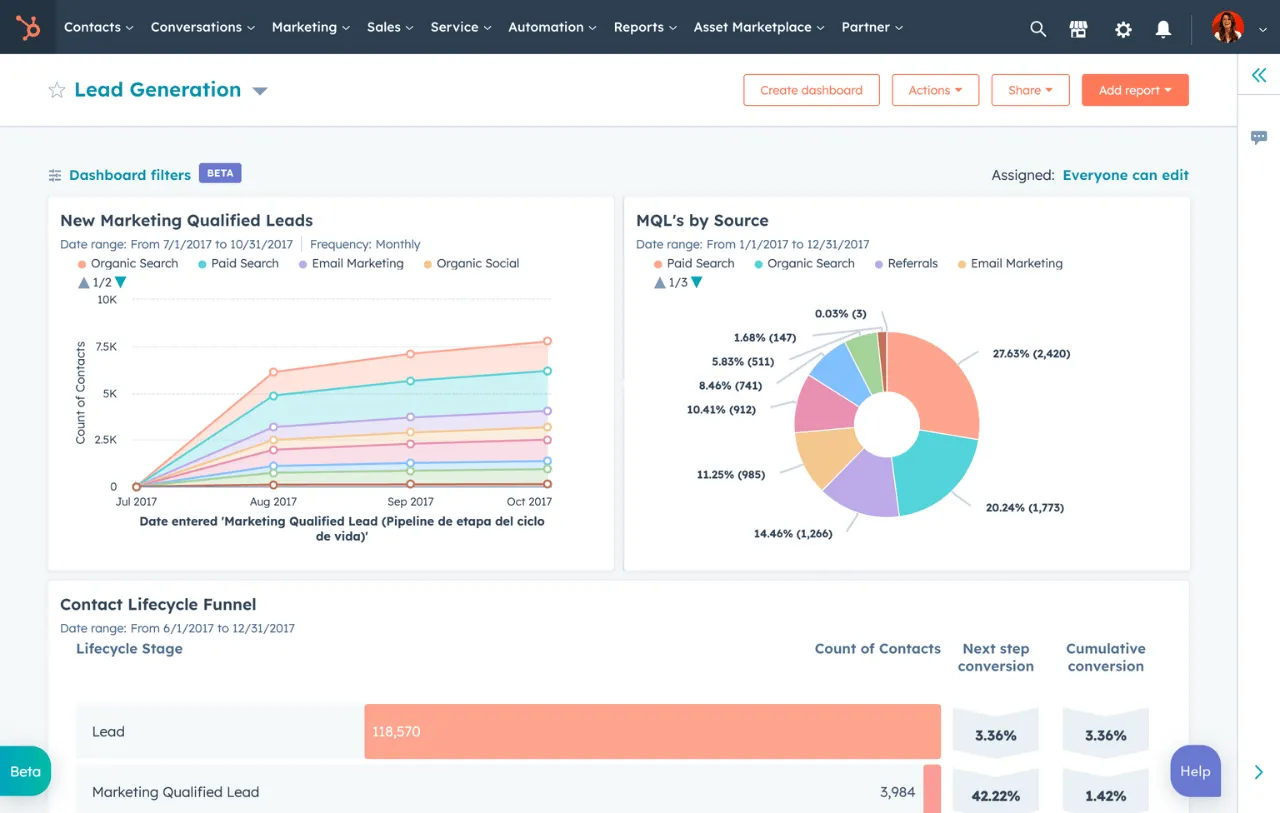
HubSpot dashboards
Display your HubSpot marketing dashboards, reports, and campaign analytics directly on a TV screen. The screen shows exactly what you see in HubSpot, updated automatically.
Explore HubSpot dashboards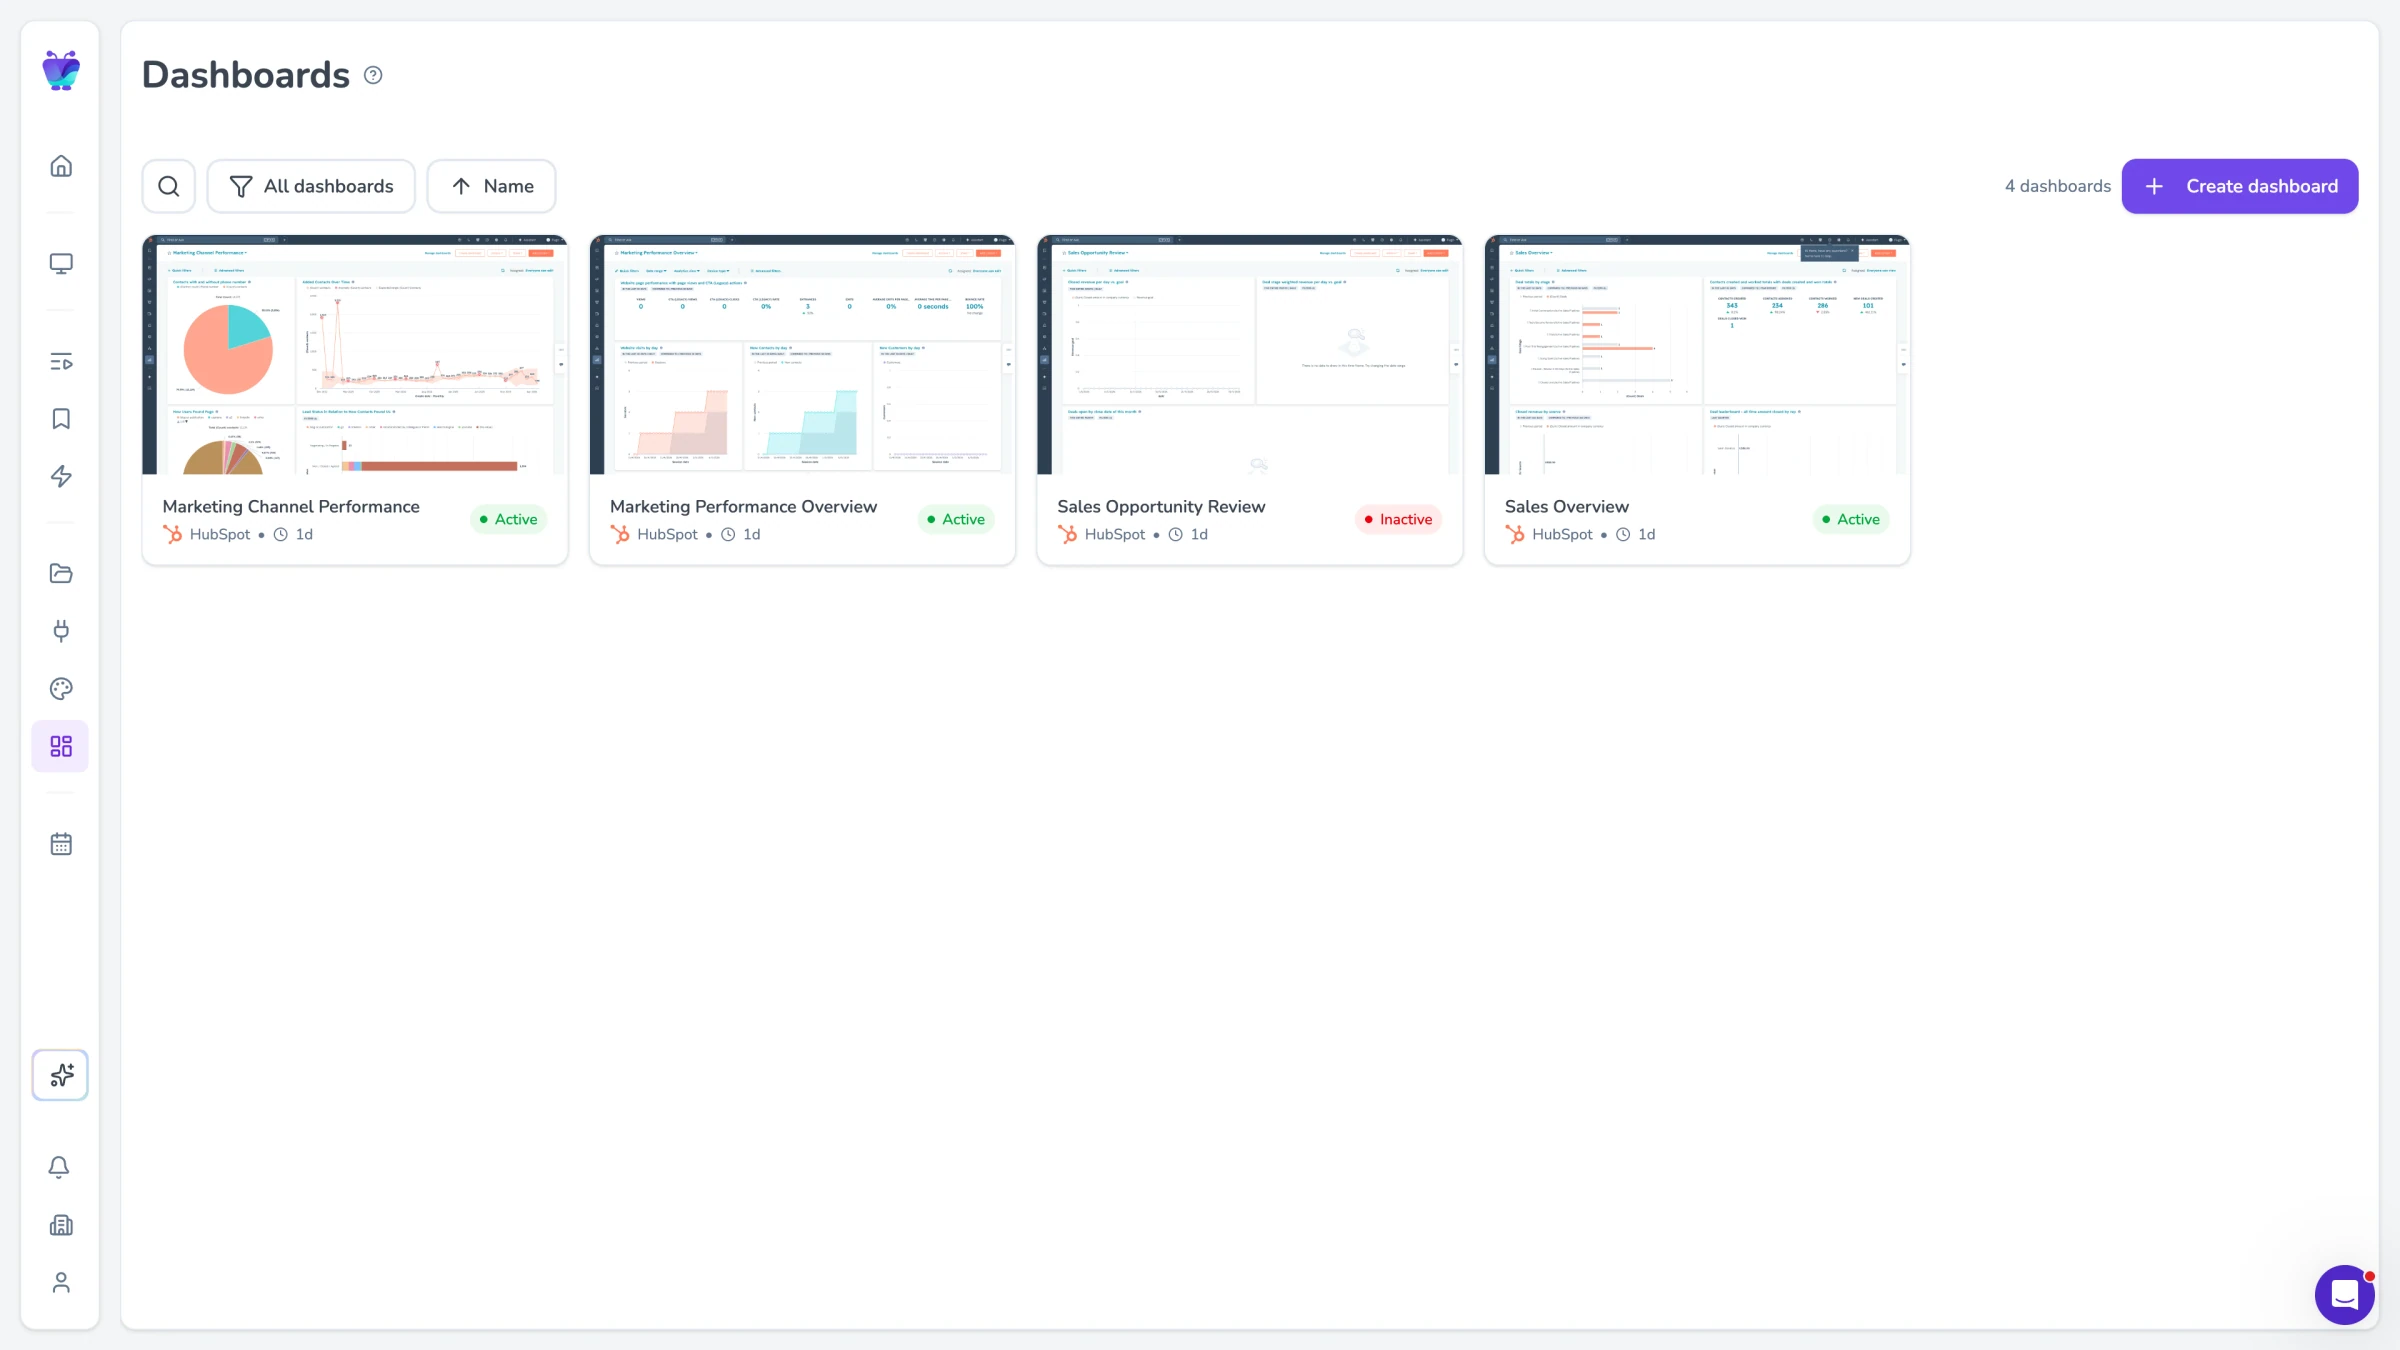
Dashboard integrations
Connect Google Analytics, Looker Studio, Tableau, Power BI, or any browser-based reporting tool. If it runs in a browser, Fugo can show it on a screen.
Explore TV dashboards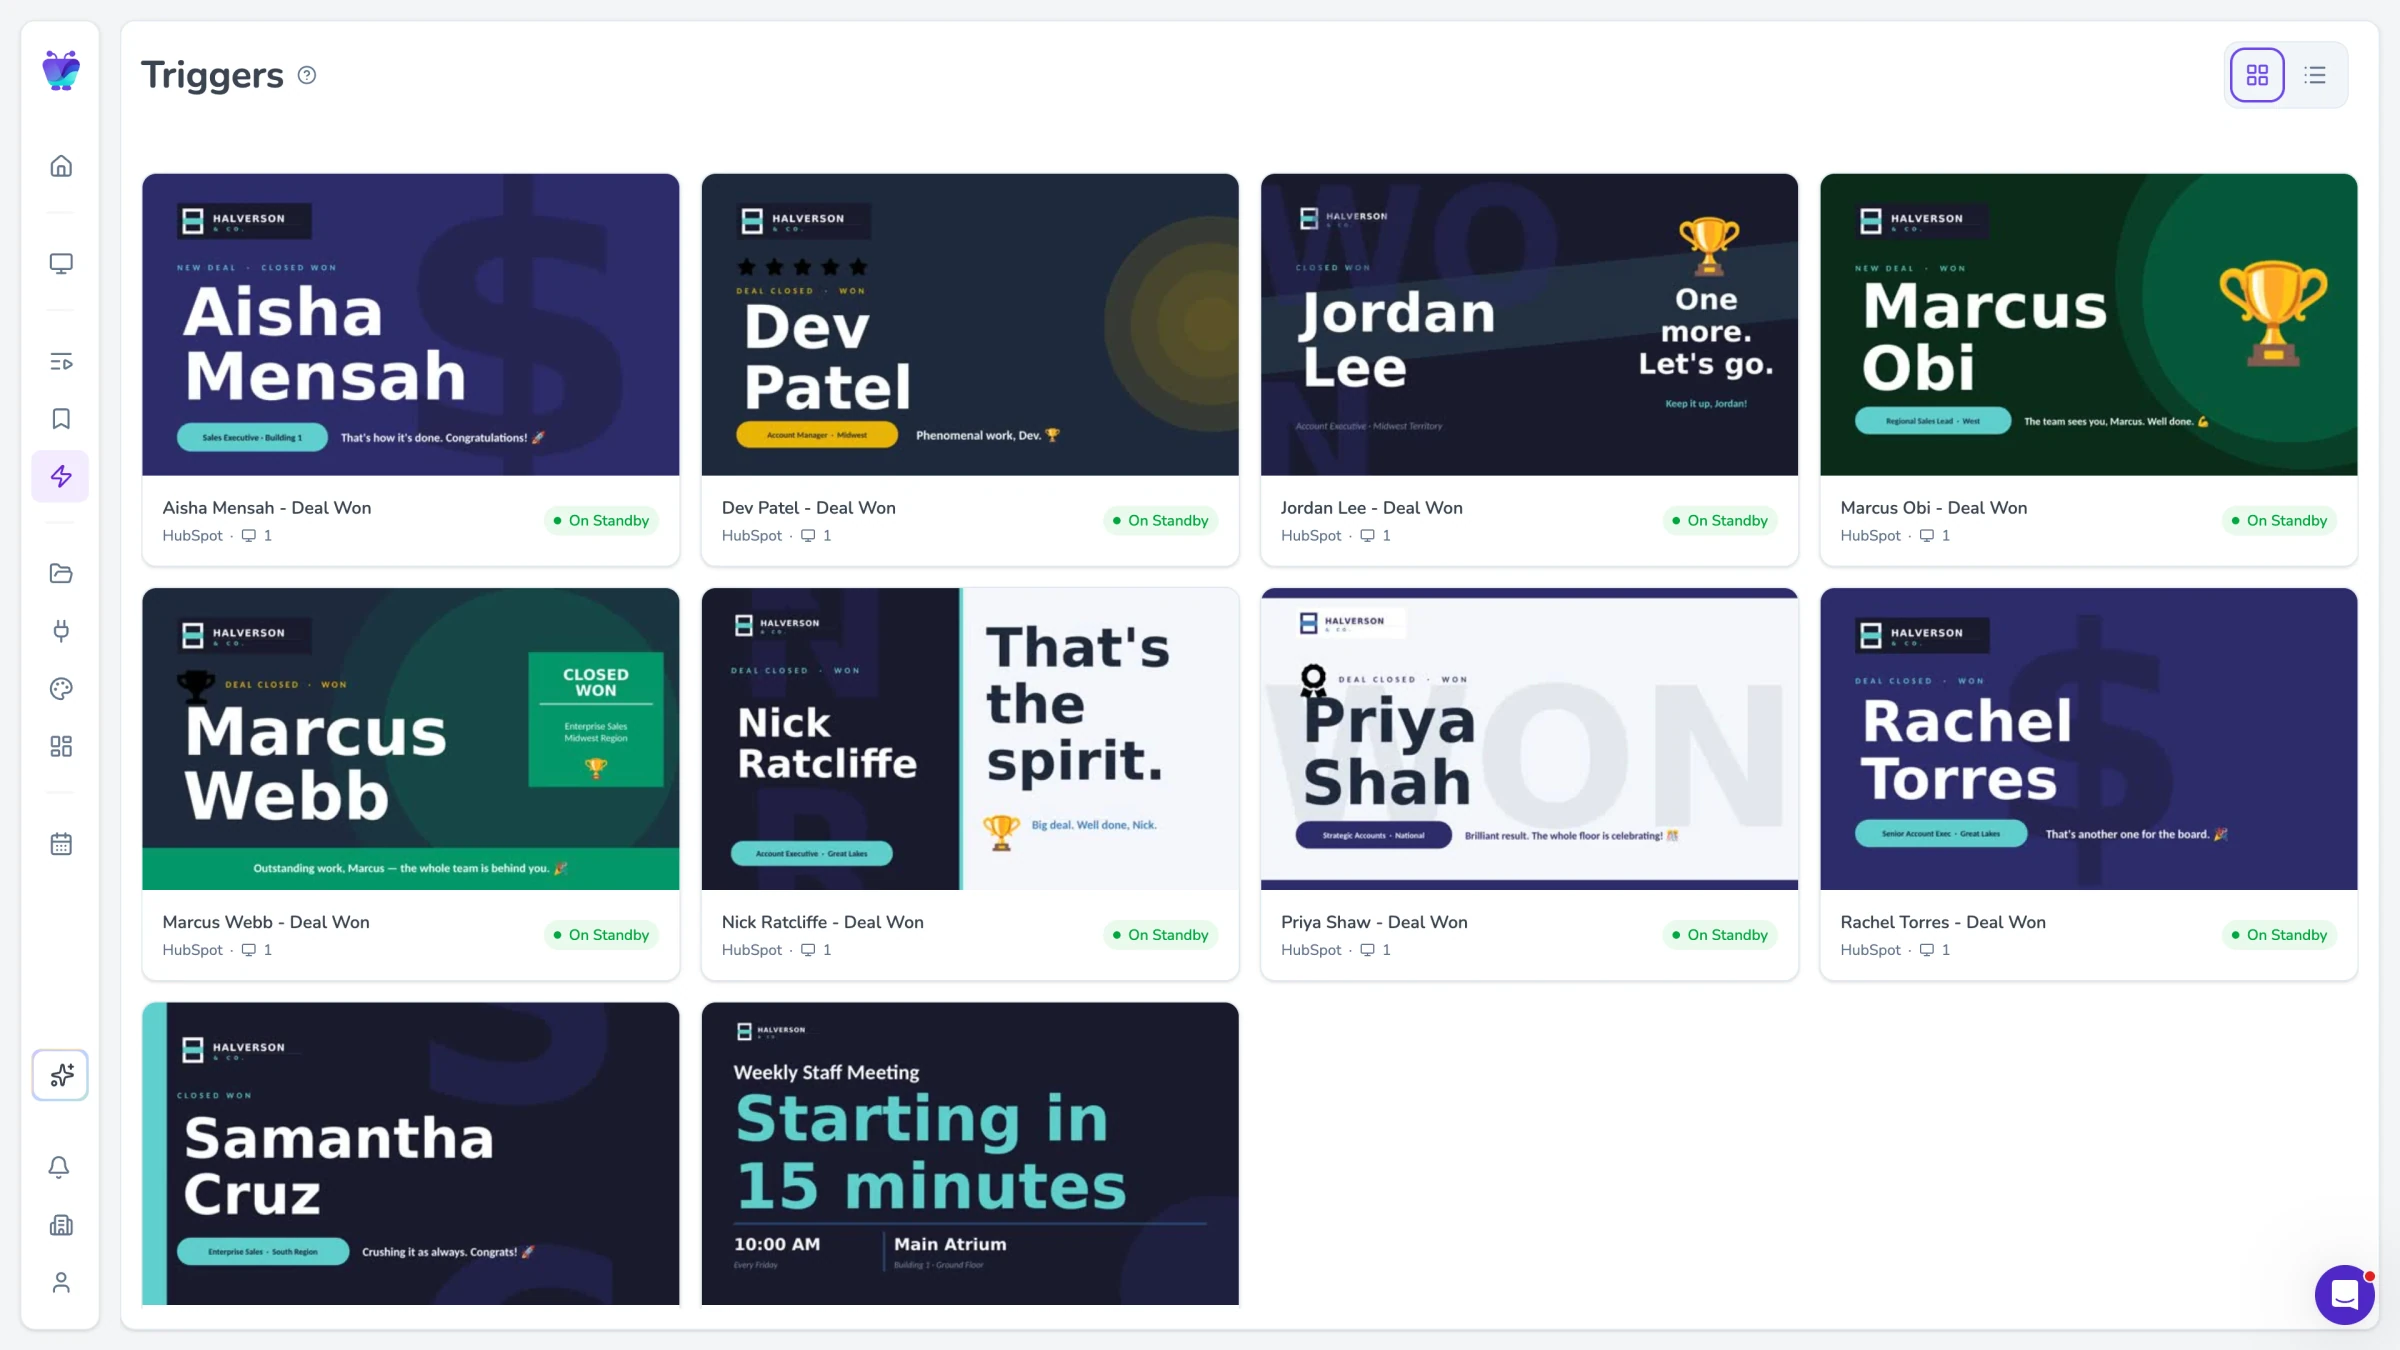
Content triggers
Set up rules that change what a screen shows based on data conditions. Hit your lead target and the screen switches to a celebration graphic. Miss a threshold and it highlights the gap.
See content triggers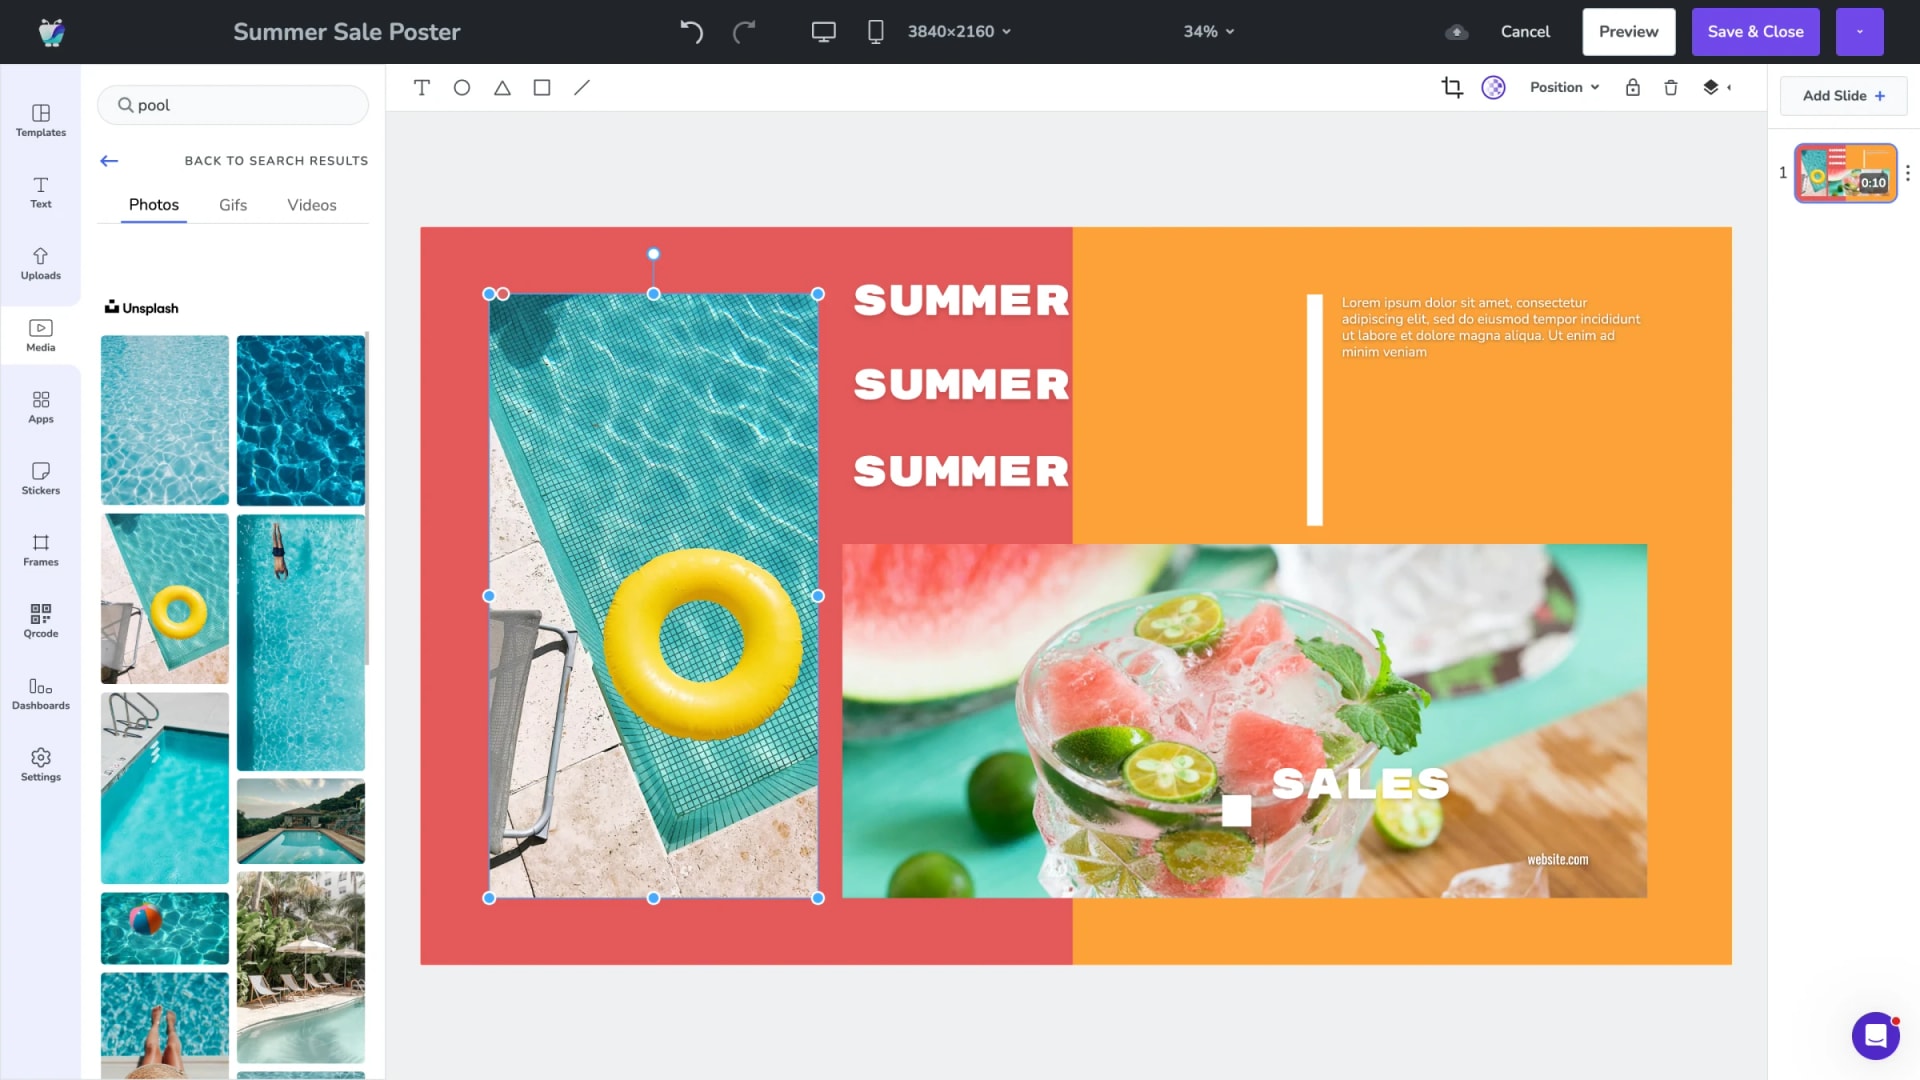
Design Studio
Combine multiple data sources on a single screen using the drag-and-drop editor. Place a HubSpot dashboard next to Google Analytics and a social media feed.
Explore Design Studio