
Display Grafana dashboards on TV screens
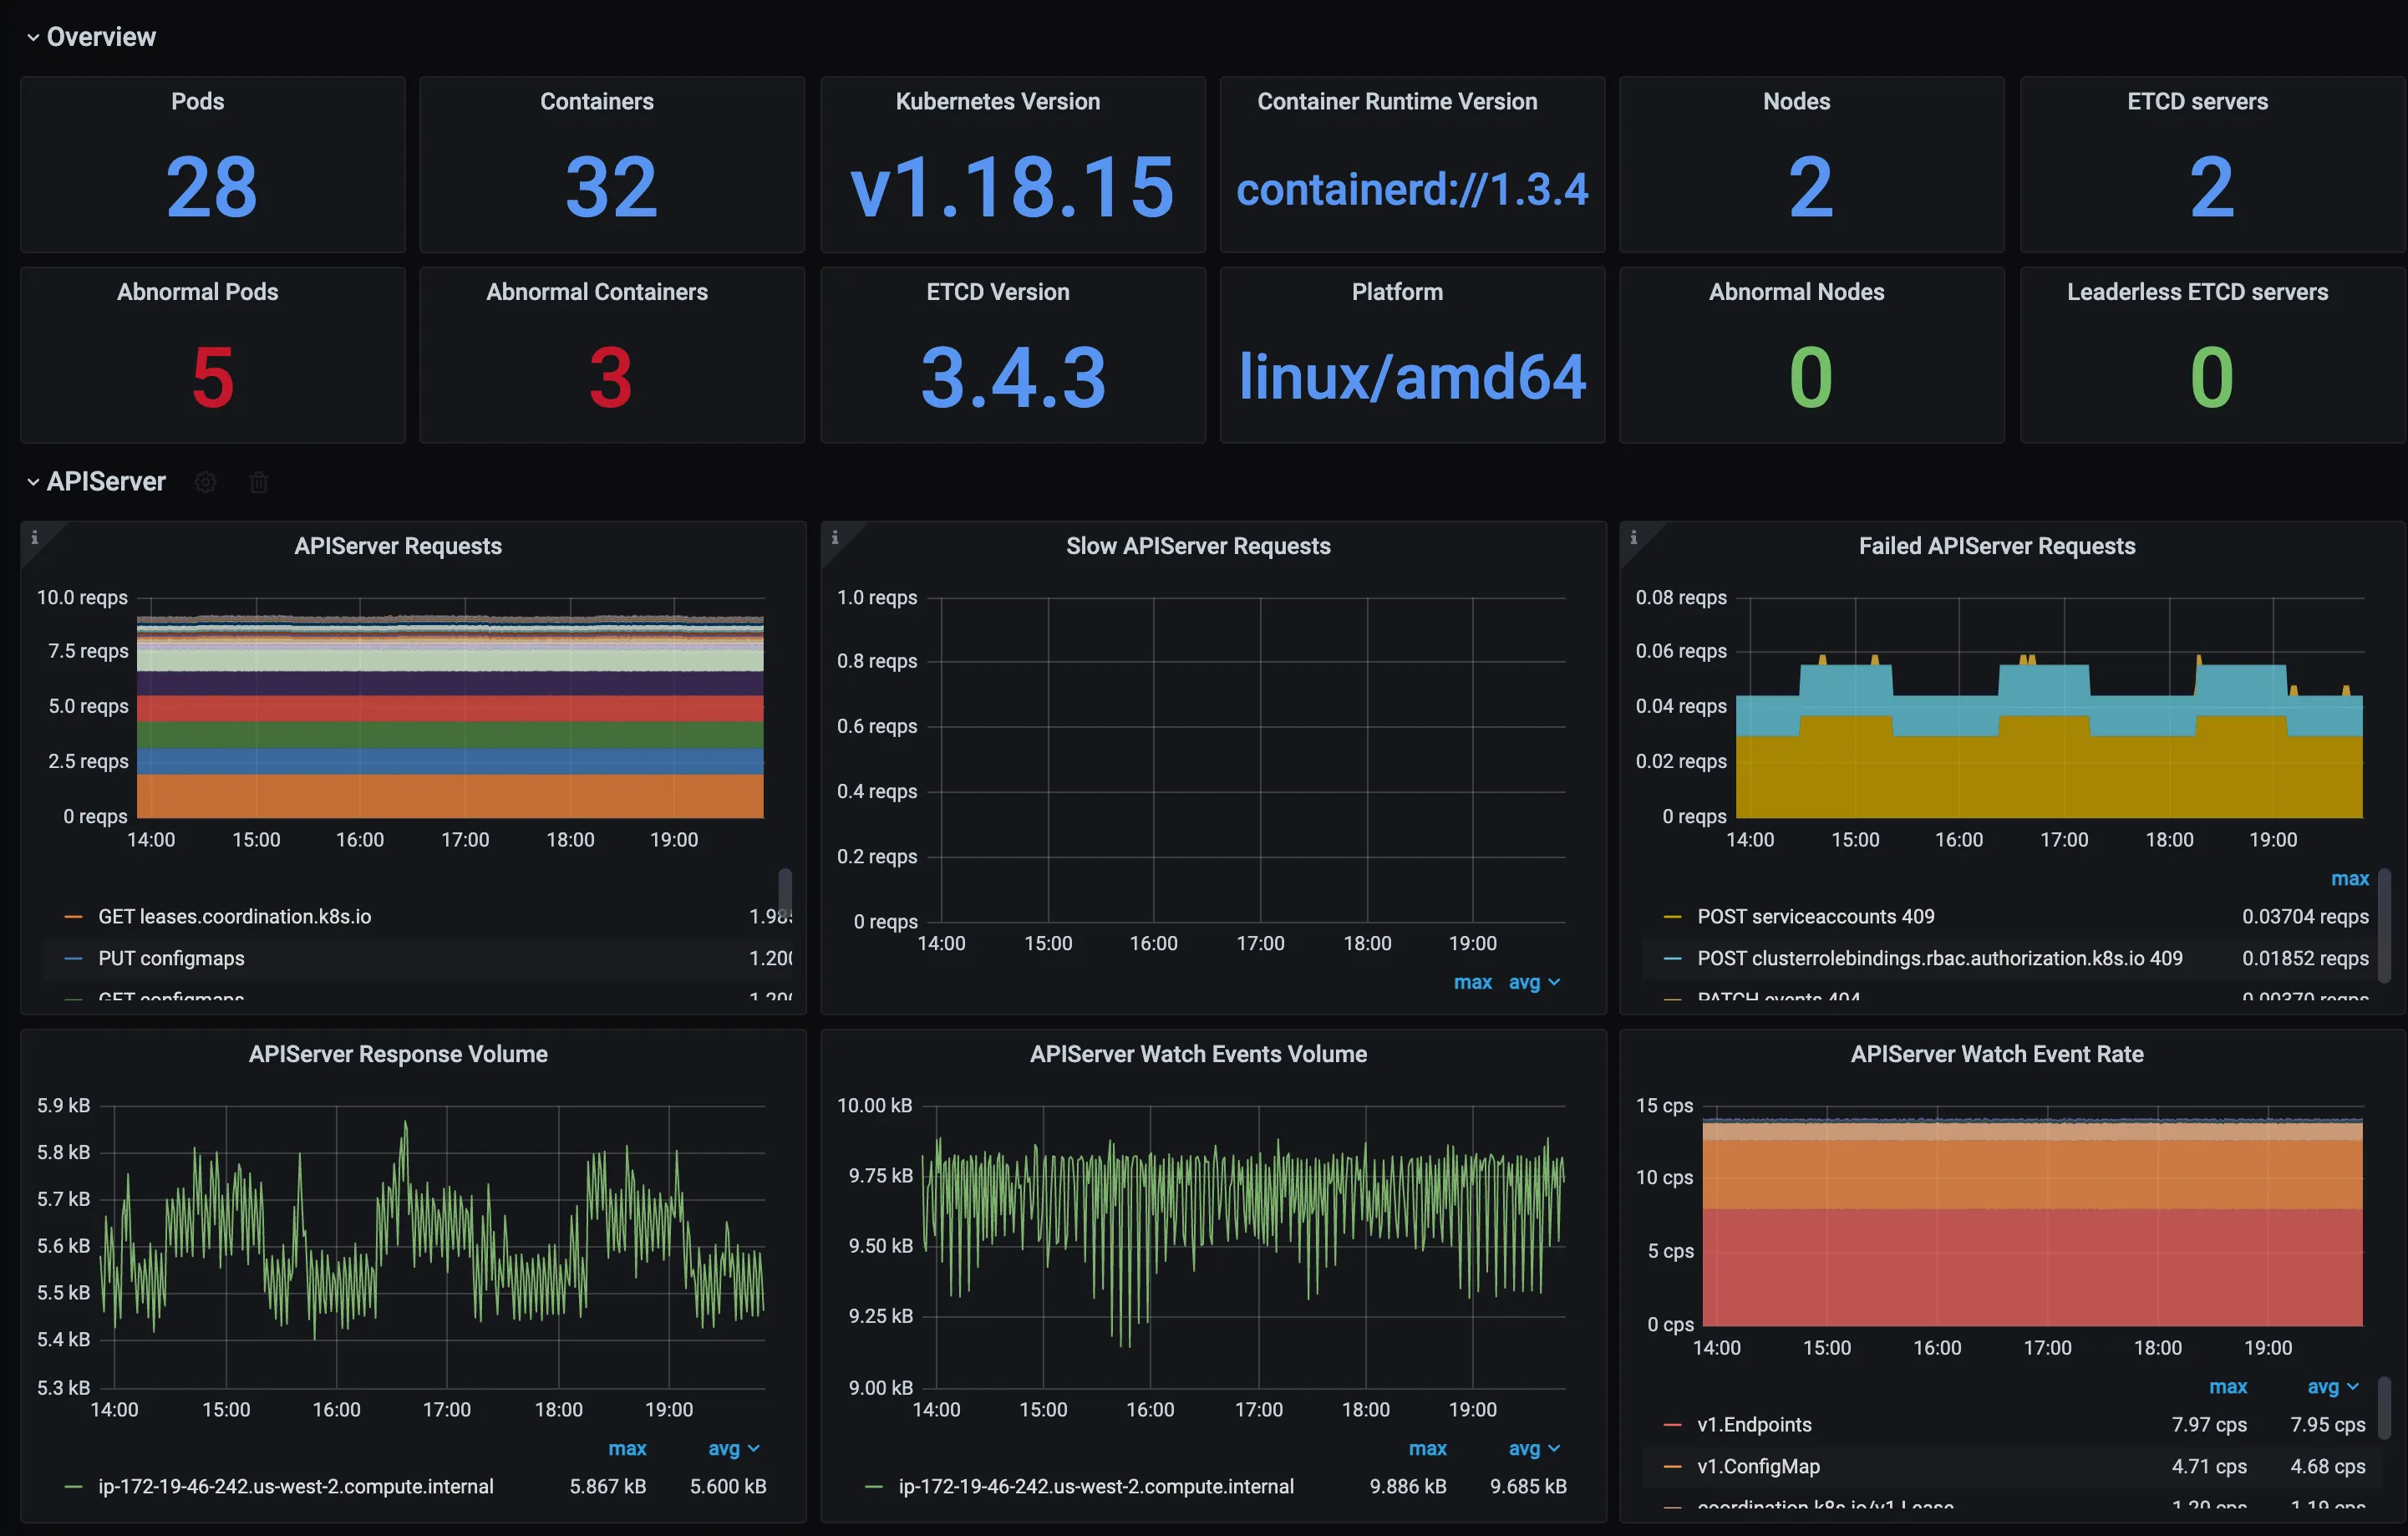
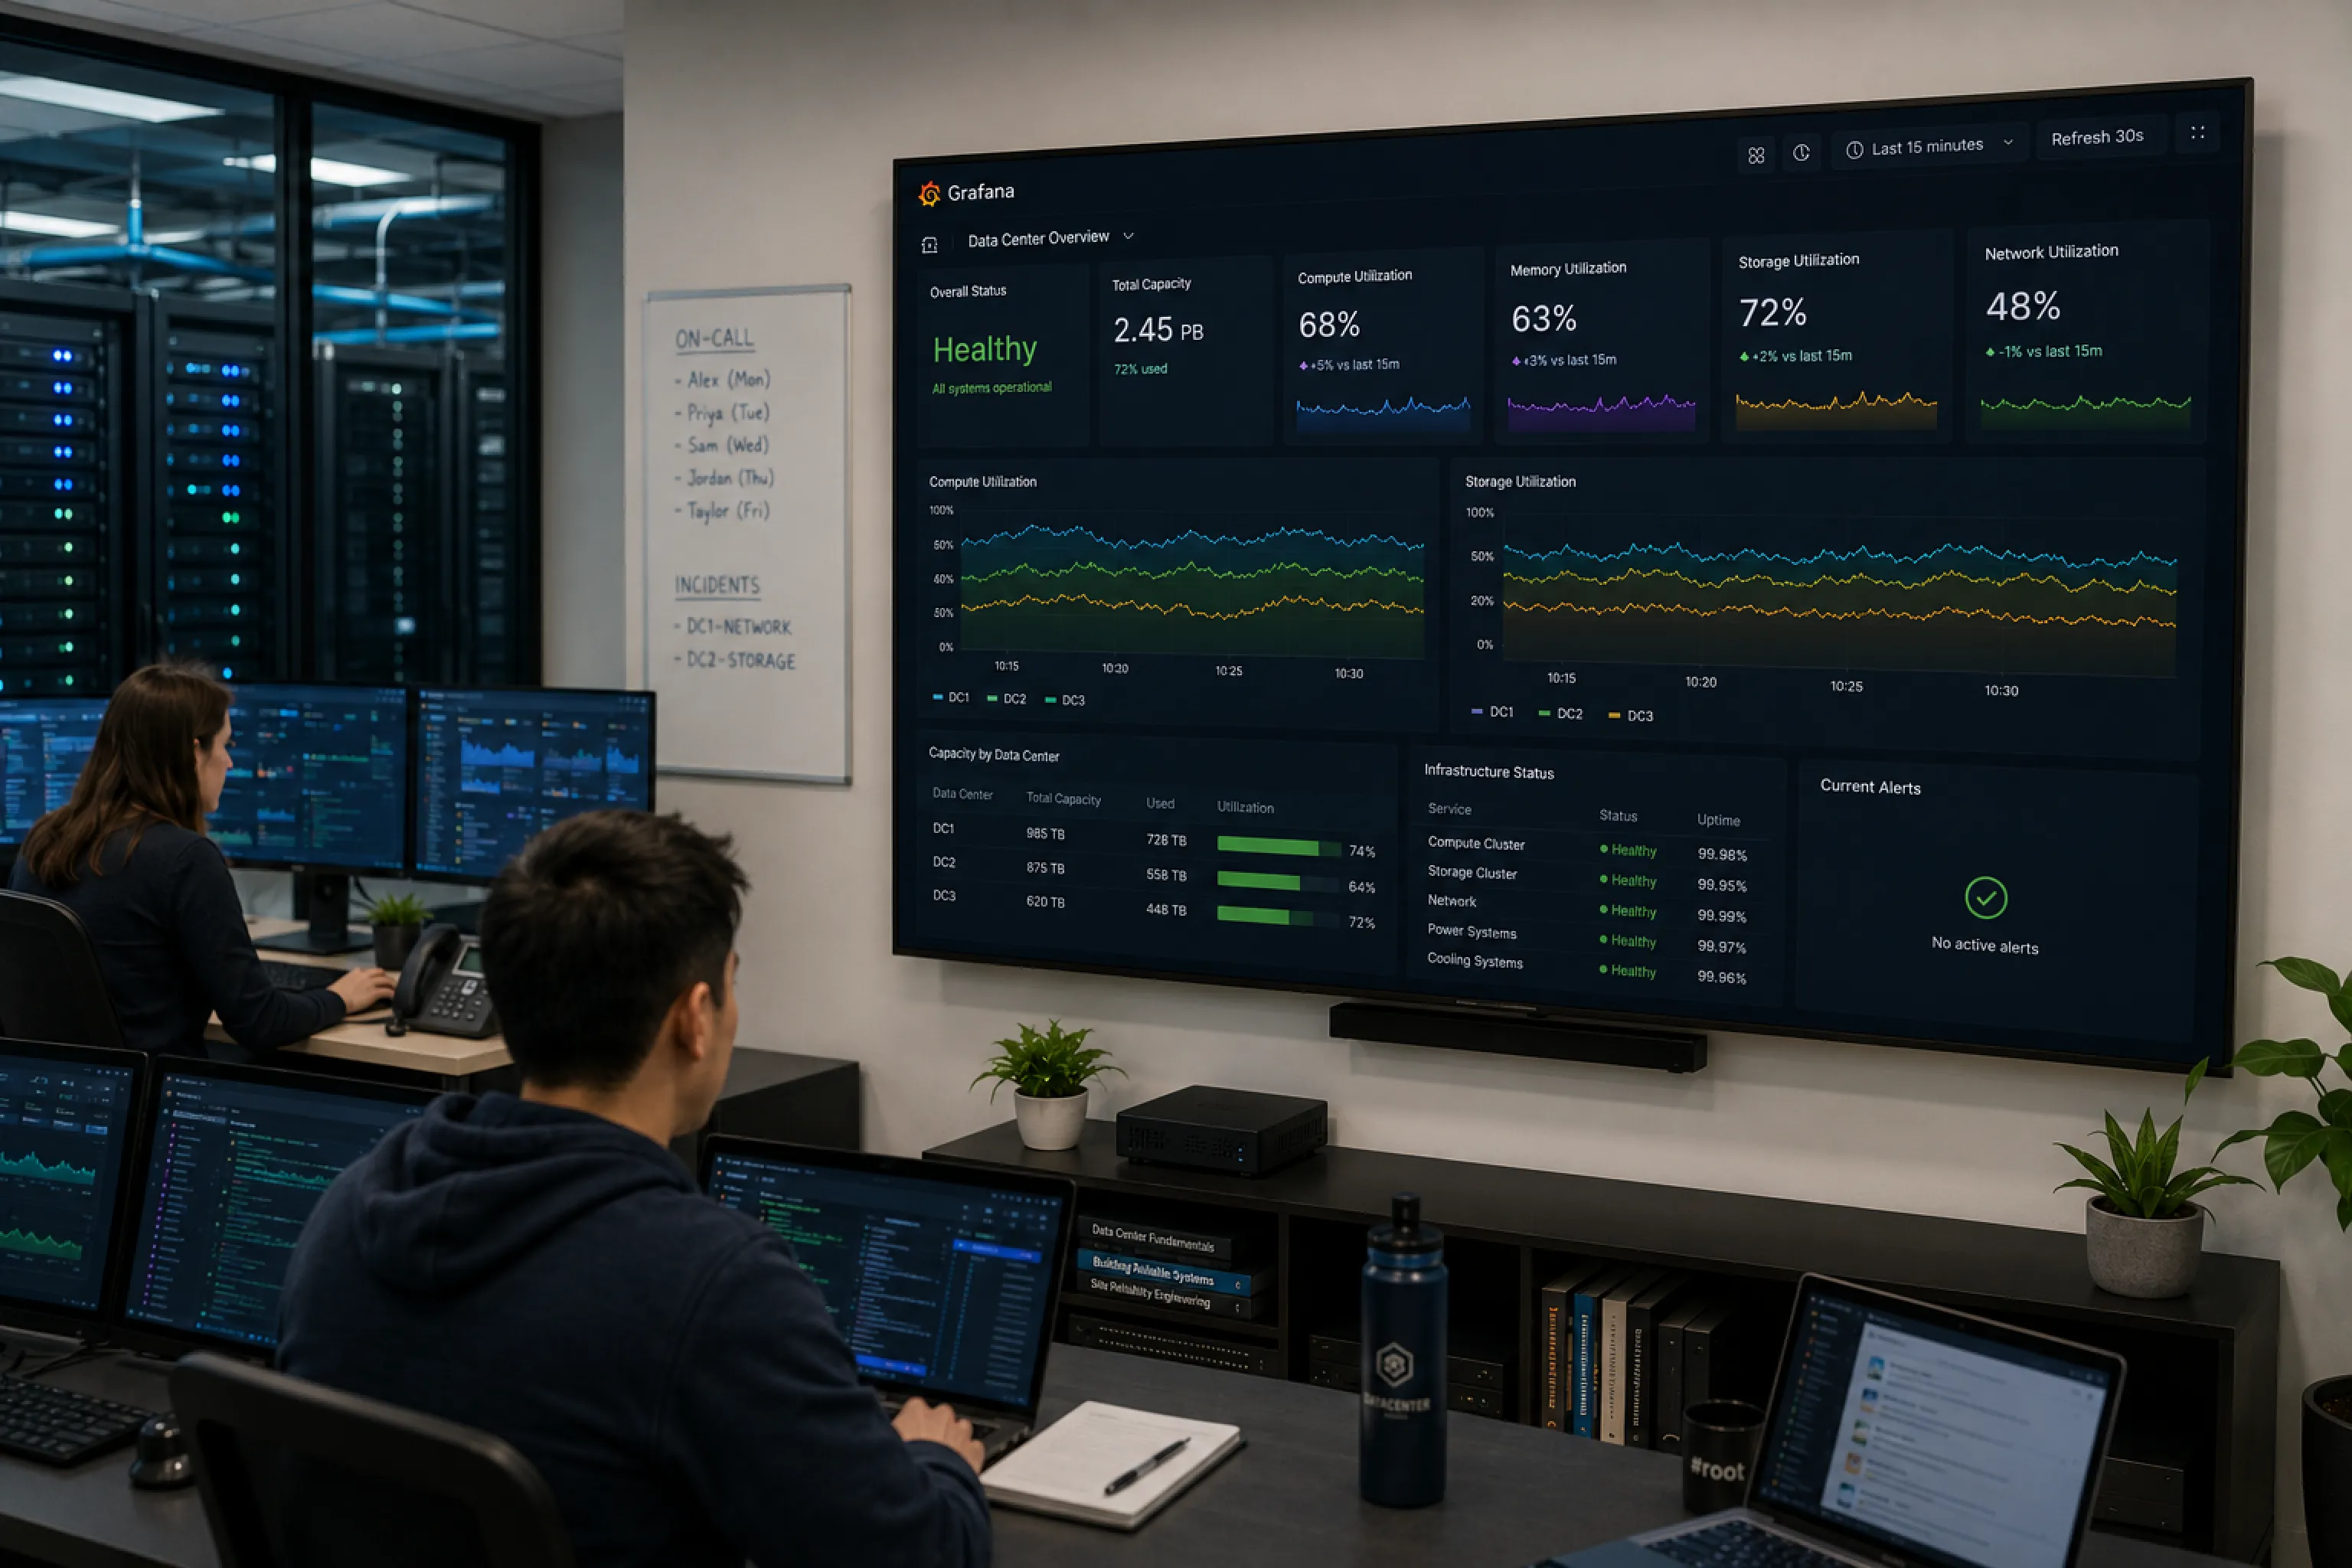
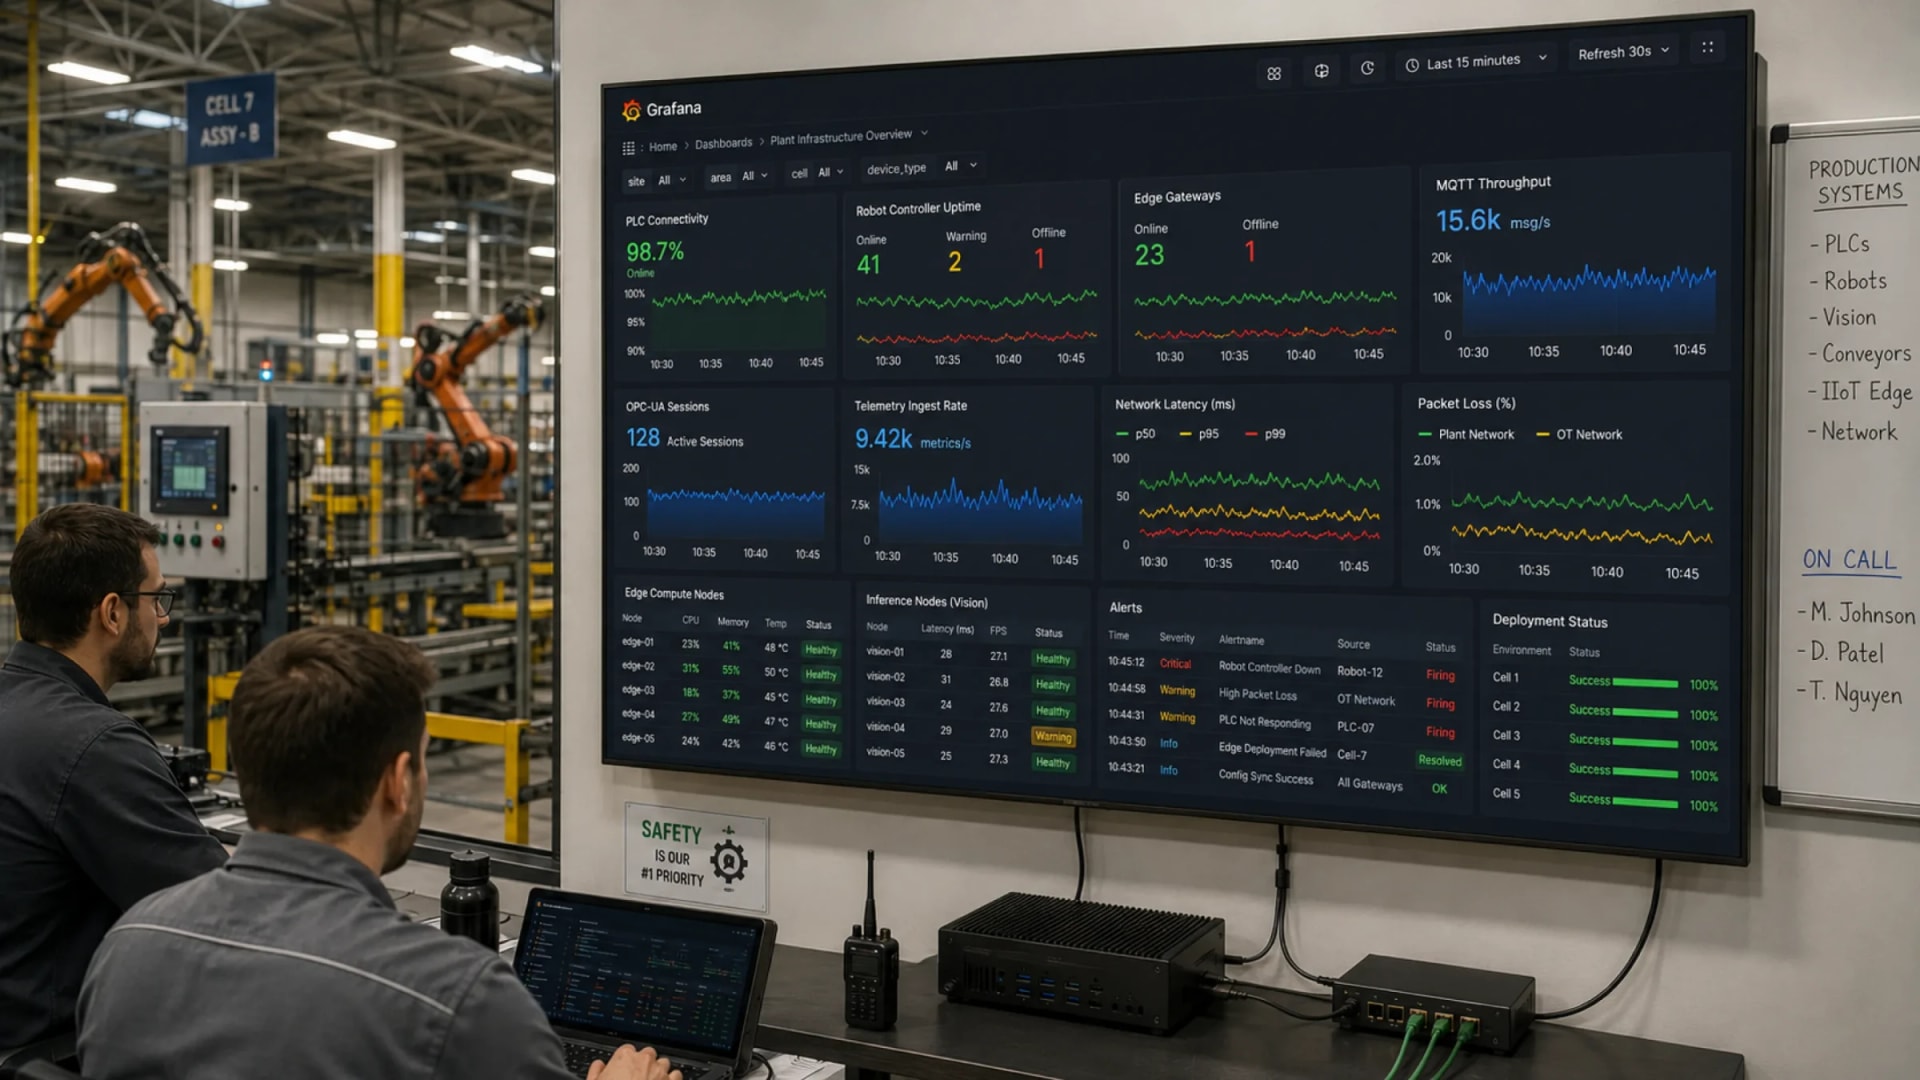
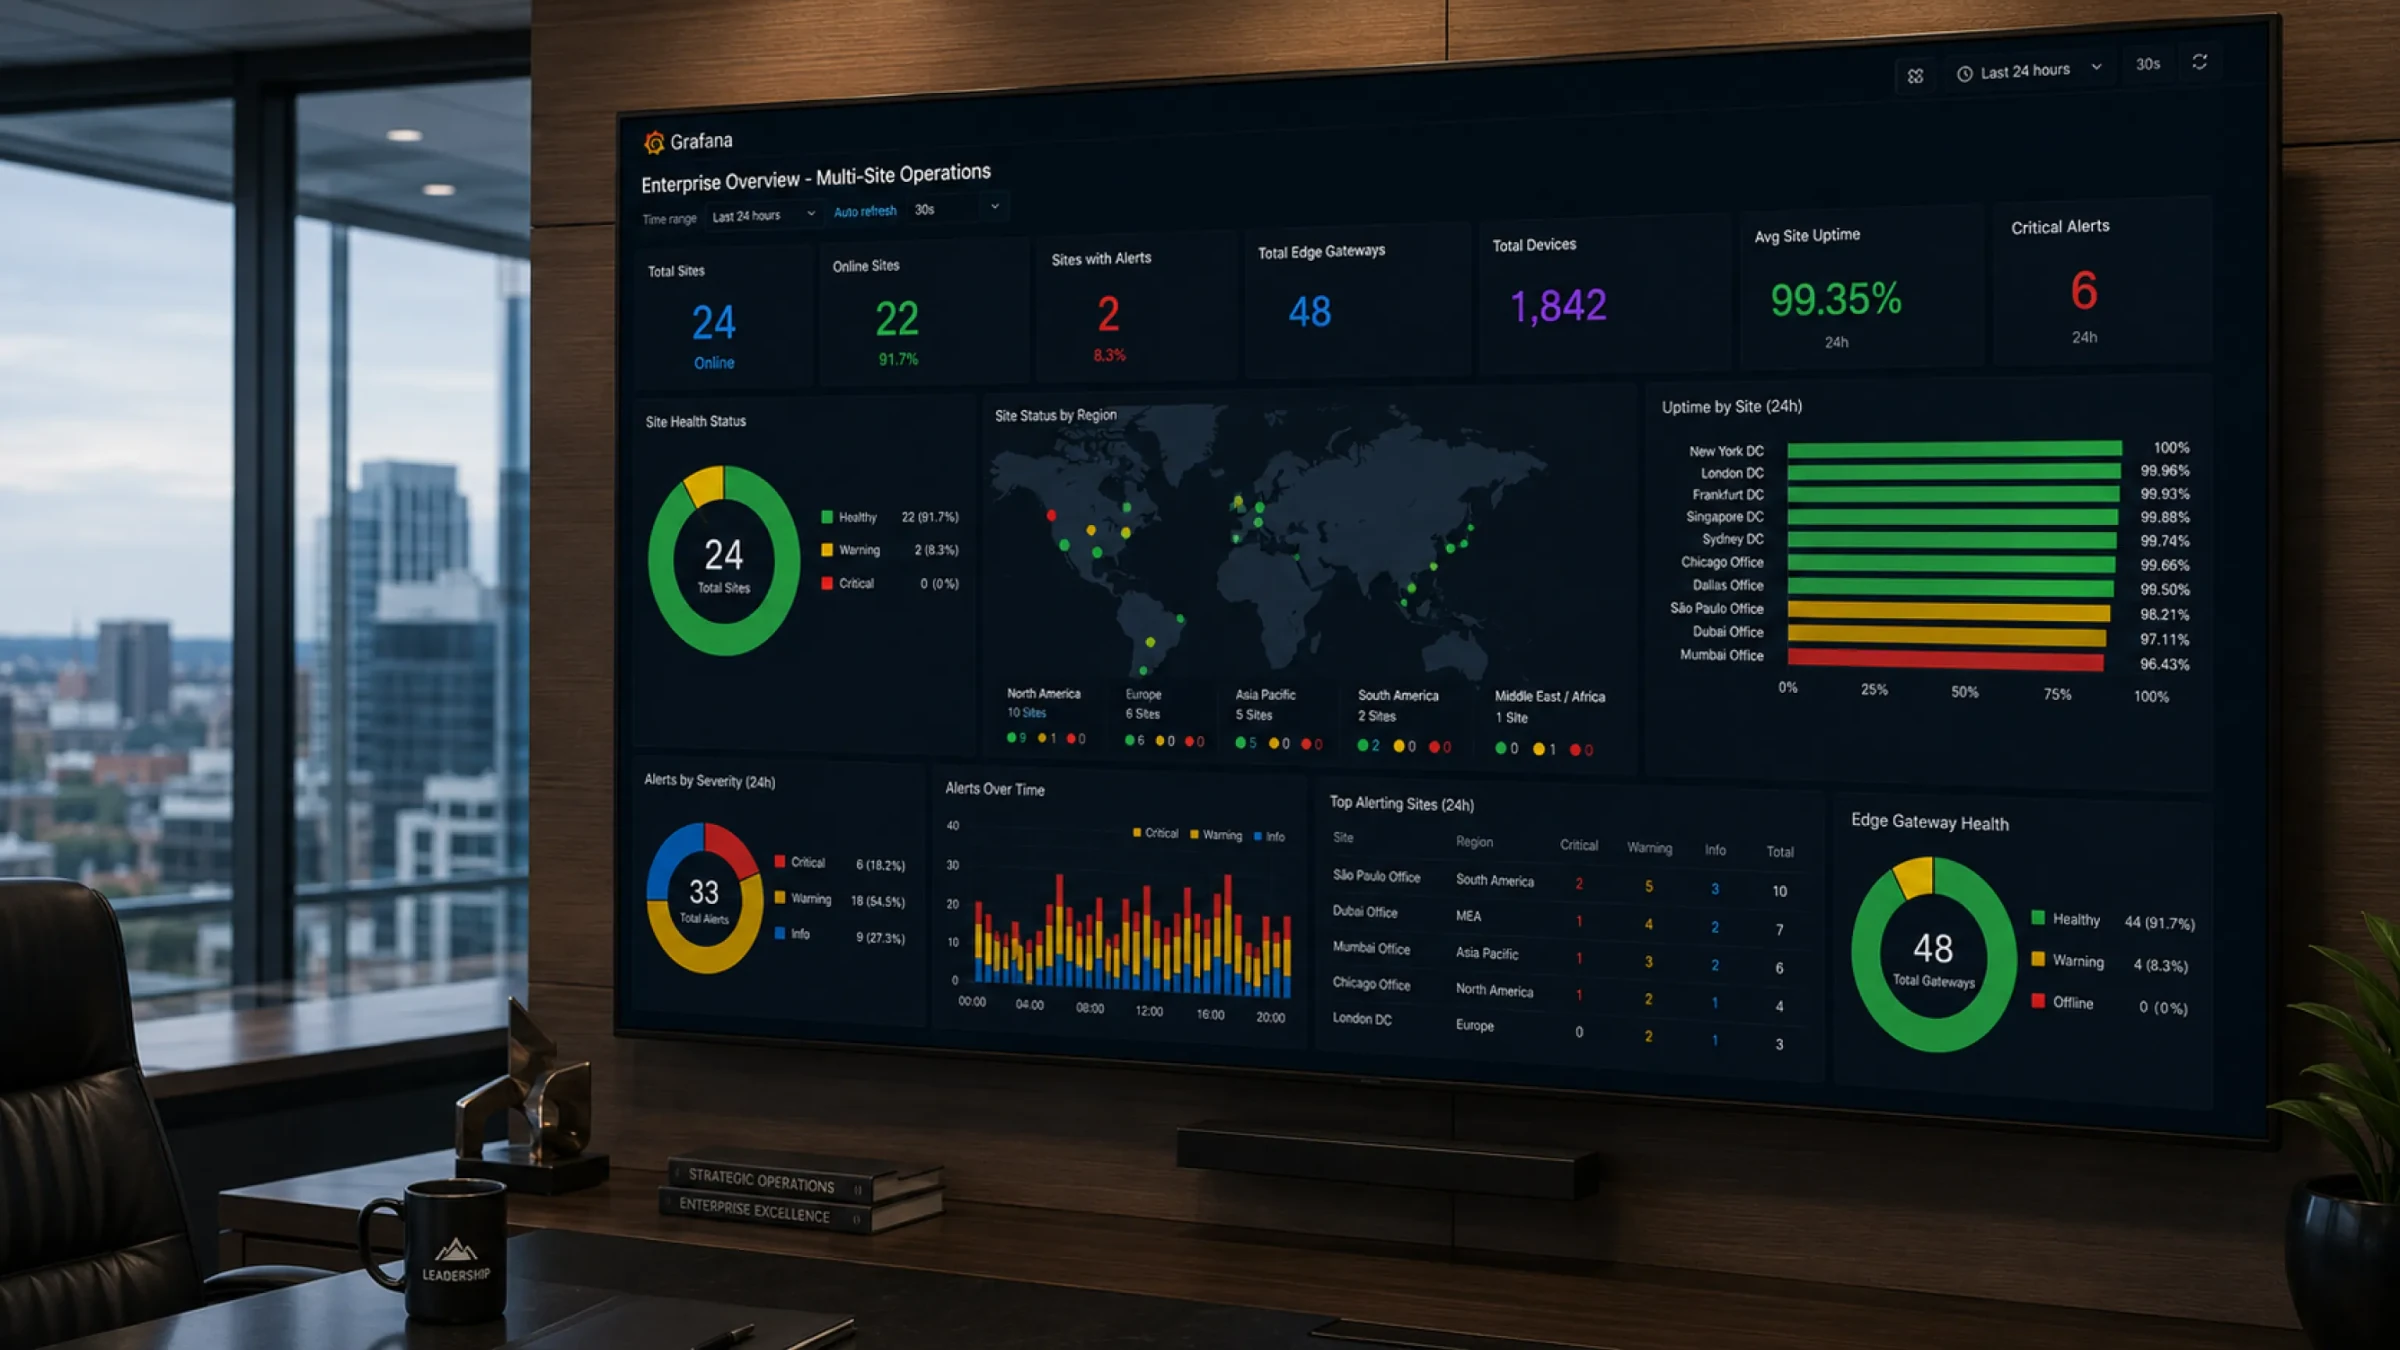
A Grafana TV dashboard keeps observability metrics on your NOC wallboards around the clock, without TV mode running in a browser somewhere. Fugo connects securely to your instance and displays your data on managed TV screens without public links, expiring sessions, or fragile browser workarounds.

Keep Grafana running on your TV screens
Connect your Grafana dashboards to Fugo once, then leave the day-to-day display work to us.
Pull in your dashboard
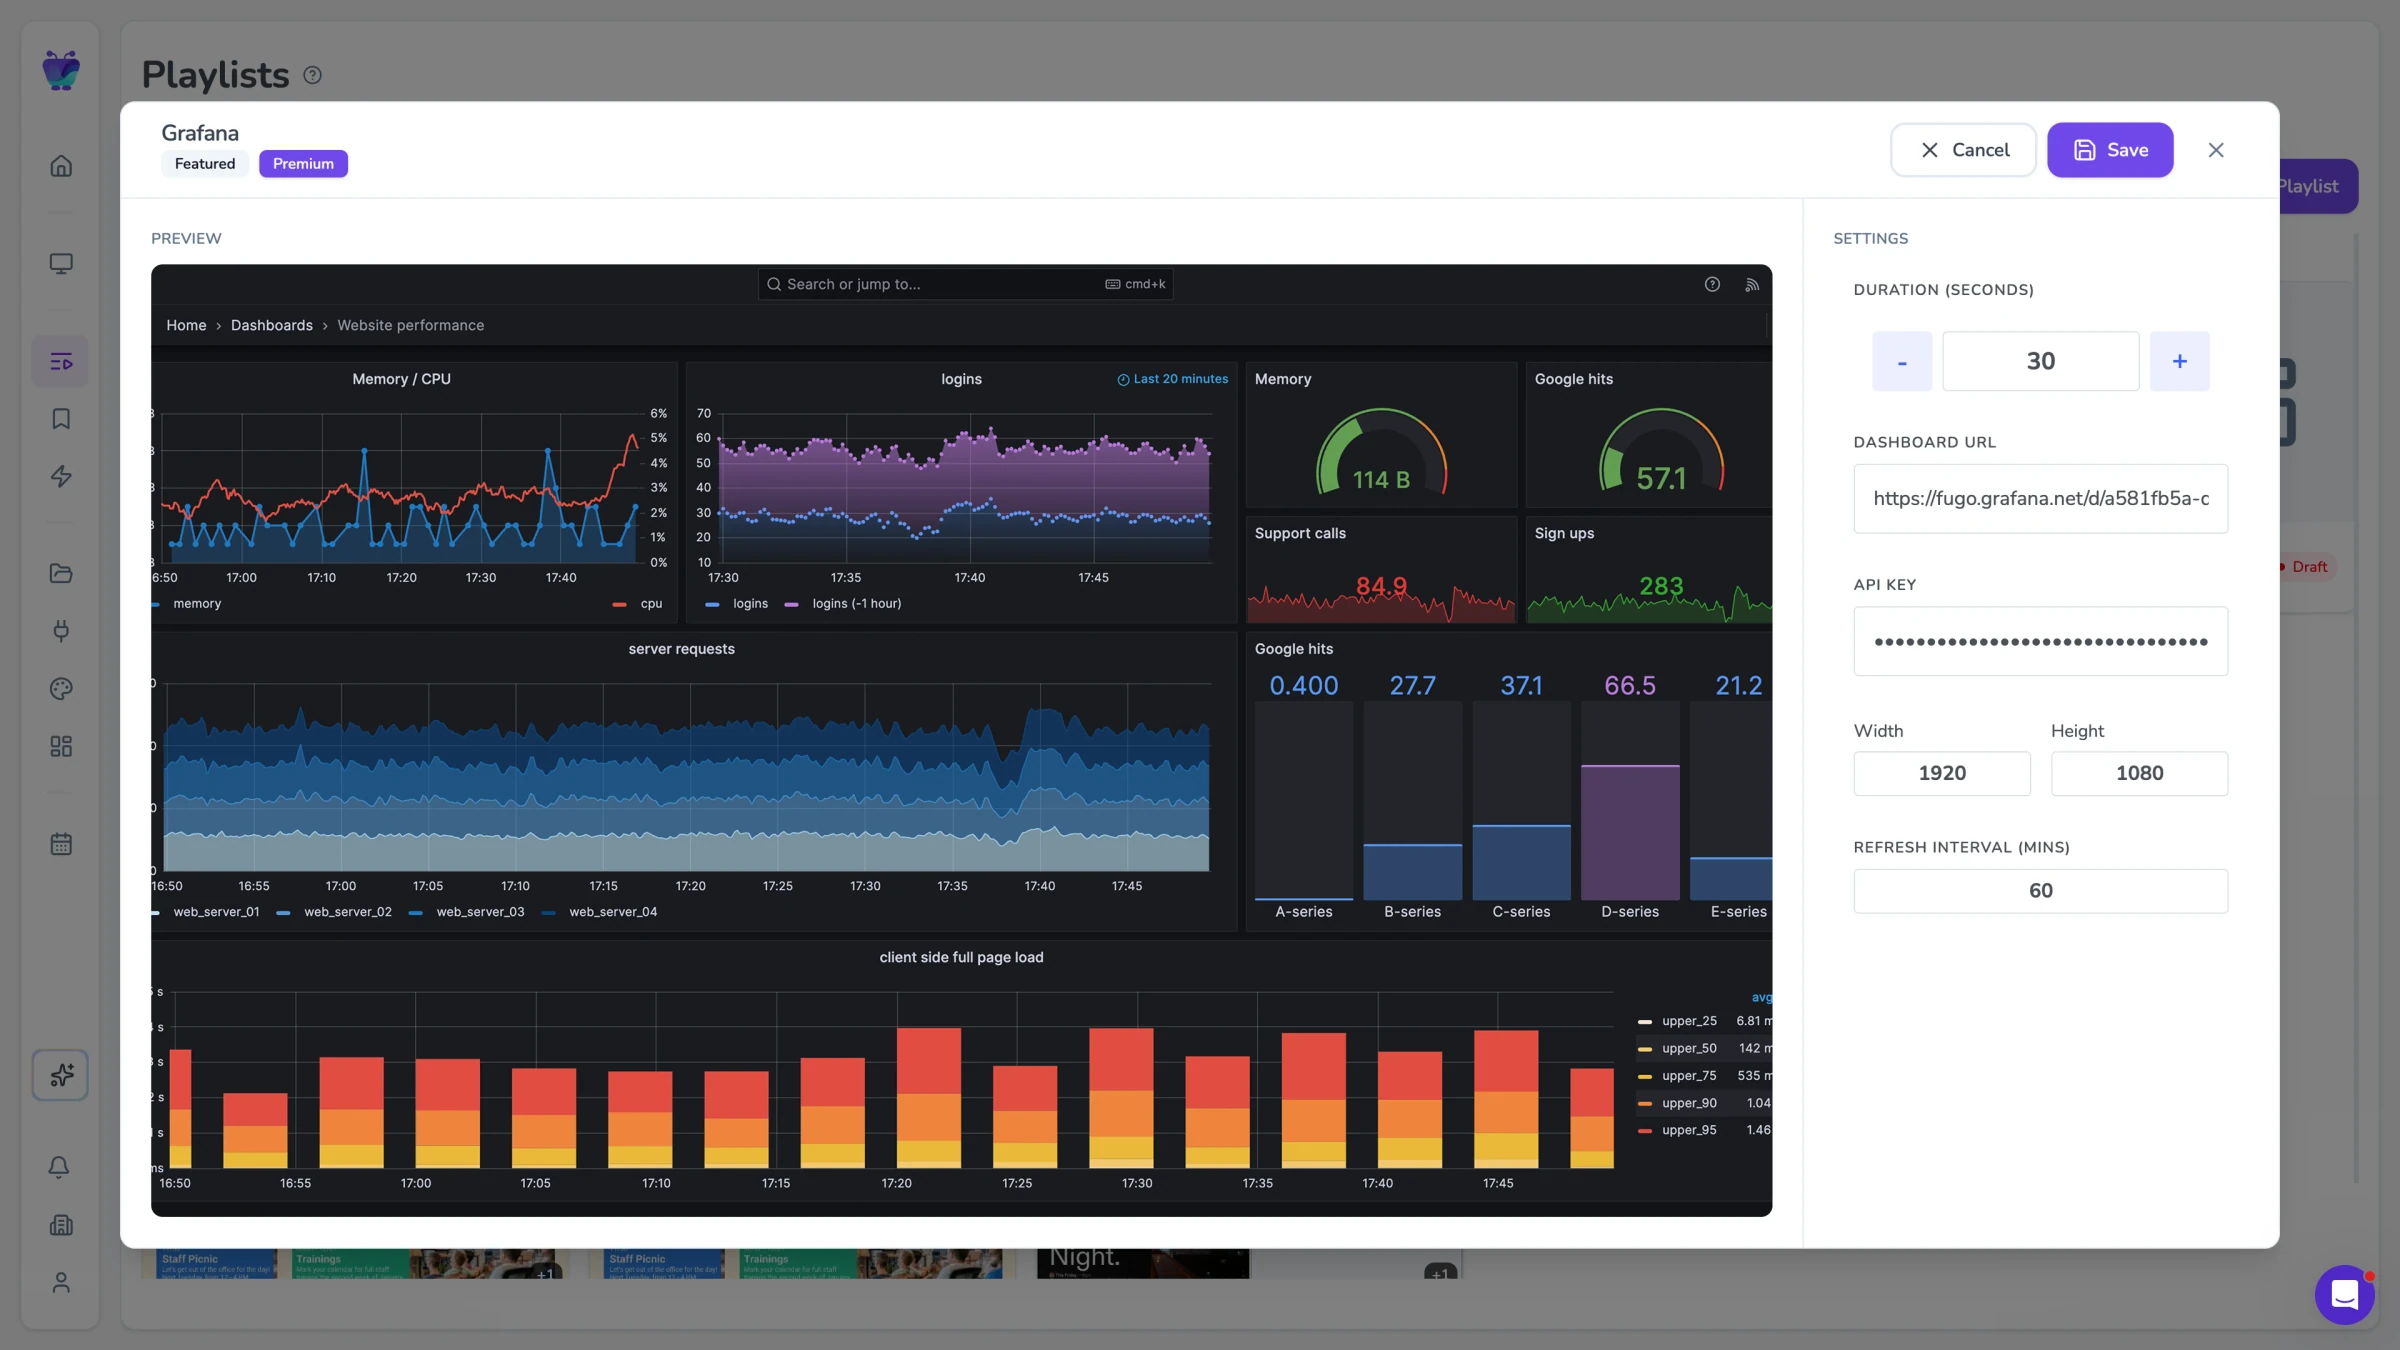
Add your dashboard URL & API key so Fugo can access Grafana without a browser login on the TV.
Configure the TV view
Set the display resolution & refresh interval for the dashboard you want on screen.
Run it through Fugo
Fugo loads fresh dashboard views and delivers them across the screens you assign.
Grafana wasn’t built to run unattended on a TV
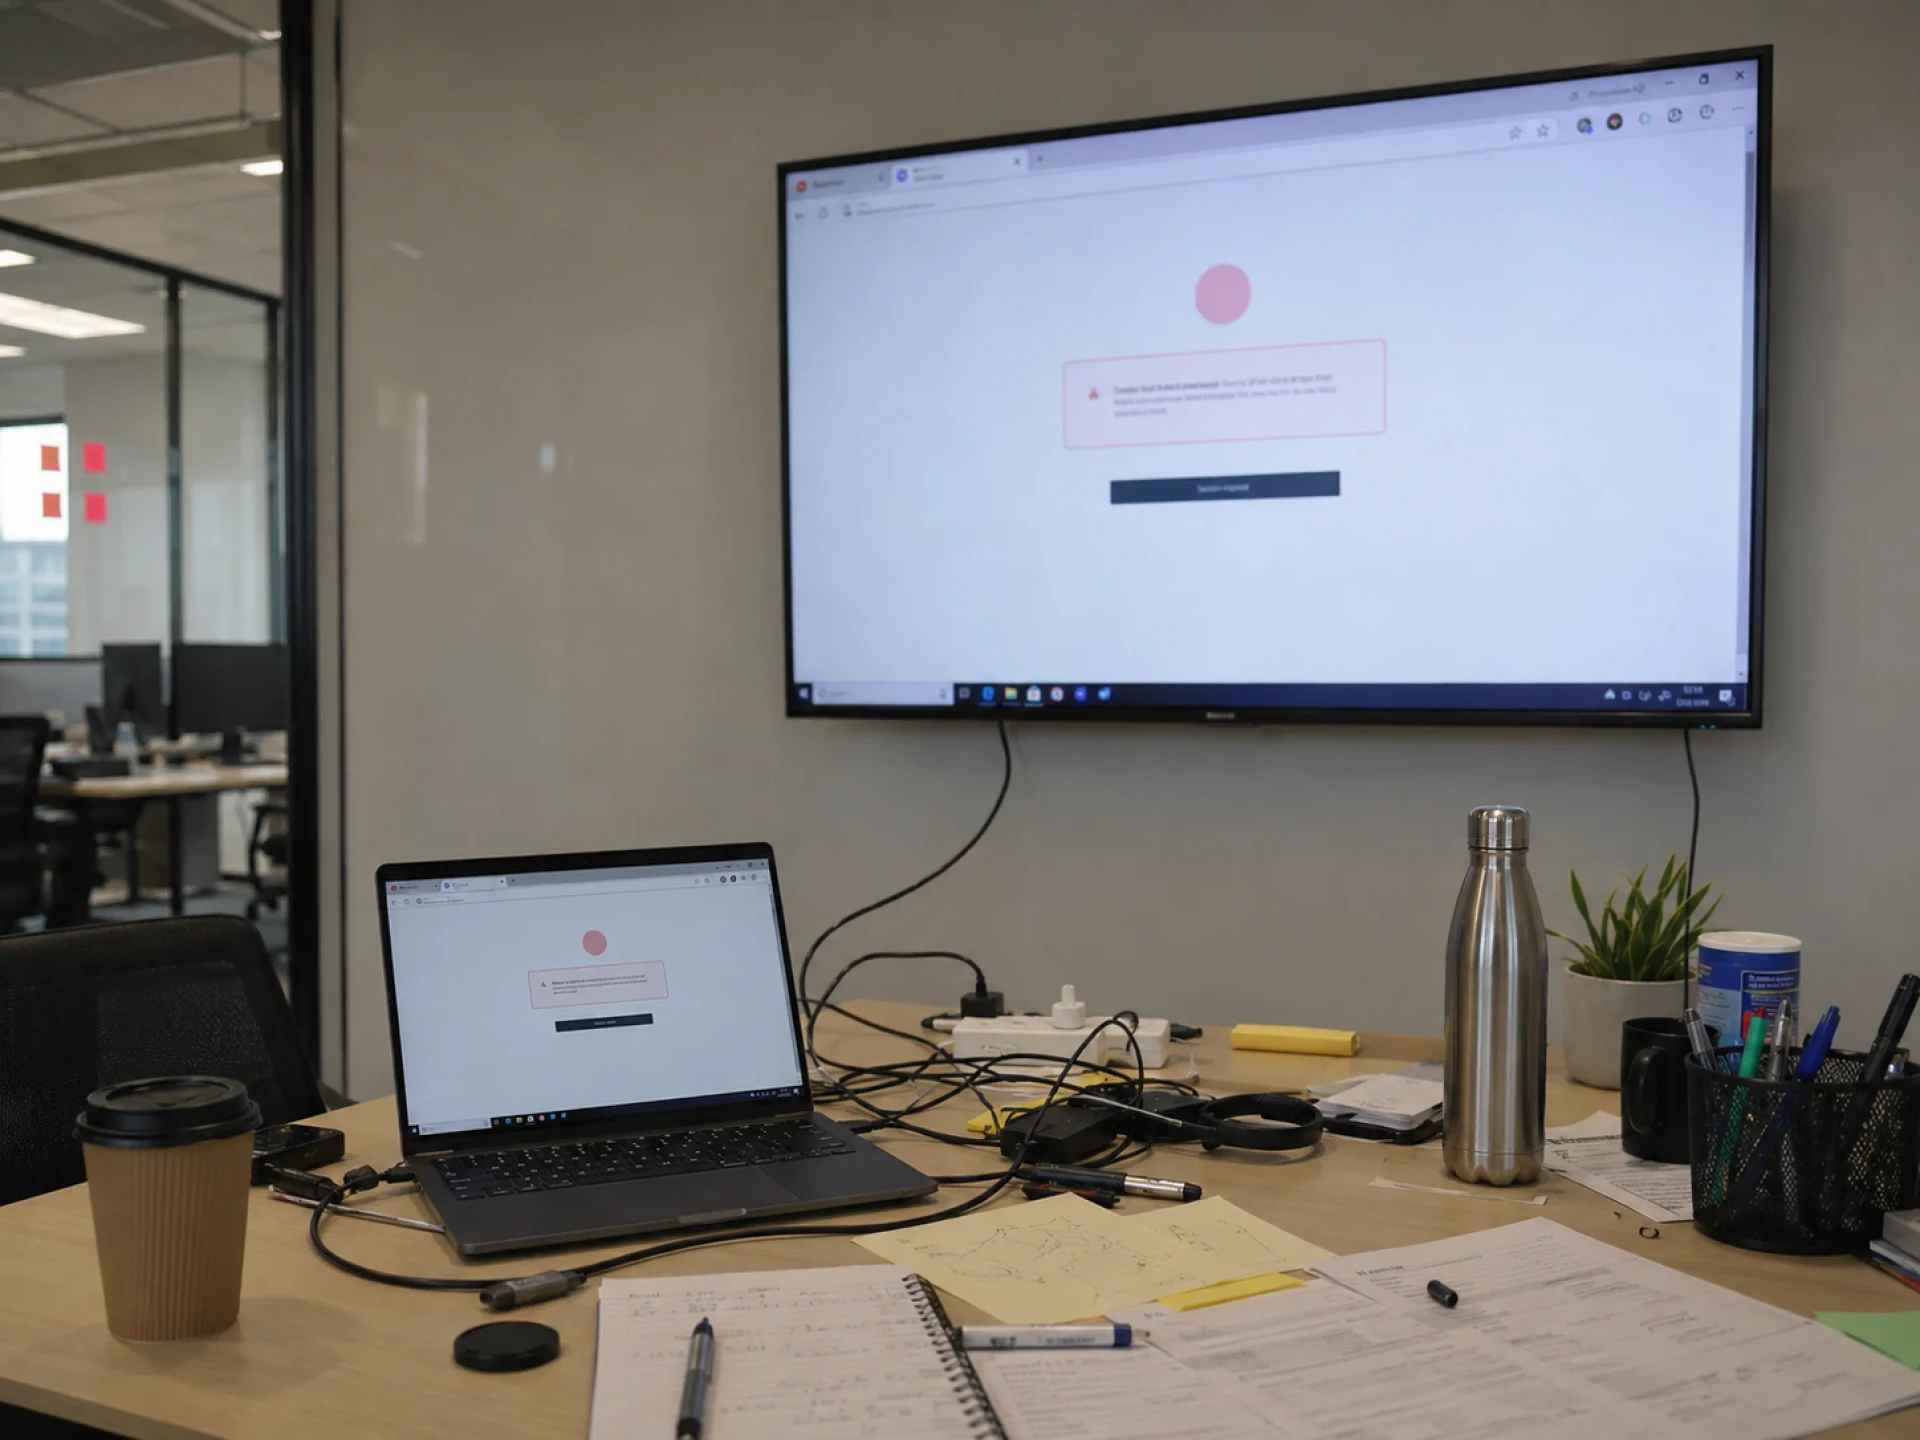
Grafana works well in a browser but always-on TV display introduces a different set of operational risks.
Sessions expire or require reauthentication
TVs lose focus or exit kiosk mode
Browser versions drift out of support
Auto-refresh stops after device sleep or reboot
No centralized monitoring of screen health
A Grafana integration built for digital signage
Secure service account access
Connect using a read-only API token or your existing authentication method, encrypted and never stored on screens.
Direct or rendered display modes
Load dashboards directly on capable players, or render them securely in the cloud for devices that can't run modern browsers.
Controlled refresh behavior
Set how often dashboards update on screen so wallboards stay aligned with your configured Grafana refresh cadence.
Kiosk-ready layouts
Crop panels, adjust scaling, and remove browser chrome so dashboards remain readable from across the room.
Targeted screen assignment
Assign specific dashboards to specific screens or locations so each team sees the metrics that matter to them.
Centralized monitoring
Monitor screen status across locations, restart devices remotely, and receive alerts if dashboard playback fails.
Keep operational signals where teams can see them
Put Grafana dashboards on shared screens so teams can monitor what’s happening throughout the day without constantly checking the dashboard themselves.
Network operations centers
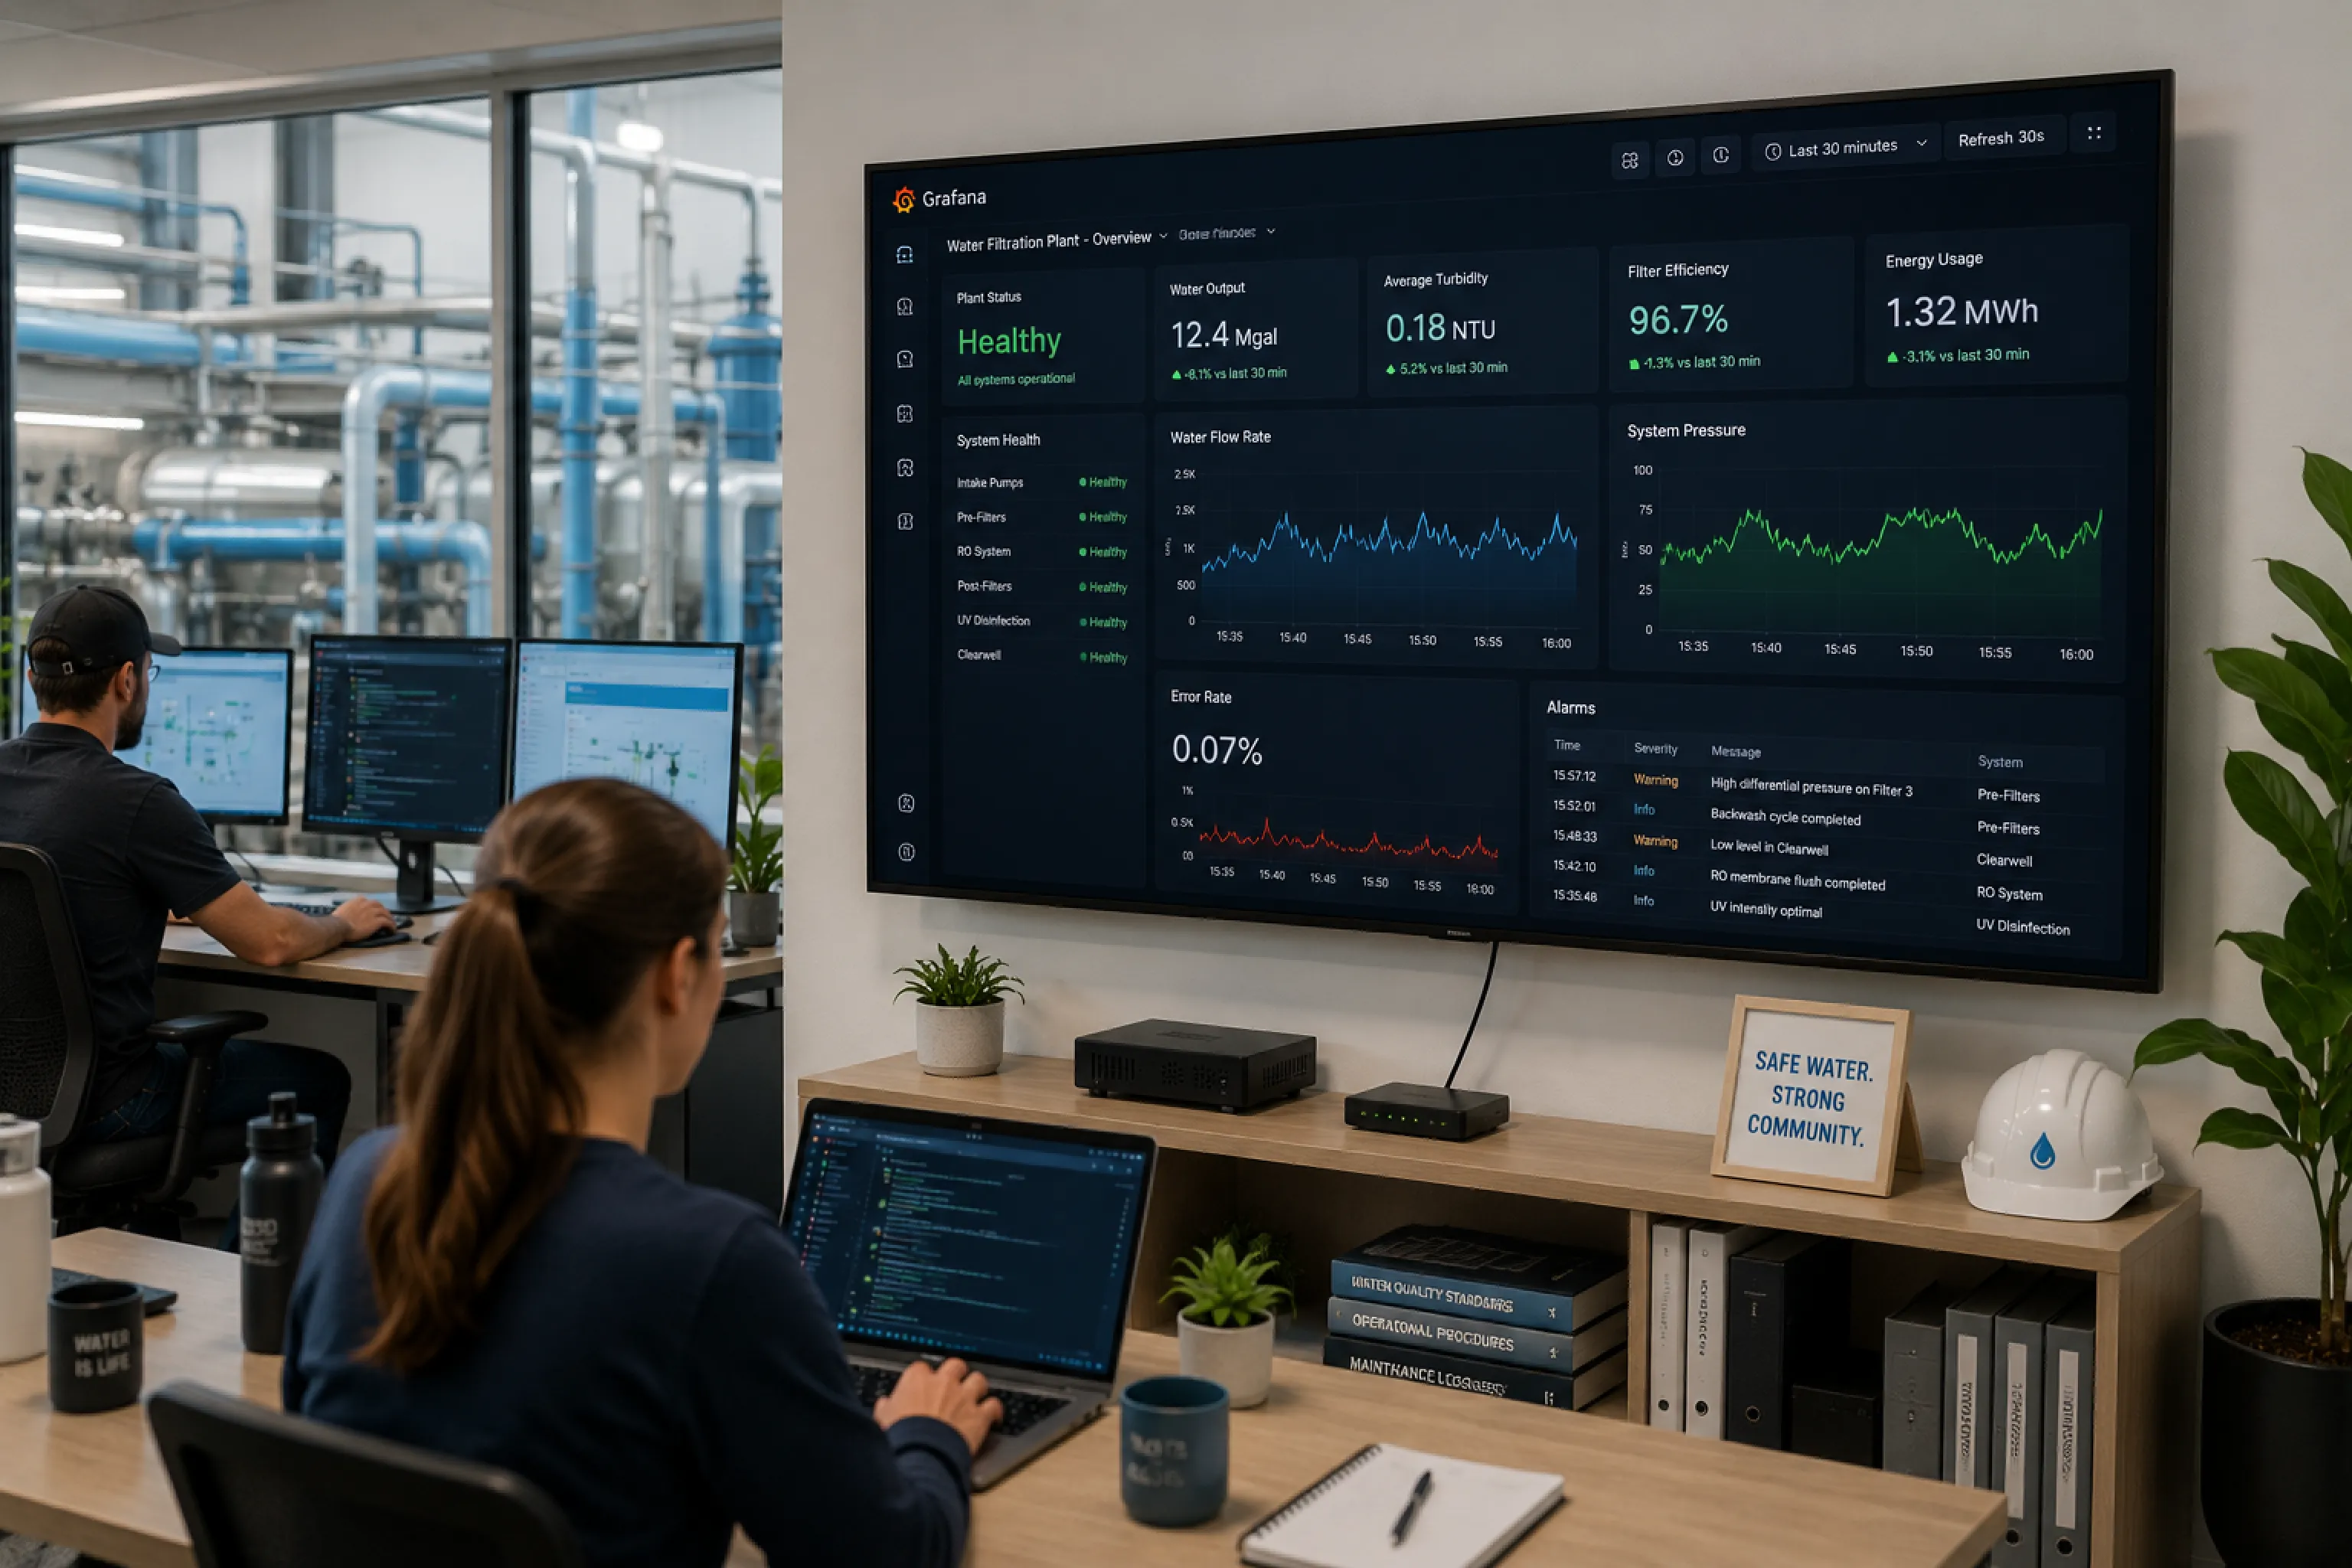
Uptime, latency, traffic, and alerts stay visible across the room, giving NOC teams a shared picture of network health as conditions change.
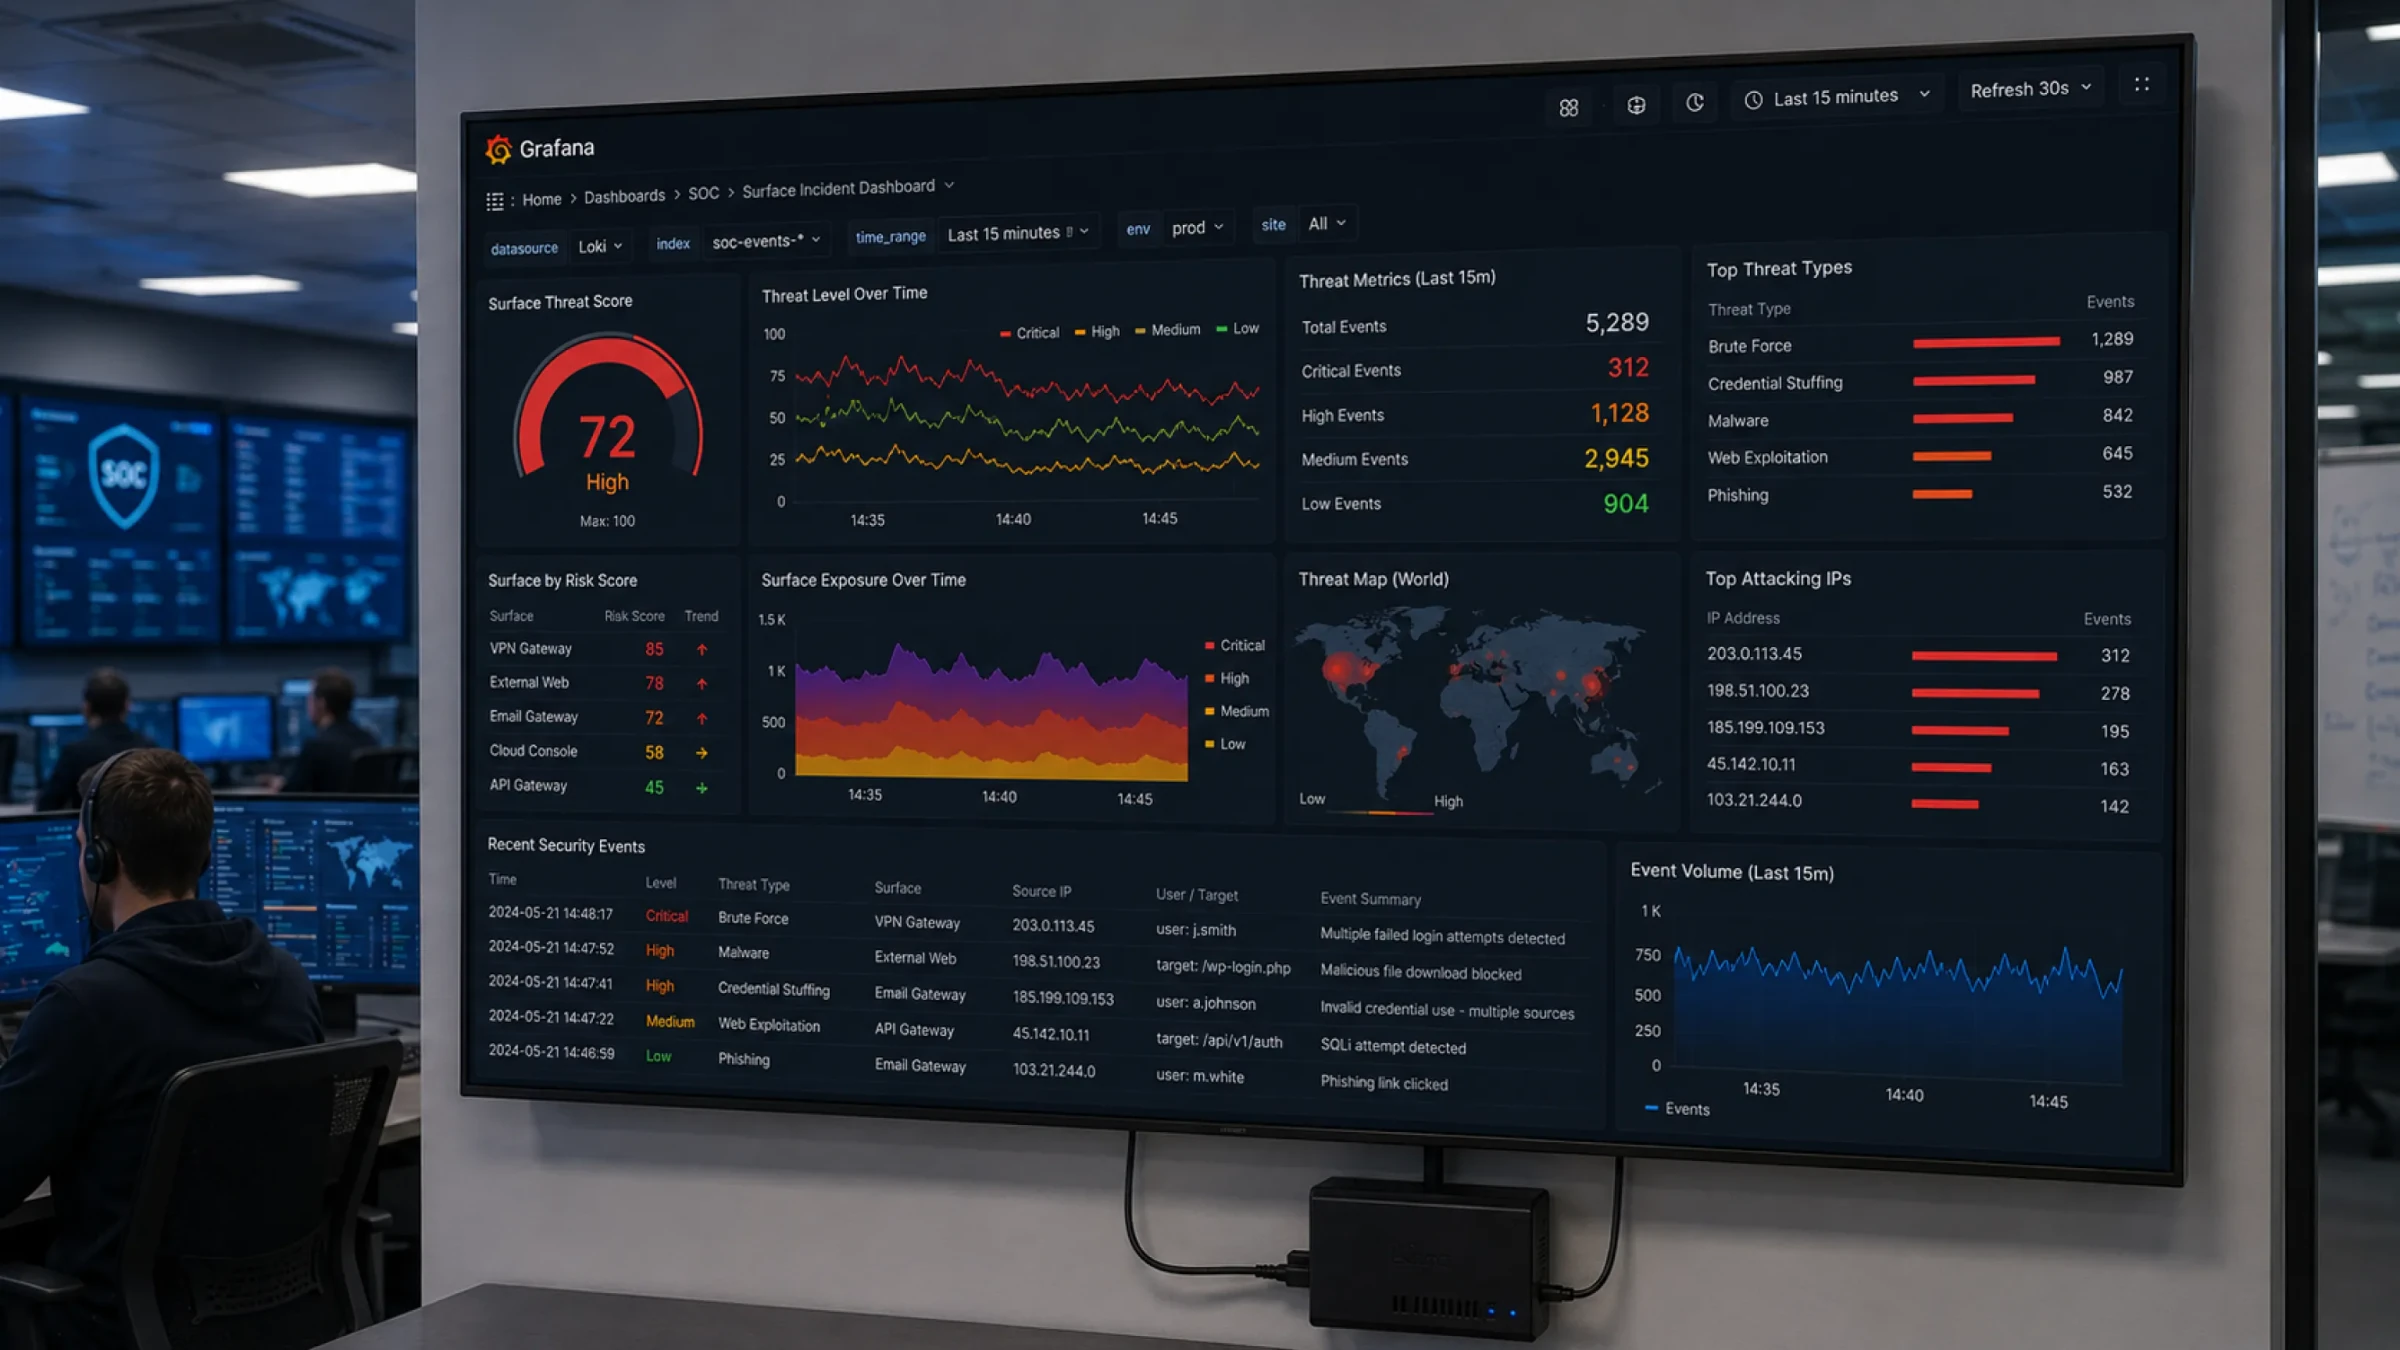
When Grafana detects a problem, make the screen react
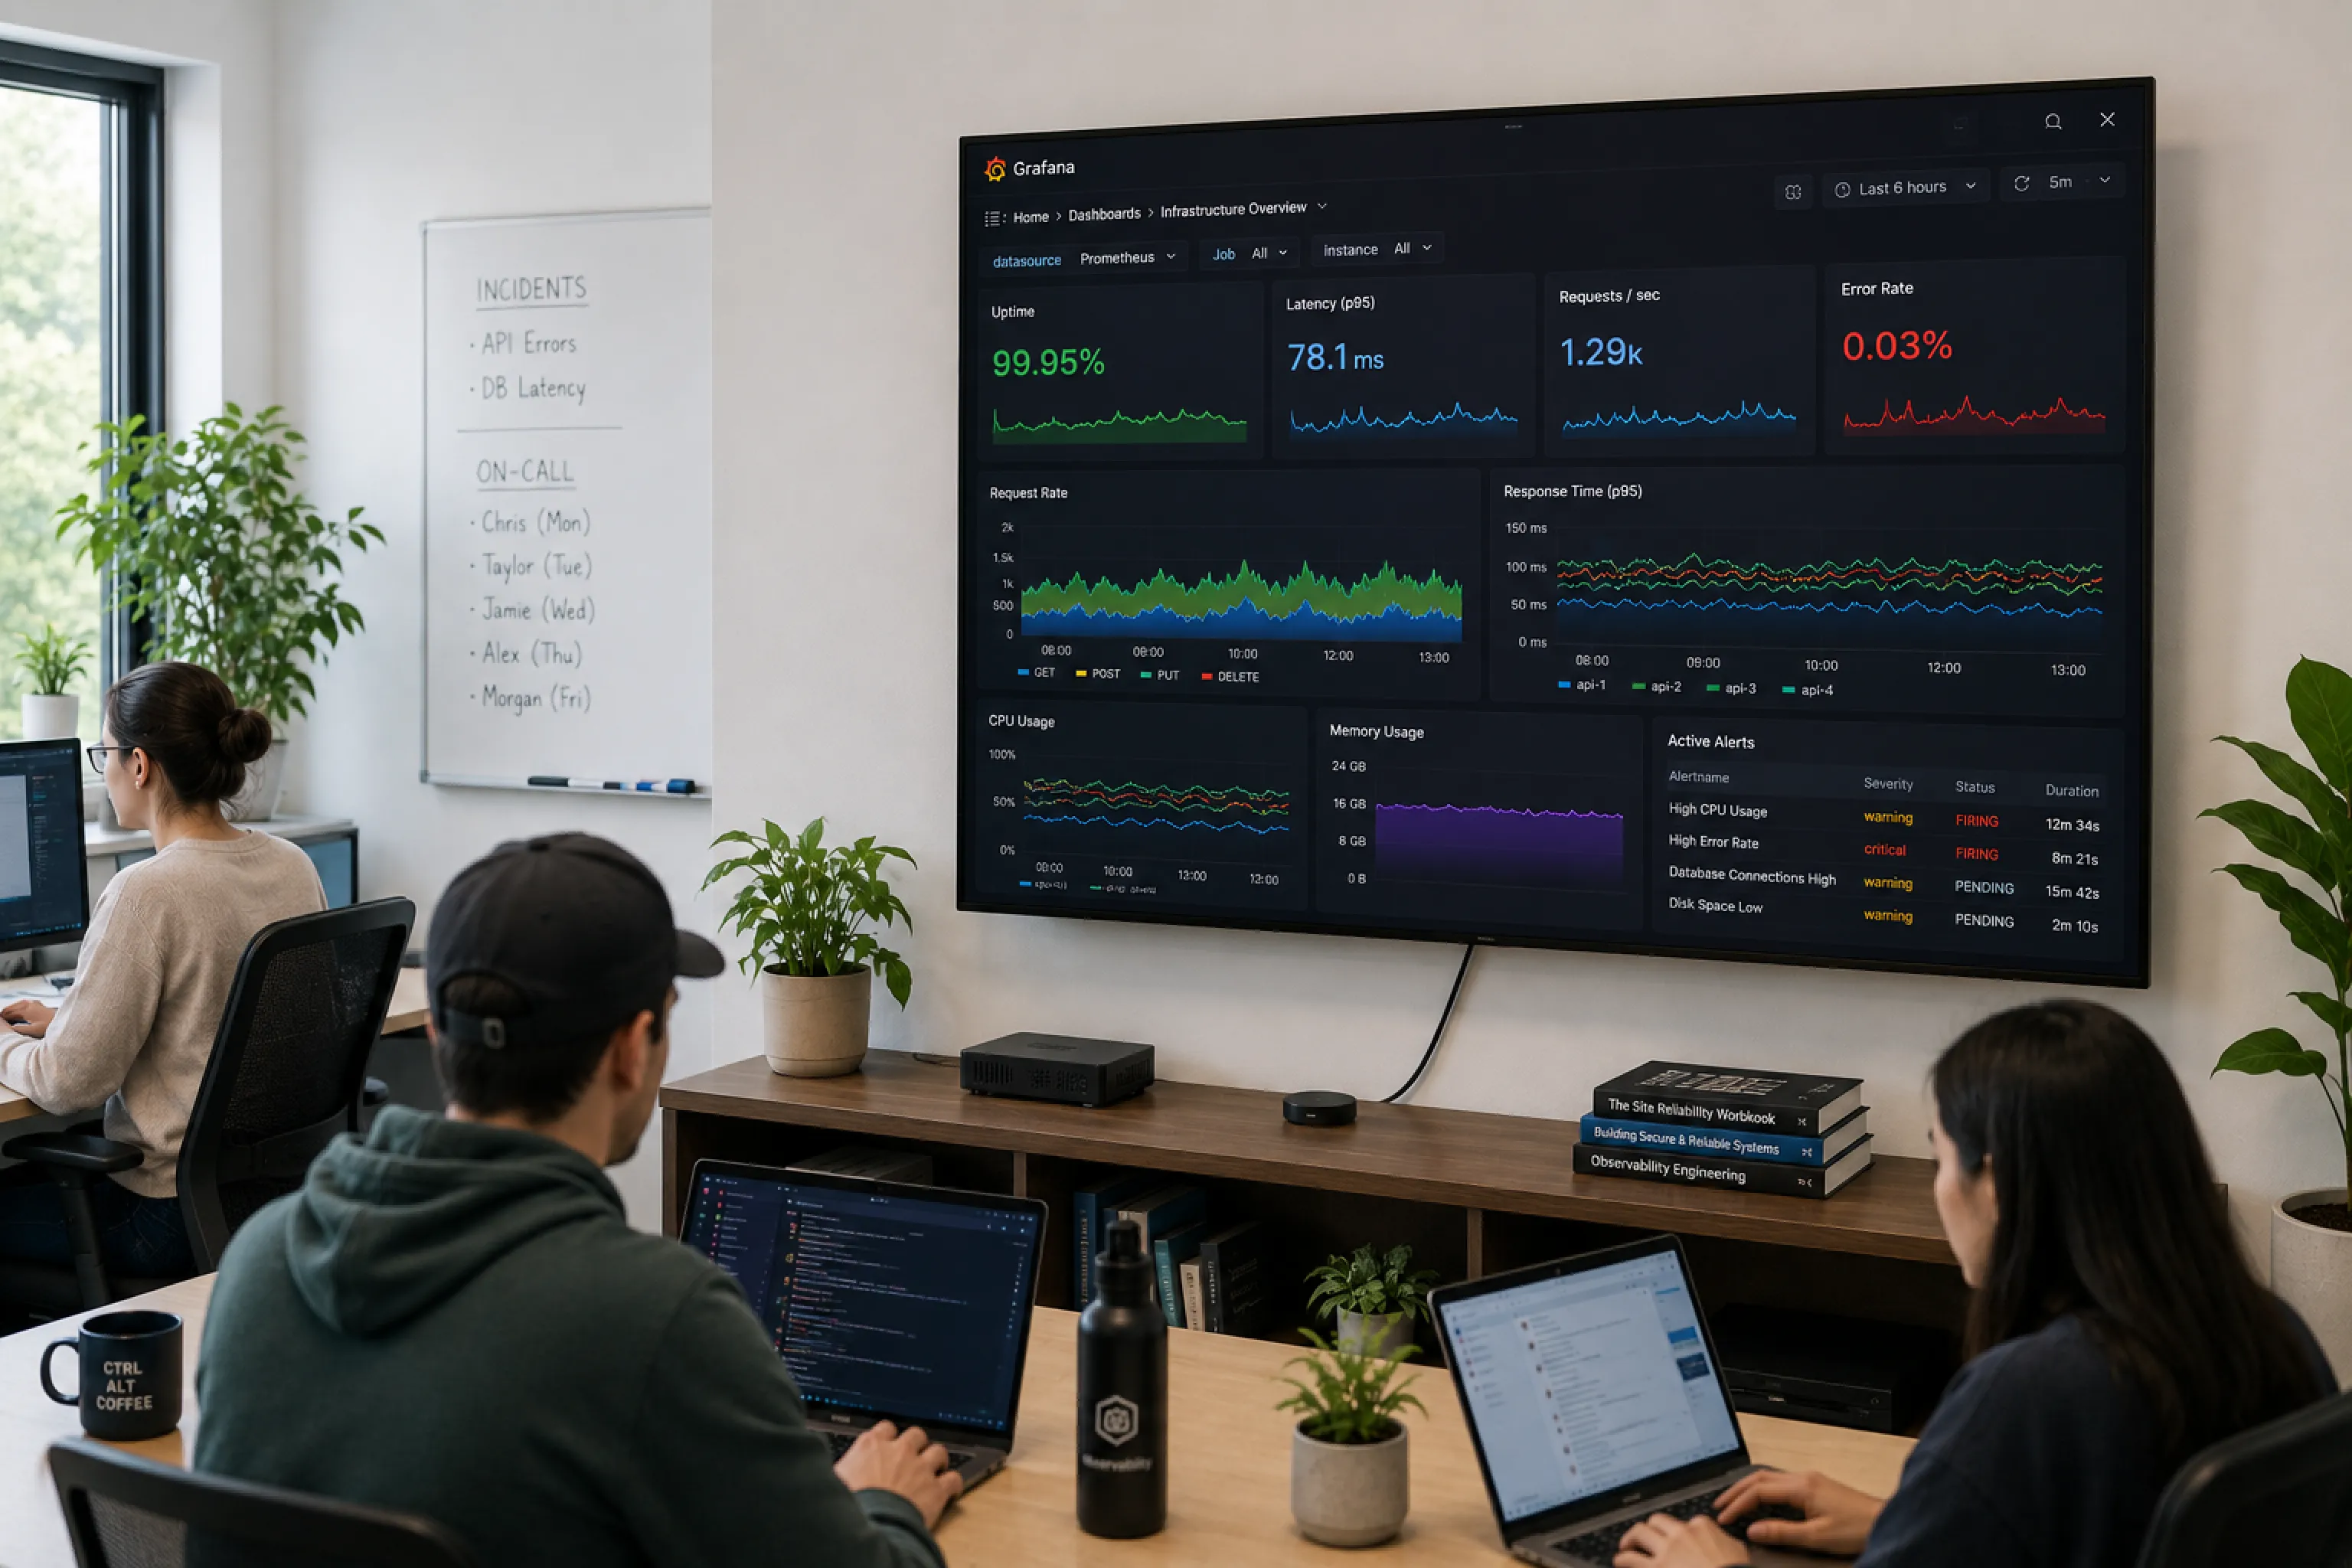
Use changes in the systems you monitor to trigger screen takeovers, so critical conditions break through the noise of an always-on dashboard.
Explore Triggers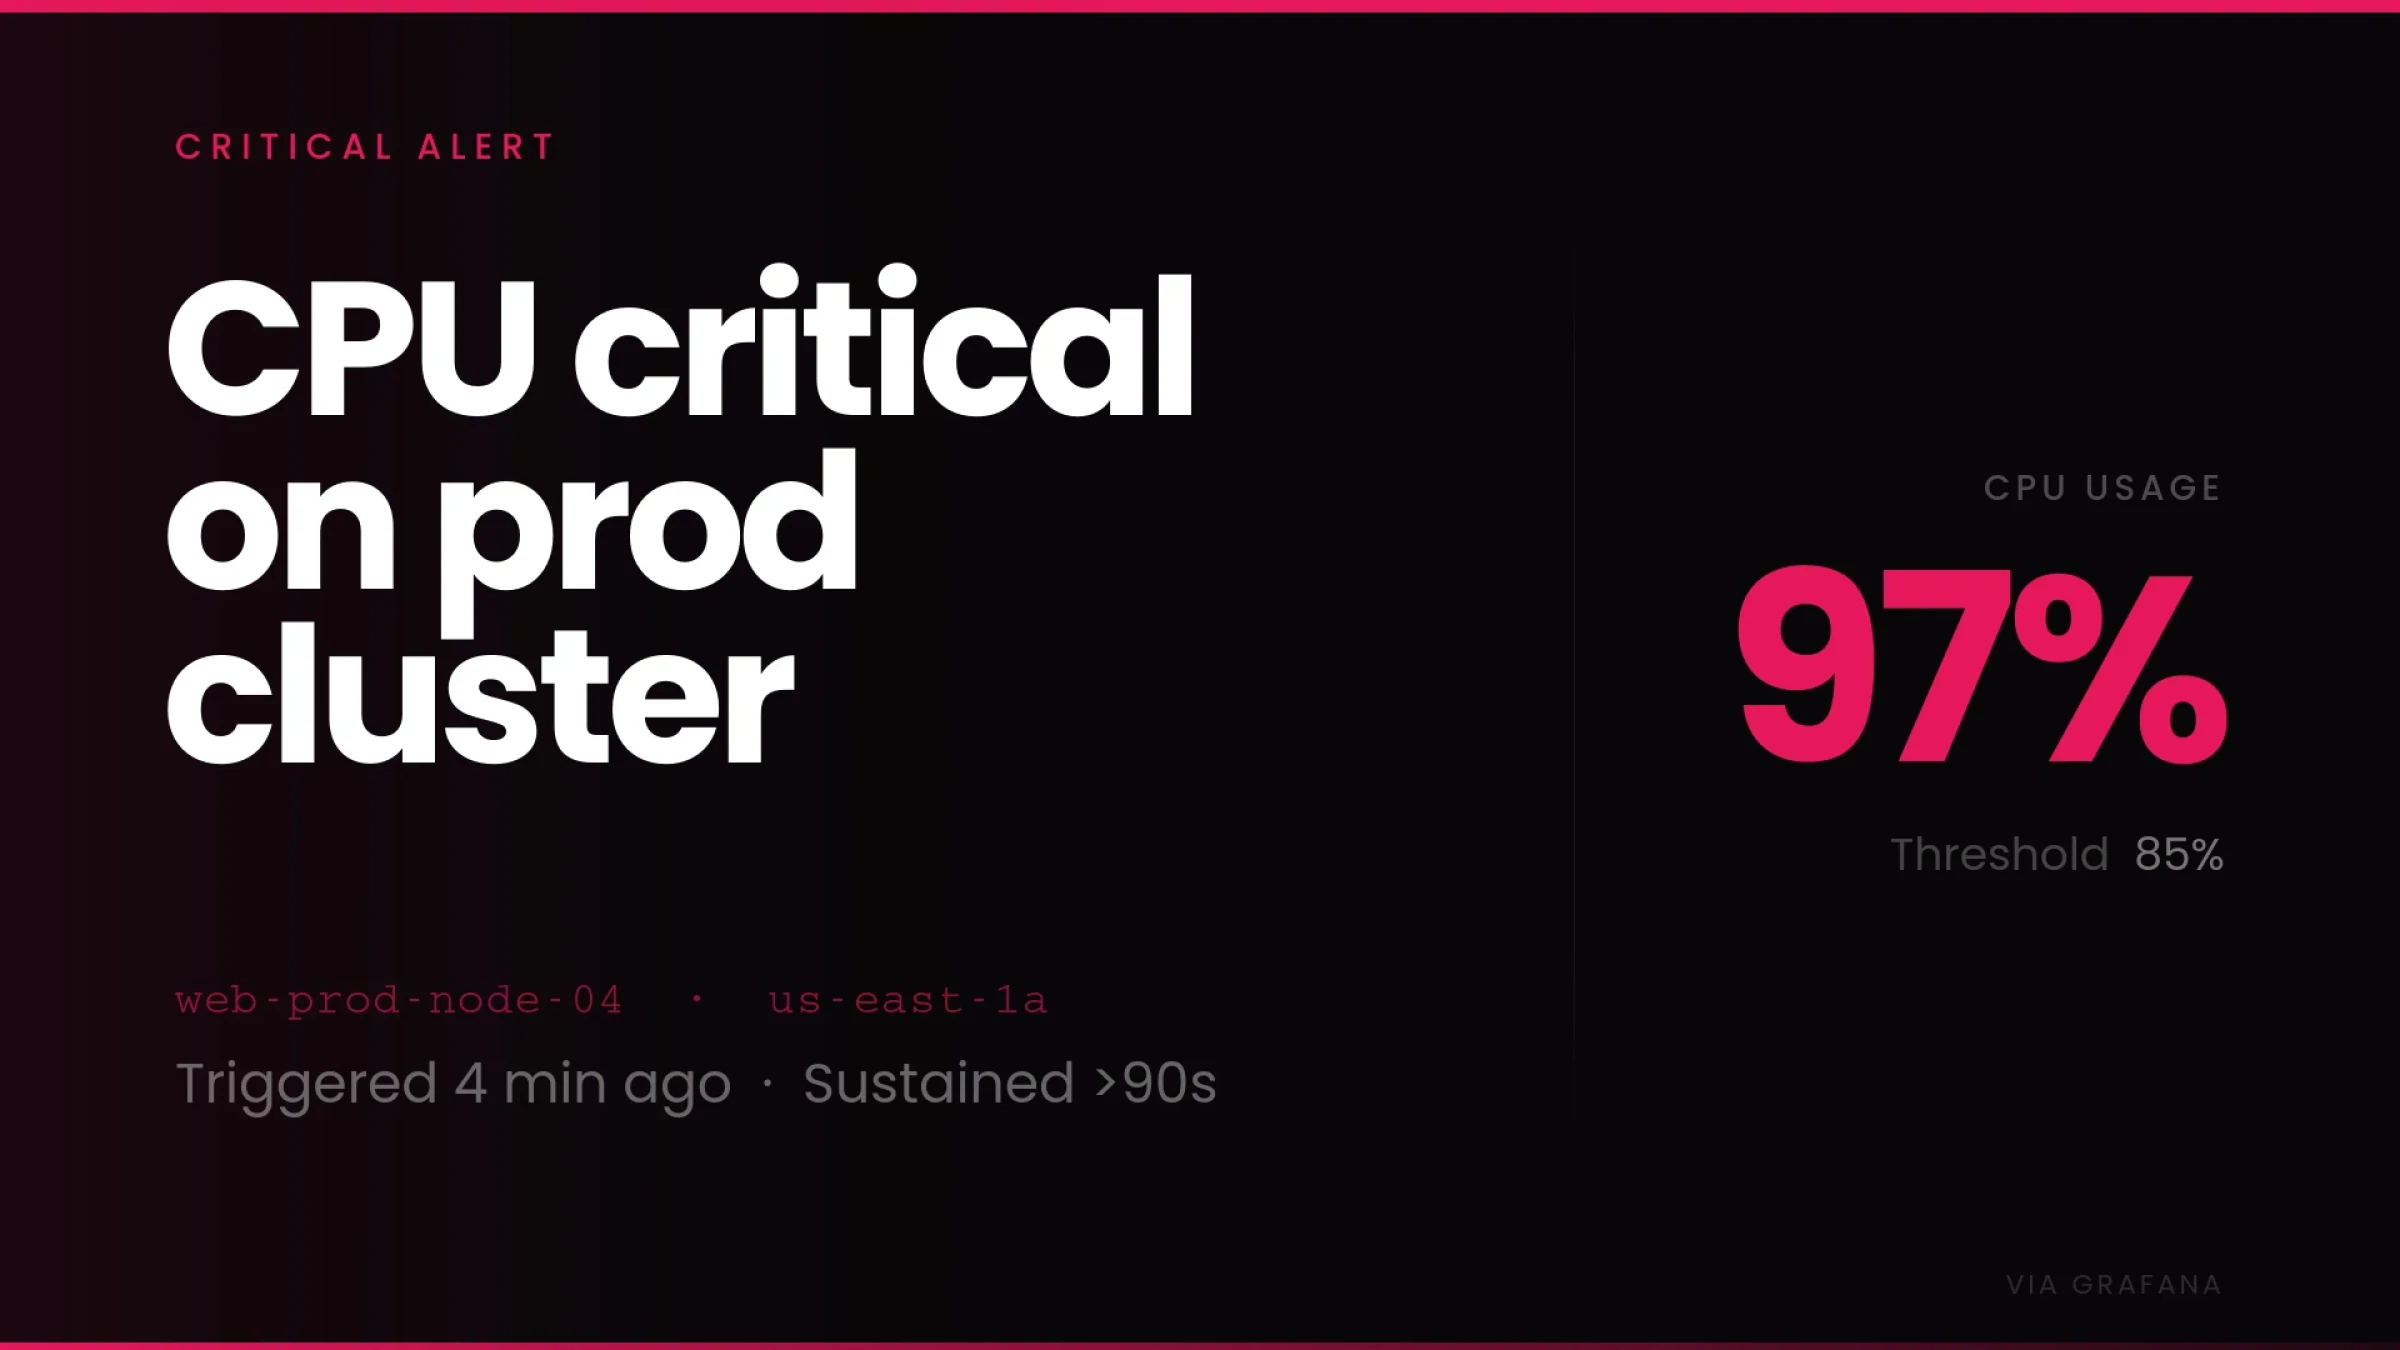
Break through the dashboard
Take over the screen when a critical threshold is crossed.
Escalate developing issues
Bring worsening conditions into focus before they become bigger problems.
Signal the recovery
Let the room know when systems return to normal.
Fugo works with the rest of your stack
Grafana may be your starting point for data display, but it doesn't have to be the limit.




More on TV dashboards
Guides, comparisons and practical how-tos from the Fugo blog.