

Yellowfin BI
3 min read · Updated November 12, 2026
Experience data-driven insights with Yellowfin BI's interactive dashboard, designed for real-time analytics and enhanced decision-making efficiency.
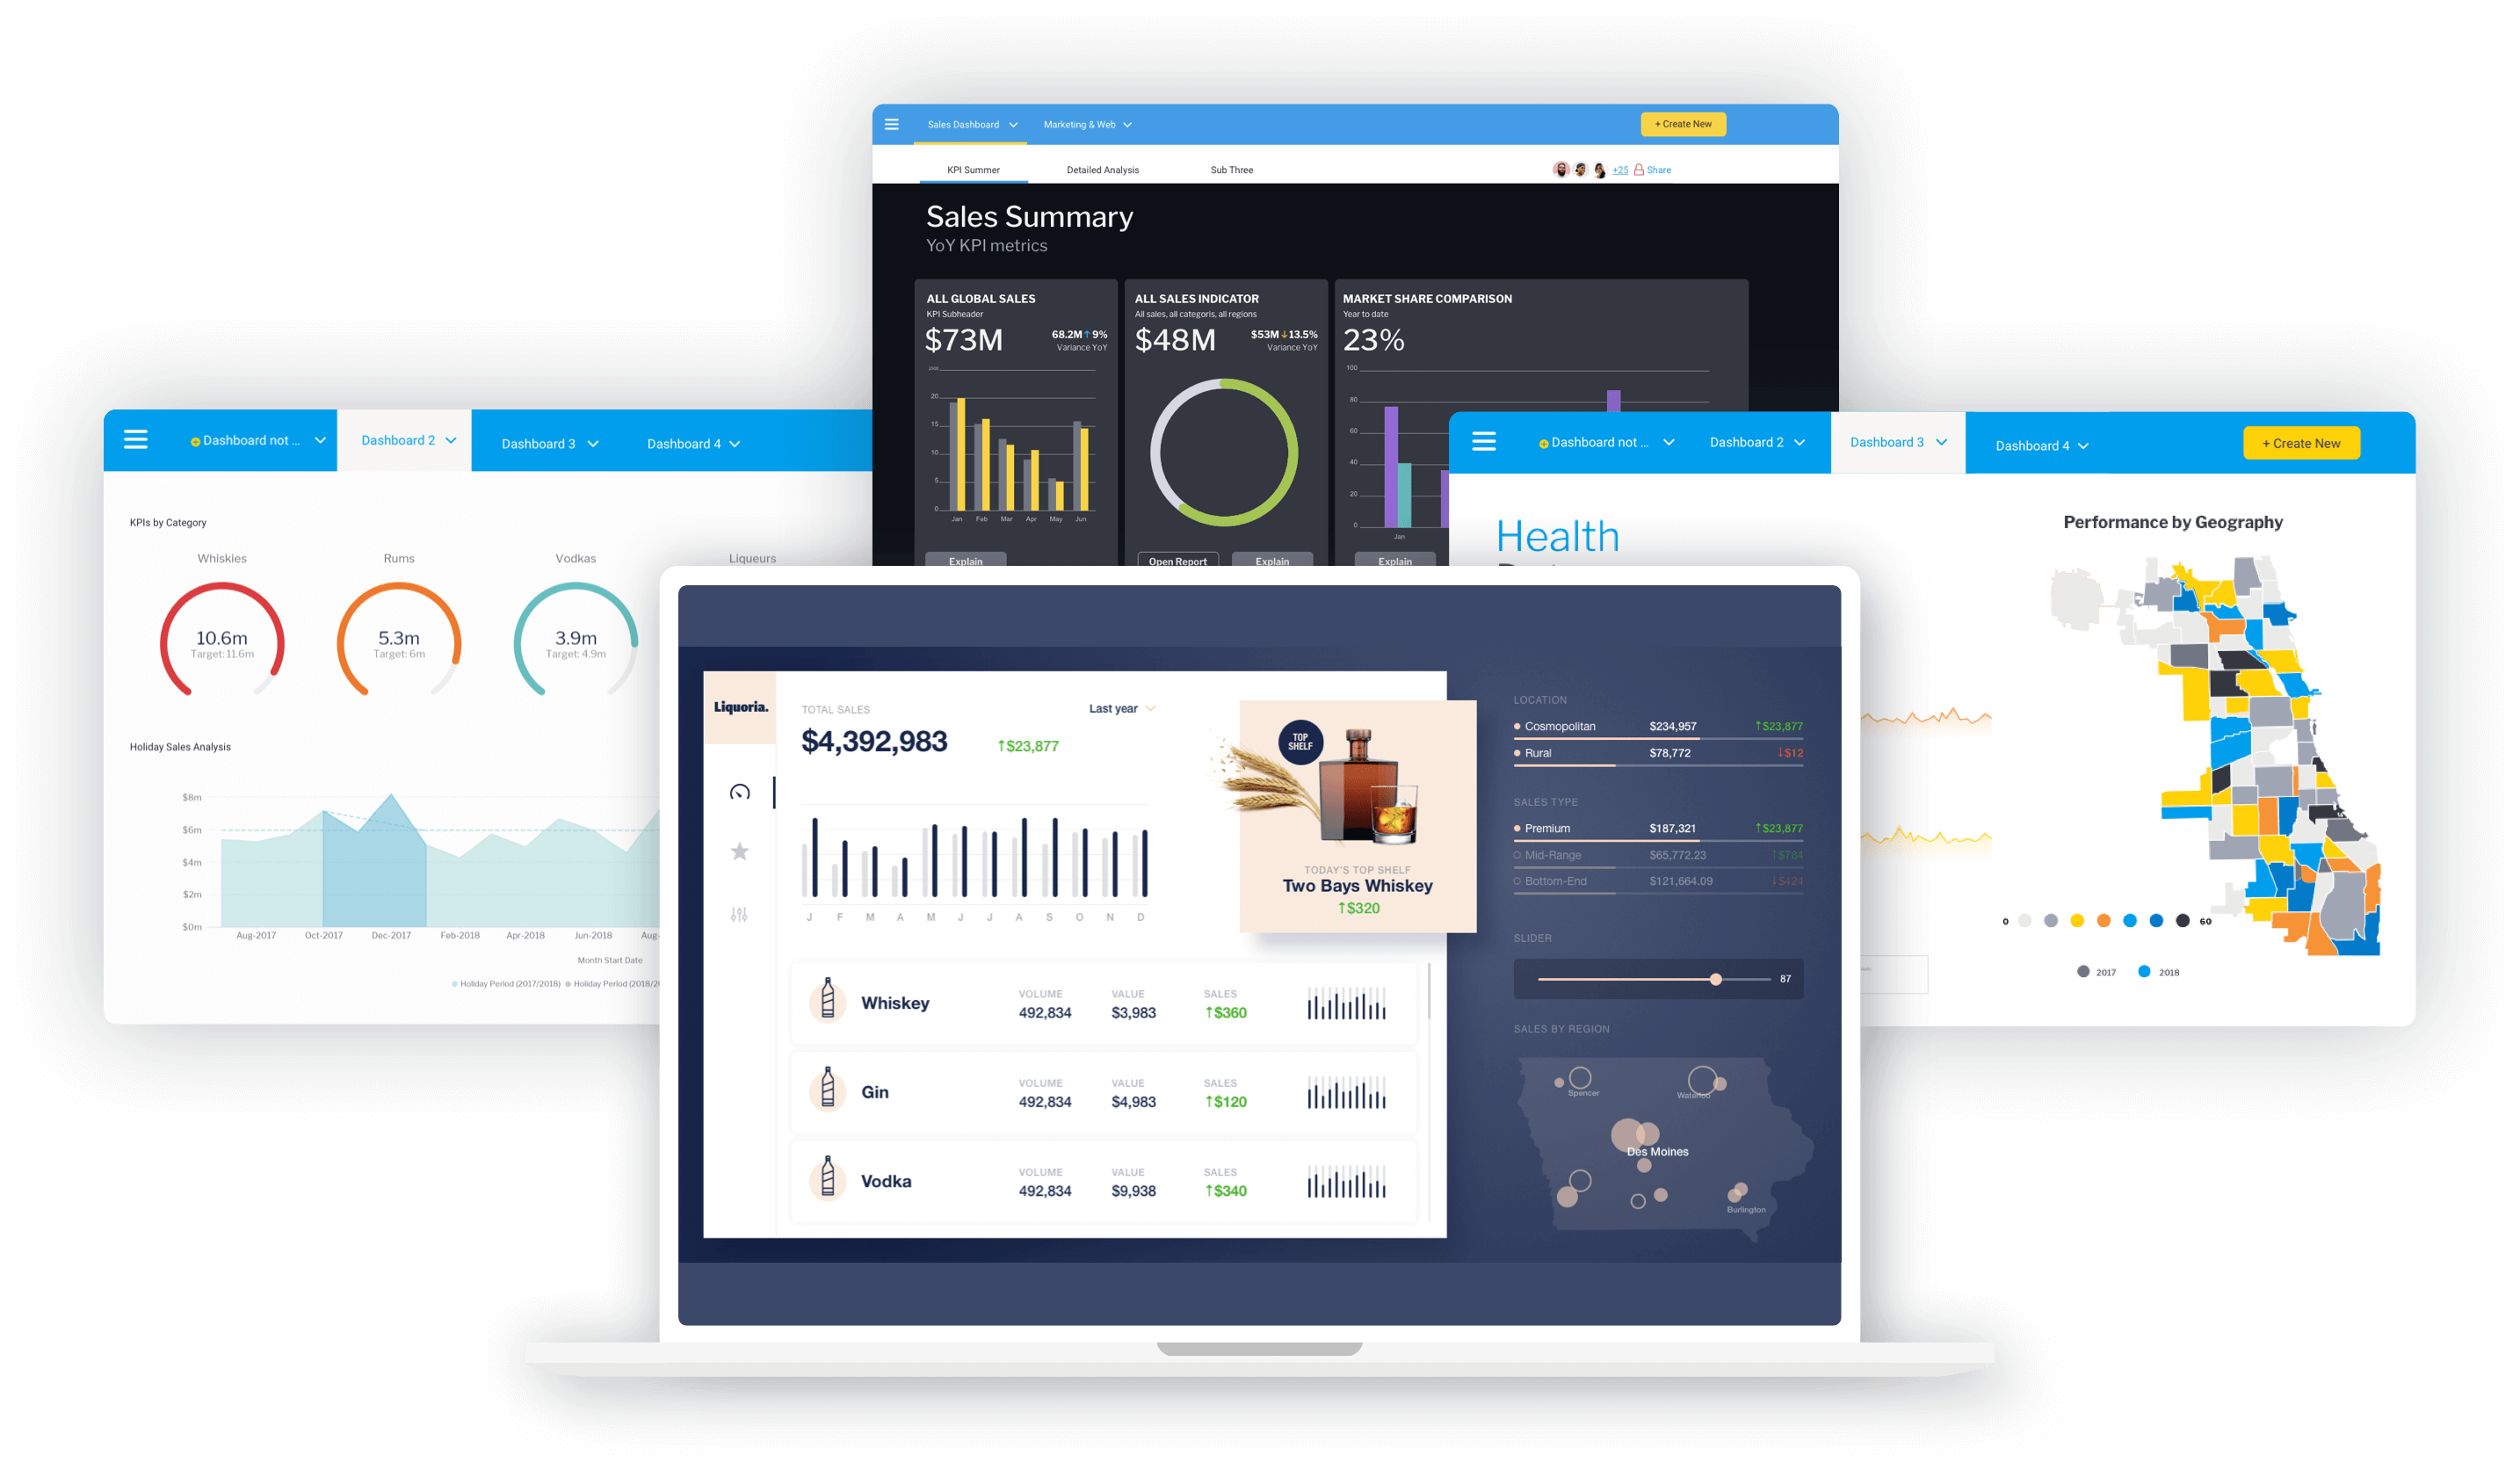
Yellowfin BI combines interactive dashboards with drill-down exploration and predictive modeling. For a screen on the wall, the goal is to take the headline view and make it readable from across the room.
Key takeaways
Yellowfin supports drill-down, but a TV shows one fixed view, so choose the level that matters.
Build a dedicated wall dashboard instead of showing a working analysis.
Fugo can sign in, load the view and publish it to your screens on a schedule.
Use rotation to cover several dashboards on one screen.
What Yellowfin BI dashboards offer
These are the capabilities listed for Yellowfin, with a note on how each one applies to a TV.
Drill-down exploration
Useful at a desk. On a screen, show the summary level and leave the drilling to people who need it.
Customizable dashboards and reports
Layouts and visualizations can be tailored, so you can make a wall version with large charts.
Predictive modeling
Forecast views give a room something forward looking to discuss, beyond what already happened.
Collaborative analysis
Teams analyze together, and a shared screen carries that into the physical workspace.
Data source connections
Yellowfin connects to databases, cloud services and third-party applications, so a single view can draw on several.
Where it fits and what to show
Yellowfin is used by analysts and decision-makers across industries. Here is how that translates to a screen.
| Team | What to put on the screen |
|---|---|
| Finance | Revenue, margin and variance against plan for the current period. |
| Healthcare | Operational measures that staff should see through the day, kept free of personal data. |
| Retail | Sales by store or category with a clear comparison to target. |
| Strategy and planning | A forecast chart next to actuals, so trends are visible. |
Put Yellowfin BI on a screen with Fugo
- 1
Prepare the view
Create or choose a Yellowfin dashboard where the key charts fill the page. Remove anything that needs a click to make sense.
- 2
Connect it to Fugo
Add the Yellowfin BI page in Fugo and enter the sign-in details. Fugo stores the credentials encrypted and signs in on your behalf, and it can generate the one-time codes if the account uses two-factor authentication.
- 3
Crop and position the view
In Design Studio, crop the page to the charts that matter and set the scroll position, so the screen shows data rather than menus and toolbars.
- 4
Set the refresh interval
Choose how often Fugo loads a fresh view, from every few minutes to a few times a day. The screen shows a regularly refreshed snapshot, not a live video feed.
- 5
Add it to a playlist
Put the dashboard in a playlist, set how long it stays visible, and rotate it with other dashboards if the screen is shared. Then assign the playlist to the screens that need it.
Rotate several views on one screen
A single dashboard rarely covers every audience. Fugo lets you rotate multiple dashboards through playlists and control how long each remains visible, so one screen can cycle through finance, sales and operations views.
Keep the loop short enough that a person passing by sees more than one chart. For a view that executives rely on, the executive dashboard displays page shows how it can look.
Frequently asked questions
Can I customize the yellowfin dashboard for my needs?
Is yellowfin BI suitable for small businesses?
How does Fugo handle a dashboard behind a login?
Similar dashboards
Other dashboard tools that work with Fugo

Board
The Board dashboard offers a comprehensive overview of organizational performance, enabling strategic decision-making with real-time data insights.

Metabase
Gain insights into your data with Metabase's interactive dashboard, designed for easy visualization and analysis of key business metrics.

Teradata Vantage
Experience seamless data analytics and insights with the Teradata Vantage dashboard, designed for optimal performance and user-friendly navigation.