

SAP SuccessFactors
2 min read · Updated November 12, 2026
Gain insights into employee performance, recruitment, and HR analytics with the SAP SuccessFactors dashboard for streamlined workforce management.
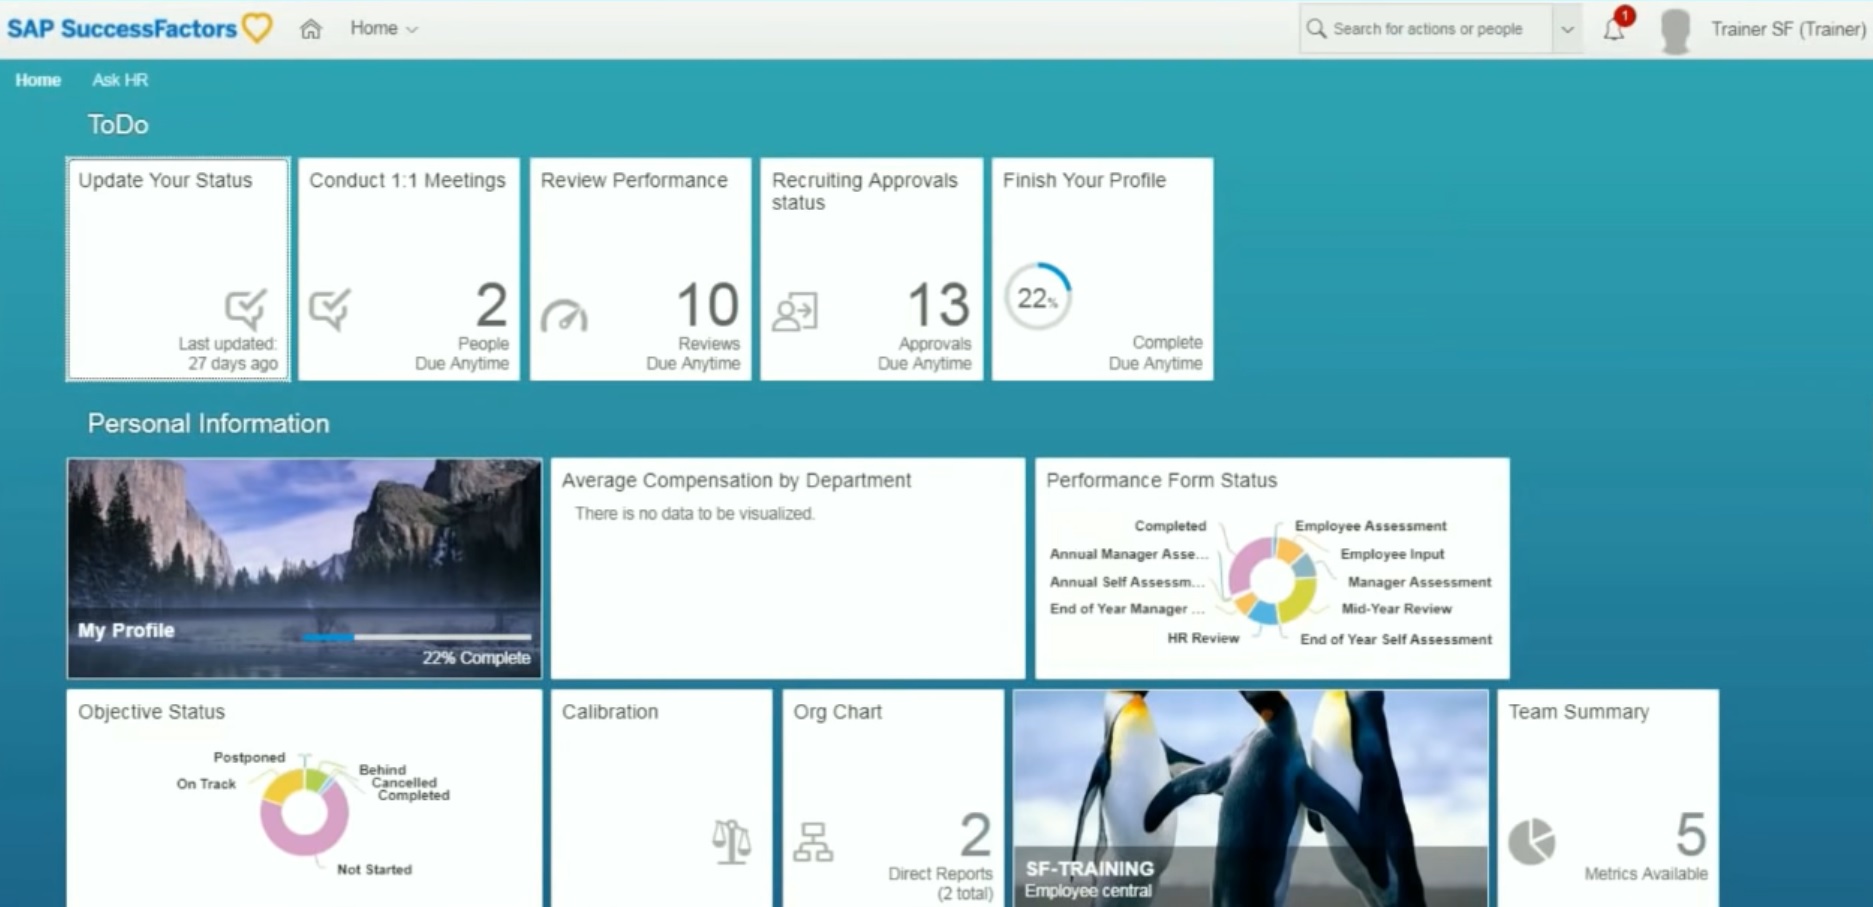
SAP SuccessFactors is a human resources platform with analytics on performance, recruitment and engagement. HR teams can use a screen to keep workforce measures in view, as long as they decide in advance what is safe for a shared space.
Key takeaways
The dashboard covers performance, recruitment, engagement and turnover.
It connects with other SAP modules, which makes consistent HR reporting possible.
Use aggregate numbers only on shared screens.
Fugo can refresh the view on a schedule.
What SuccessFactors analytics tracks
Employee performance
Performance tracking shows how the workforce is progressing against goals.
Recruitment metrics
Hiring pipeline measures help a talent team see where roles are stuck.
Engagement and productivity
Engagement insights show how people feel about work and how that moves over time.
Turnover
Turnover rates and trend identification point to retention risks early.
Customizable widgets and reports
Views can be tailored, so a TV version shows only the HR measures leaders review often.
Who uses it and what to show them
| Audience | What to put on the screen |
|---|---|
| HR professionals | Recruitment progress and turnover trends in aggregate. |
| Managers | Team-level engagement and productivity summaries. |
| Business leaders | Workforce measures tied to organizational goals. |
| Talent teams | Open roles and time-to-fill, with no candidate names. |
Put SAP SuccessFactors on a screen with Fugo
- 1
Create the summary view
Choose widgets that show totals and trends only, and set them up as a separate view from the working HR reports.
- 2
Connect it to Fugo
Add the SAP SuccessFactors page in Fugo and enter the sign-in details. Fugo stores the credentials encrypted and signs in on your behalf, and it can generate the one-time codes if the account uses two-factor authentication.
- 3
Crop and position the view
In Design Studio, crop the page to the charts that matter and set the scroll position, so the screen shows data rather than menus and toolbars.
- 4
Set the refresh interval
Choose how often Fugo loads a fresh view, from every few minutes to a few times a day. The screen shows a regularly refreshed snapshot, not a live video feed.
- 5
Add it to a playlist
Put the dashboard in a playlist, set how long it stays visible, and rotate it with other dashboards if the screen is shared. Then assign the playlist to the screens that need it.
Keep personal data off the wall
Employee and candidate details do not belong on a shared screen. Stick to counts, rates and trends, and place the display in an HR or leadership area. For related layouts, see internal communications signage.
Frequently asked questions
What can I track with the dashboard?
Is the dashboard customizable?
Can it connect with other systems?
Similar dashboards
Other dashboard tools that work with Fugo

Revinate
Revinate's dashboard offers real-time insights and analytics to enhance guest experiences and streamline hotel operations efficiently.

RoomKeyPMS Analytics
Gain insights into your hotel's performance with RoomKeyPMS Analytics, featuring real-time data, occupancy trends, and revenue metrics in one place.

Apache Superset
Explore data insights with Apache Superset's interactive visualizations, offering customizable dashboards for efficient data-driven decision-making.