

RealPage Analytics
2 min read · Updated November 12, 2026
Gain actionable insights into real estate trends and performance metrics with the RealPage Analytics dashboard for informed decision-making.
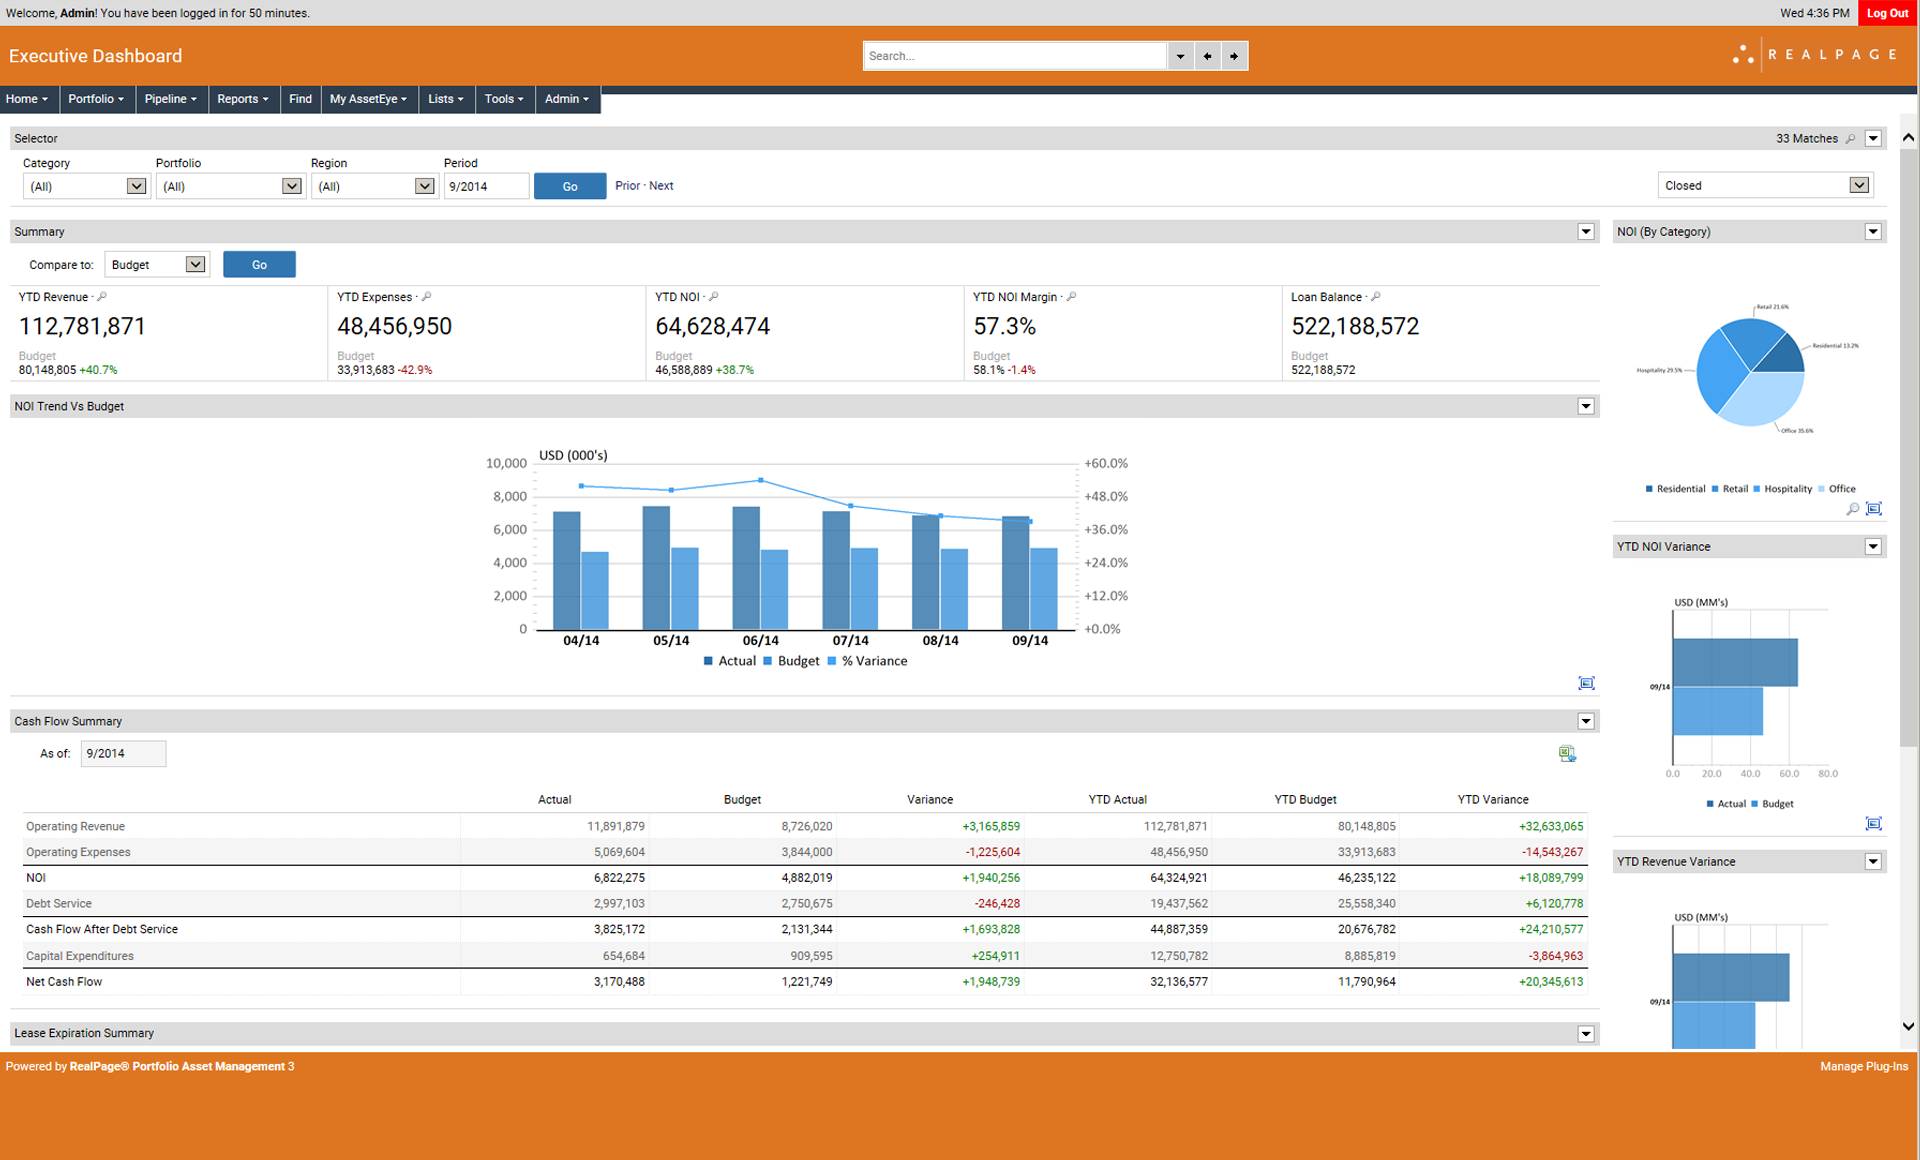
RealPage Analytics gives property managers and investors market trend data and property performance metrics. A screen in a management office keeps occupancy and market indicators visible to the whole team.
Key takeaways
The dashboard covers market trends, property performance and predictive analytics.
Filtering and segmentation help build a portfolio or single-property view.
Sharing capabilities exist in the tool, but a TV offers a simpler way to keep results visible.
Fugo refreshes the view on a schedule you choose.
What RealPage Analytics covers
Market trend updates
Market data shows how rents and demand are moving.
Property performance metrics
In-depth property measures show how each asset is doing.
Predictive analytics
Forecasts support planning for the months ahead.
Filtering and segmentation
Advanced filters narrow views to a property, region or segment.
Customizable reports
Reports can be tailored, so the wall version shows only the key figures.
Who uses it and what to show them
| Team | What to put on the screen |
|---|---|
| Property managers | Performance of their properties against targets. |
| Investors | Portfolio performance and market indicators. |
| Analysts | Trend and segmentation charts that support the weekly review. |
| Consultants and lenders | Market summaries in meeting rooms. |
Put RealPage Analytics on a screen with Fugo
- 1
Build a portfolio view
Choose a report that fits one property or the whole portfolio, and set the date range and segments in advance.
- 2
Connect it to Fugo
Add the RealPage Analytics page in Fugo and enter the sign-in details. Fugo stores the credentials encrypted and signs in on your behalf, and it can generate the one-time codes if the account uses two-factor authentication.
- 3
Crop and position the view
In Design Studio, crop the page to the charts that matter and set the scroll position, so the screen shows data rather than menus and toolbars.
- 4
Set the refresh interval
Choose how often Fugo loads a fresh view, from every few minutes to a few times a day. The screen shows a regularly refreshed snapshot, not a live video feed.
- 5
Add it to a playlist
Put the dashboard in a playlist, set how long it stays visible, and rotate it with other dashboards if the screen is shared. Then assign the playlist to the screens that need it.
Rotate between portfolio and property
Managers of several properties often need both an overview and a closer look. Fugo playlists let one screen rotate between dashboards, with a set time for each, so one screen can alternate between the portfolio and a single property.
For layout ideas, see real estate signage and digital information boards.
Frequently asked questions
How often is the data updated?
Can I export data?
Is there a mobile version?
Similar dashboards
Other dashboard tools that work with Fugo

Impact Dashboard
The Impact Dashboard provides real-time insights into organizational performance, highlighting key metrics and trends to drive strategic decision-making.

MLS Analytics (Multiple Listing Service)
Explore comprehensive real estate data insights with the MLS Analytics dashboard, offering detailed property trends and market analysis for informed decisions.

Hotjar
Gain insights into user behavior with Hotjar's dashboard, featuring heatmaps, session recordings, and feedback tools for data-driven decisions.