

Loading dashboard information...
Loading dashboard information...
The Impact Dashboard provides real-time insights into organizational performance, highlighting key metrics and trends to drive strategic decision-making.
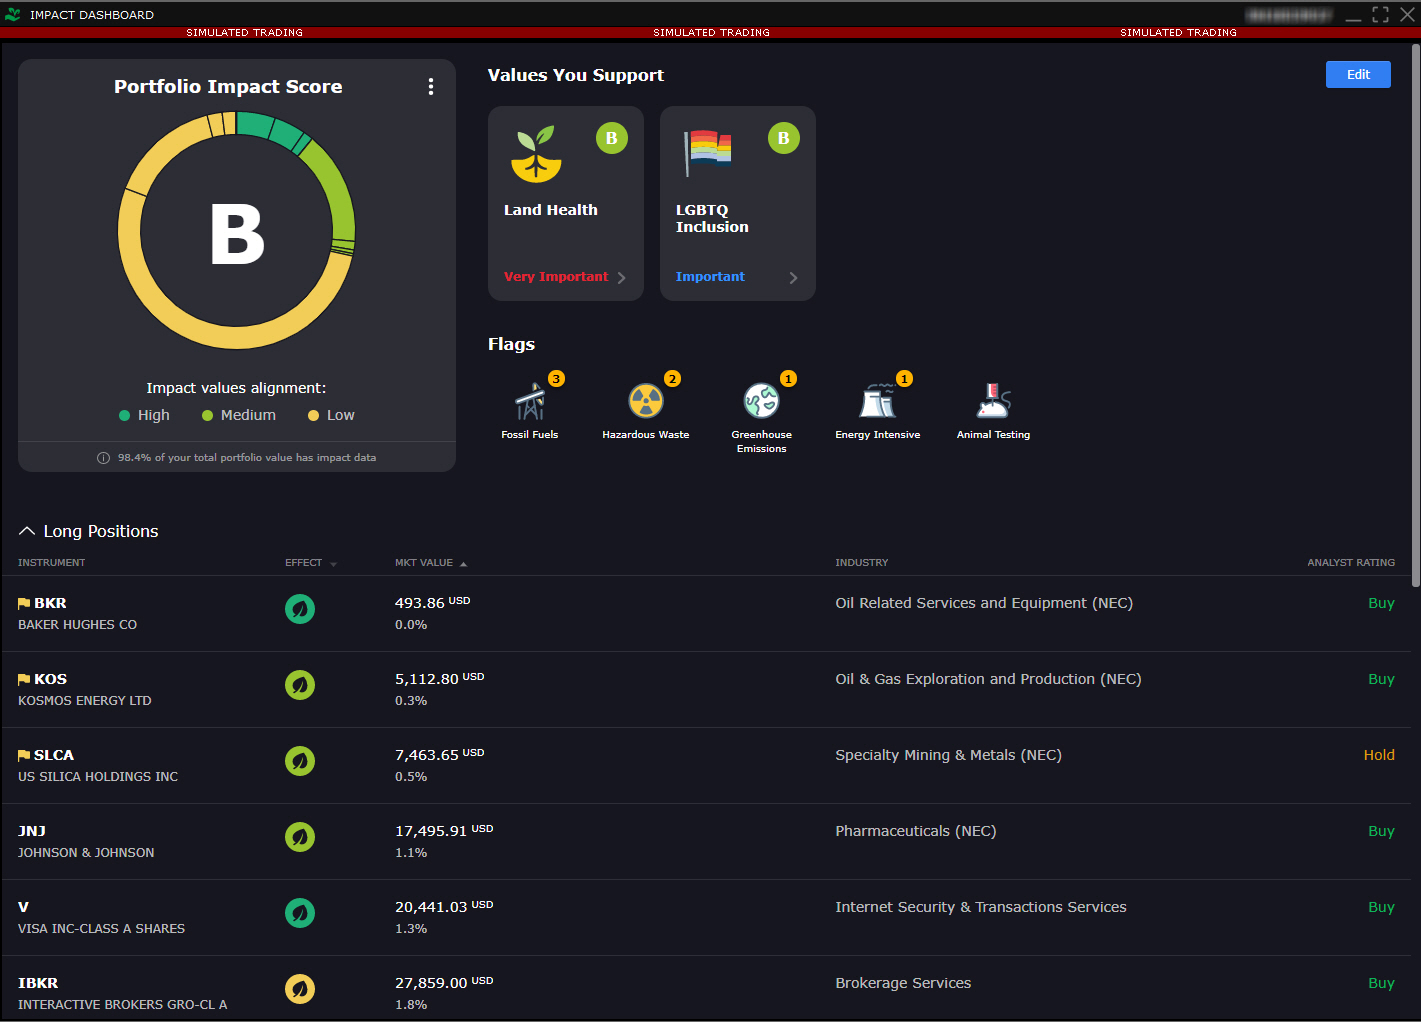
The Performance Metrics Overview section of the Impact Dashboard offers a comprehensive analysis of key performance indicators (KPIs) across various departments. It visualizes data trends over time, enabling users to identify strengths and areas for improvement. By integrating data from multiple sources, this section provides a holistic view of organizational health, facilitating informed decision-making and strategic planning.

The Impact Dashboard is designed for executives, managers, and analysts who need to monitor and evaluate organizational performance. It is particularly beneficial for decision-makers who require a comprehensive understanding of how different departments contribute to overall goals. Additionally, it serves as a valuable tool for data analysts who need to interpret complex data sets and provide actionable insights to stakeholders. Whether you are in finance, operations, marketing, or any other department, the Impact Dashboard offers the insights needed to drive success.
Other dashboard tools that work with Fugo
Visualize and analyze nonprofit data effortlessly with Datawrapper for Nonprofits. Enhance decision-making with interactive charts and maps.

The Fluxx dashboard provides a comprehensive overview of grant management processes, enhancing efficiency and collaboration for organizations.

Gain insights into donor behavior, fundraising trends, and engagement metrics with the Kindful Analytics dashboard to enhance your nonprofit's impact.