

Loading dashboard information...
Loading dashboard information...
Explore interactive data visualizations and analytics with the R Shiny dashboard, designed for real-time insights and user-friendly data exploration.
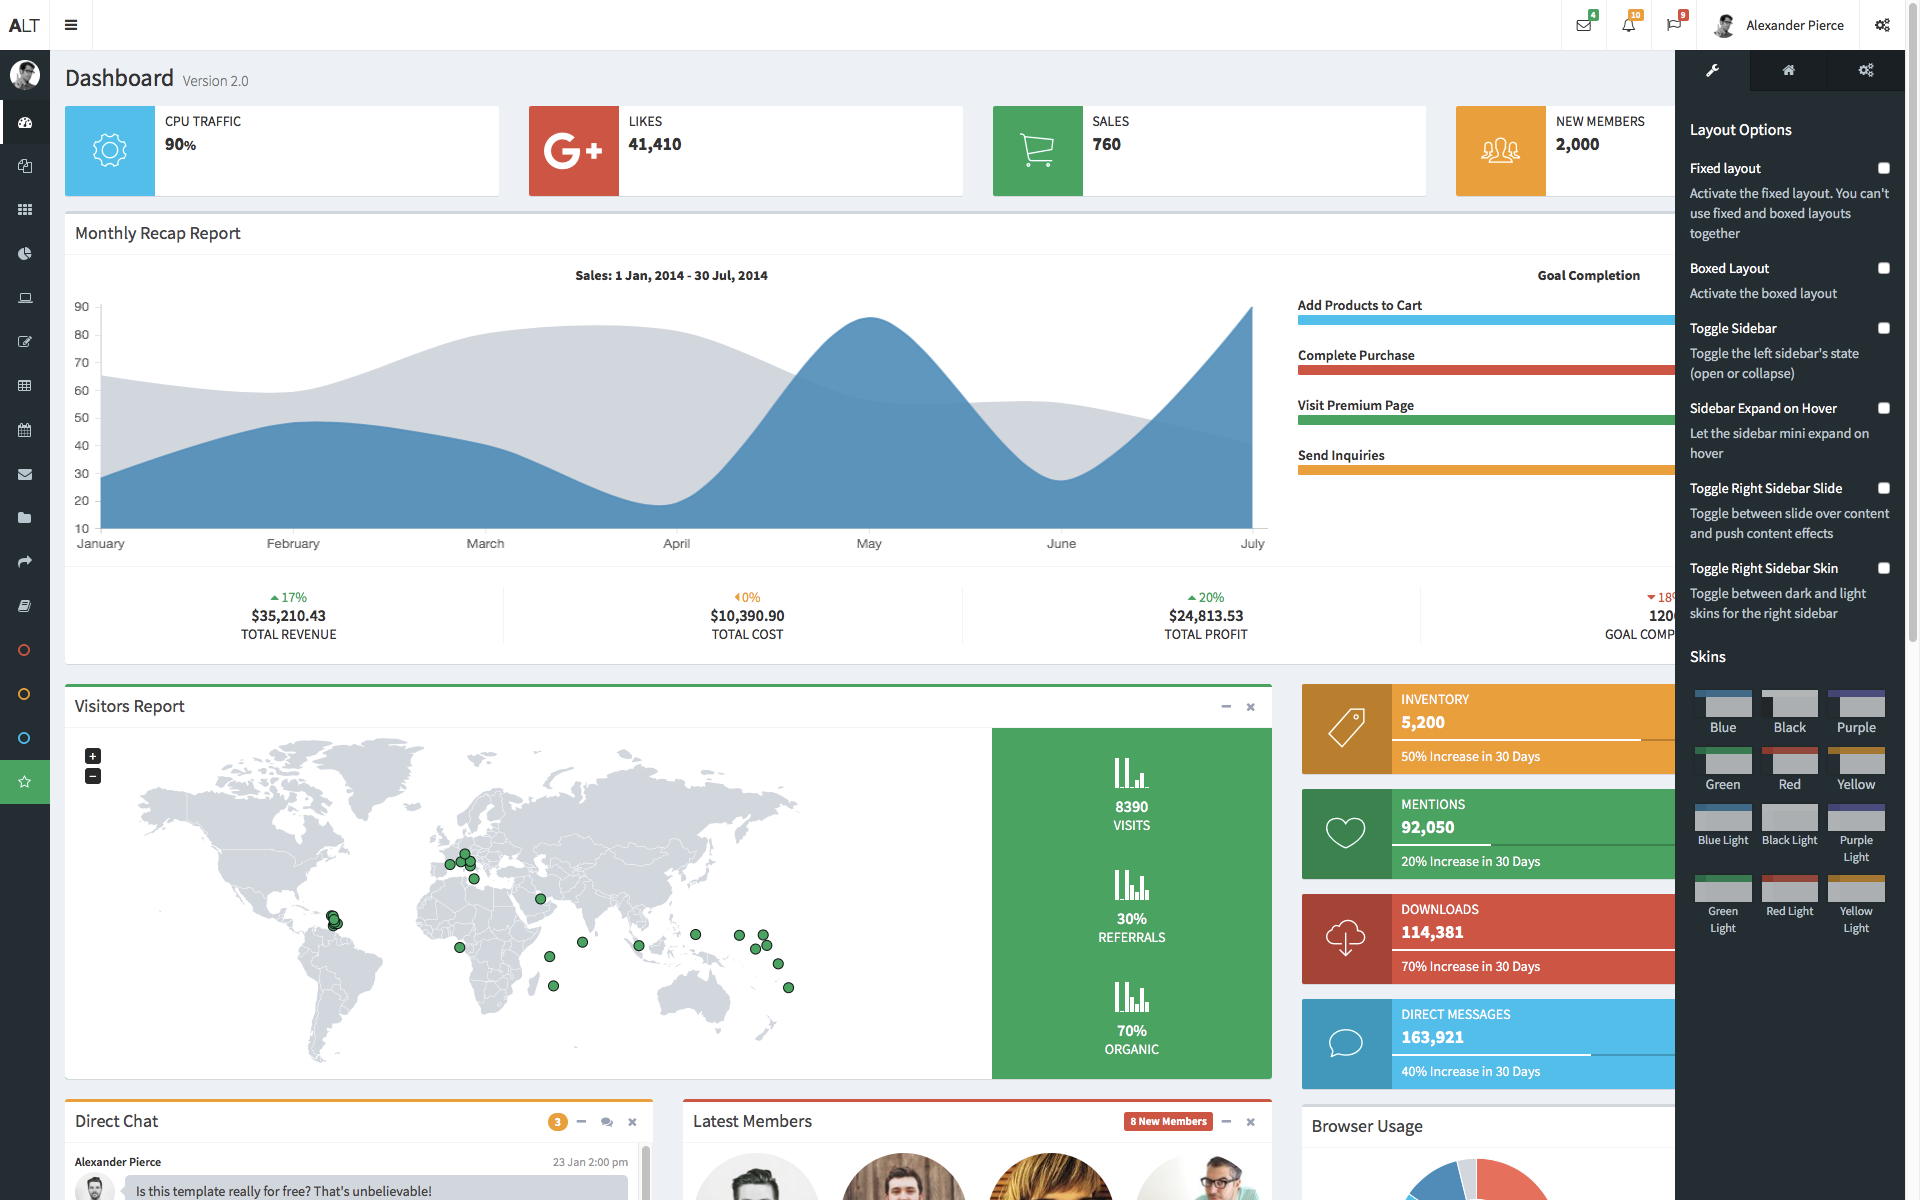
The R Shiny dashboard offers a dynamic platform for users to interact with data in real-time. It allows users to filter, sort, and visualize data through intuitive controls and responsive graphics. This interactivity enhances the ability to uncover insights and make data-driven decisions efficiently. The dashboard is designed to handle complex datasets, providing a seamless experience for users to explore and analyze data without needing advanced programming skills.

The R Shiny dashboard is ideal for data analysts, business intelligence professionals, and researchers who require a flexible and interactive platform for data visualization and analysis. It is also beneficial for educators and students in data science fields, providing a practical tool for learning and teaching data analysis concepts. Organizations looking to empower their teams with data-driven decision-making capabilities will find this dashboard particularly useful.
Other dashboard tools that work with Fugo

Explore interactive visualizations and data insights with the Plotly dashboard, designed for dynamic data analysis and real-time decision-making.

Interactive Plotly Dash dashboard for real-time data visualization and analysis, offering dynamic charts and user-friendly interface for insightful decisions.

Explore and visualize complex data effortlessly with RAWgraphs, a versatile dashboard designed for creating custom, insightful visualizations.