

Loading dashboard information...
Loading dashboard information...
This TIBCO Spotfire dashboard provides real-time data visualization and analytics to enhance decision-making and operational efficiency.
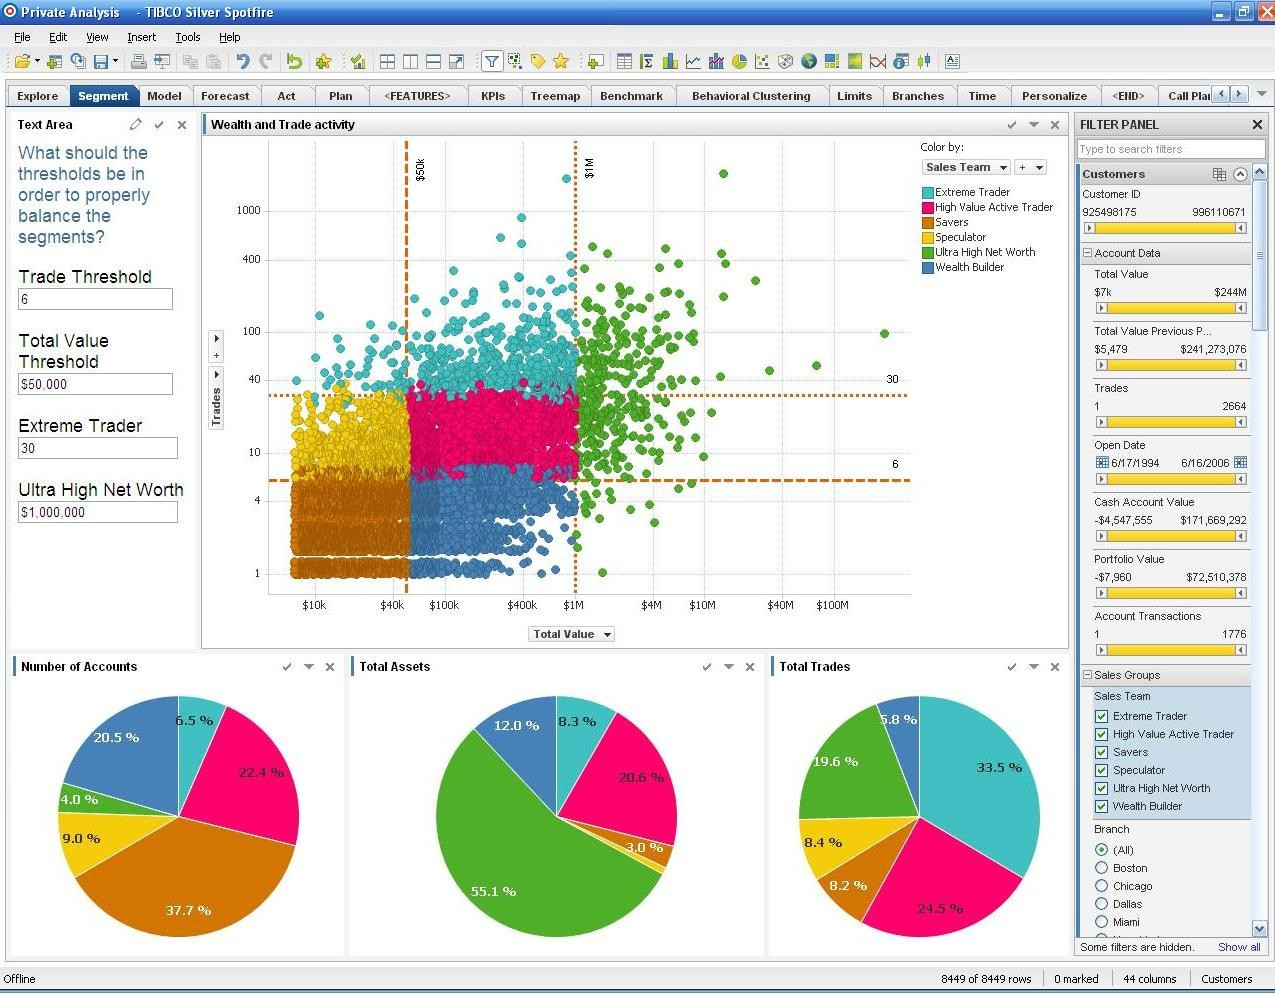
The TIBCO Spotfire dashboard offers a comprehensive platform for data visualization and analytics. It allows users to interact with data in real-time, providing insights through intuitive charts, graphs, and maps. This enables businesses to identify trends, patterns, and anomalies quickly. The dashboard is designed to handle large datasets efficiently, ensuring that users can explore and analyze data without performance issues. With its user-friendly interface, even non-technical users can create and customize visualizations to suit their needs.

This TIBCO Spotfire dashboard is ideal for data analysts, business intelligence professionals, and decision-makers across various industries. It caters to organizations that require robust data analysis capabilities to drive strategic decisions. Whether you're in finance, healthcare, manufacturing, or retail, this dashboard can help you leverage data to improve operational efficiency and gain a competitive edge. It's also suitable for IT teams looking to provide self-service analytics solutions to their business users.
Other dashboard tools that work with Fugo

Explore interactive data visualizations and insights with this Tableau dashboard, designed for efficient data analysis and decision-making.

Gain real-time insights and make data-driven decisions with the ThoughtSpot dashboard, featuring intuitive search and AI-driven analytics.

Experience data-driven insights with Yellowfin BI's interactive dashboard, designed for real-time analytics and enhanced decision-making efficiency.