

Loading dashboard information...
Loading dashboard information...
Monitor and optimize your application's performance with real-time insights and analytics using the New Relic dashboard.
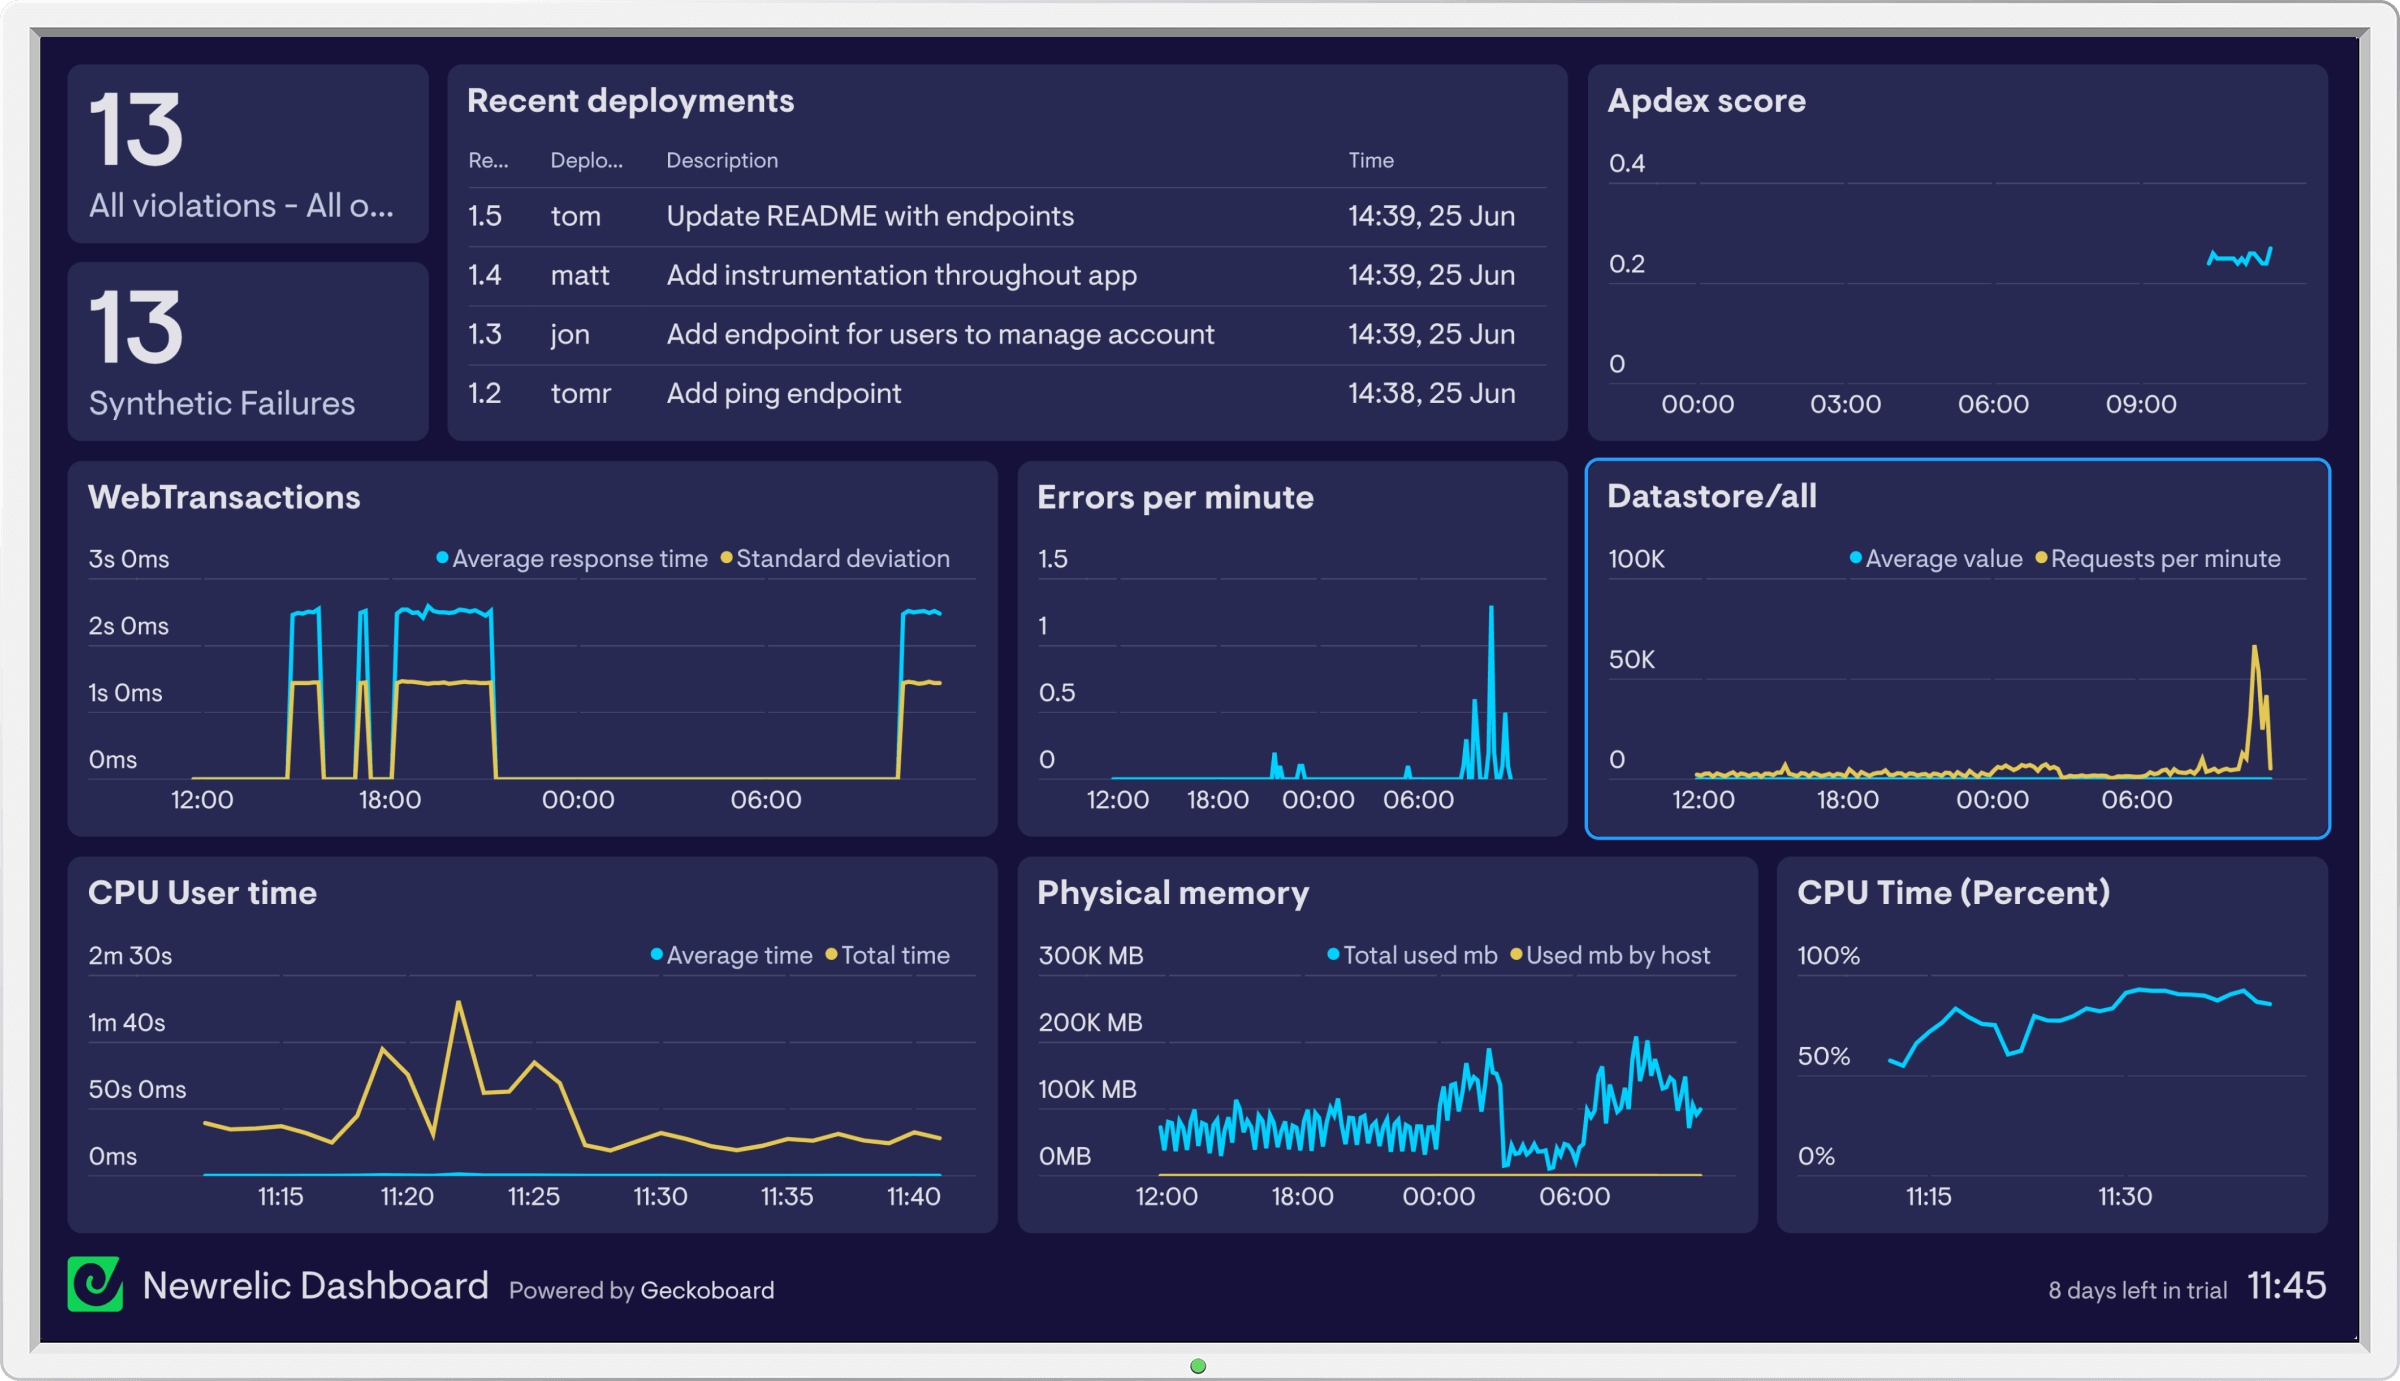
The New Relic dashboard provides comprehensive performance monitoring and analysis tools for your applications. It allows you to track key performance metrics, identify bottlenecks, and gain insights into user interactions. With real-time data visualization, you can quickly diagnose issues and optimize your application's performance to ensure a seamless user experience.

The New Relic dashboard is ideal for developers, IT operations teams, and business analysts who need to ensure optimal performance of their applications. It is particularly beneficial for organizations that require real-time insights into application health, user experience, and infrastructure performance. Whether you're managing a small startup or a large enterprise, this dashboard provides the tools necessary to maintain high performance standards and improve operational efficiency.
Other dashboard tools that work with Fugo

Gain insights into your log data with Loggly's intuitive dashboard, offering real-time analytics, visualization, and monitoring for enhanced troubleshooting.
Monitor and manage your IT infrastructure with the Nagios dashboard, providing real-time insights and alerts for optimal system performance.
Monitor and manage incidents efficiently with Opsgenie's intuitive dashboard, offering real-time alerts, analytics, and seamless team collaboration.