

IT dashboard displays
Put dashboards from Datadog, Grafana, and New Relic on shared screens. Incidents, system health, and degradation become visible the moment they matter instead of staying buried in browser tabs nobody has open.
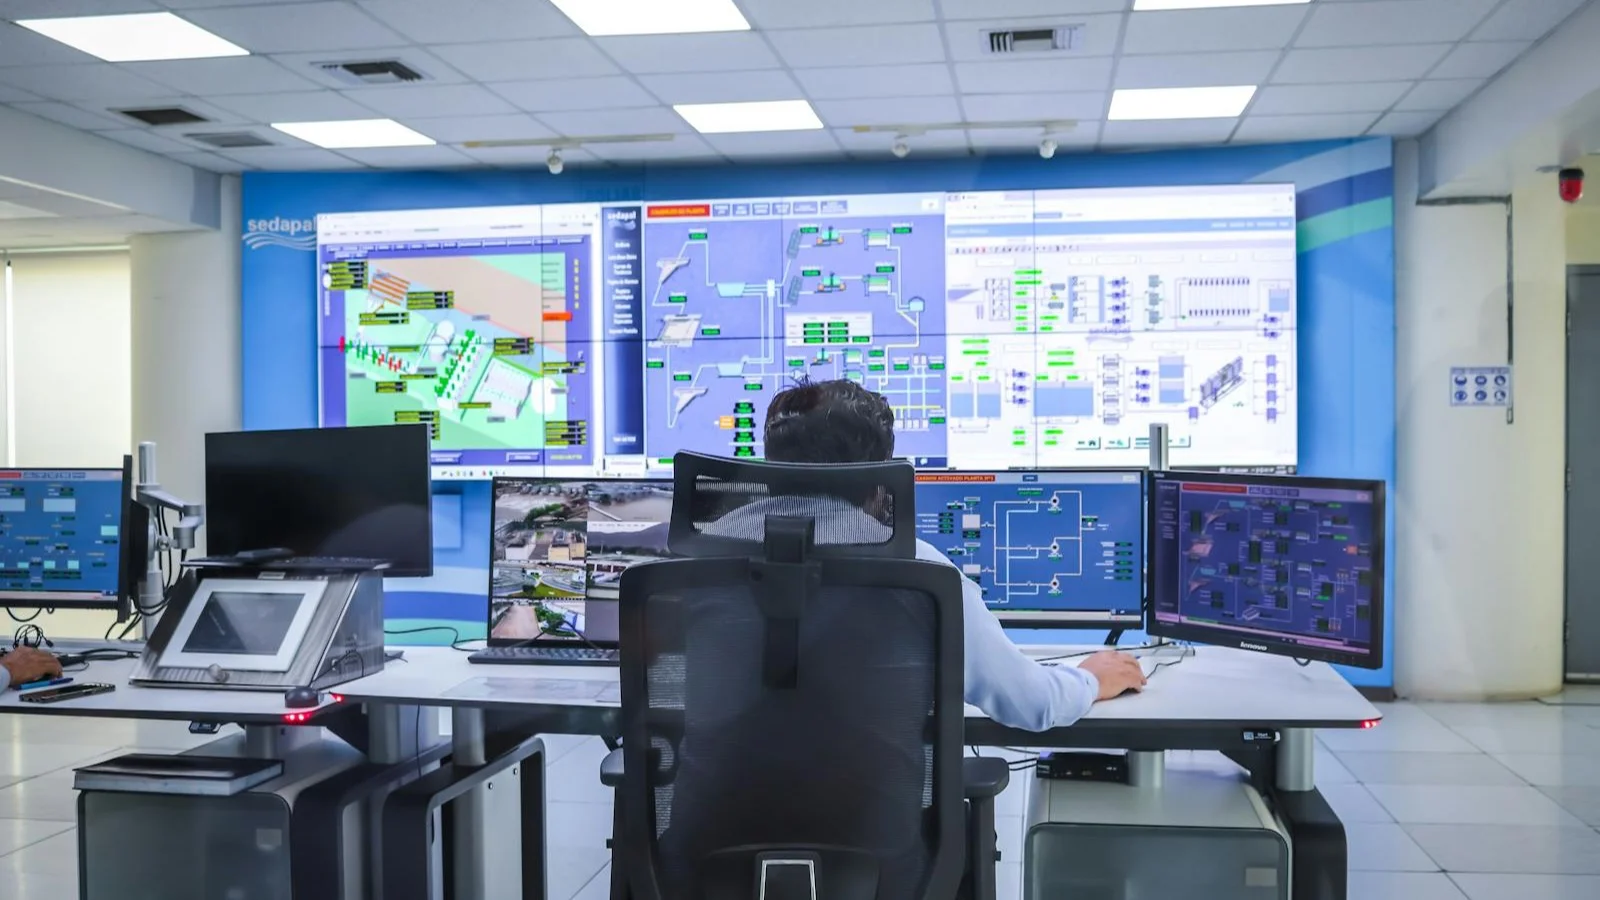
Why IT teams put dashboards on screens
Make incidents visible without paging everyone
When a P1 hits, the team sees it on screen before Slack lights up. Engineers walking past the NOC or glancing at a hallway display get context immediately without needing to be on-call.
Eliminate "is anyone looking at this" during outages
A shared screen with live incident status removes ambiguity about who is aware and who is responding. Less time spent confirming awareness, more time spent fixing.
Keep on-call and engineering aligned on current status
The on-call engineer and the rest of the team see the same dashboard. No divergence between what monitoring shows and what people assume is happening.
Surface degradation before it becomes an outage
Trends that are easy to ignore in a tab are harder to ignore on a wall. Latency creep, error rate upticks, and disk fill patterns stay visible to anyone in the room.
Support war room displays during major incidents
During a bridge call, put the relevant Grafana or Datadog dashboard on the room screen. Everyone in the war room works from the same data without sharing screens over video.
Track SLA compliance where the team can see it
Uptime targets and SLA status belong on a screen, not in a weekly email. When compliance is visible, the team catches drift early instead of discovering it in a monthly report.
What IT teams show on screens
System health and service status
Live service maps and health checks showing green, yellow, and red states across your infrastructure.
Active incidents and alert feeds
Current open incidents with severity, owner, and duration pulled from your alerting platform.
Uptime and SLA compliance
Rolling uptime percentages and SLA targets for critical services over the current period.
Deployment status and release pipelines
CI/CD pipeline status, recent deployments, and rollback indicators from your build system.
Infrastructure utilization and capacity
CPU, memory, disk, and network utilization across clusters, regions, or environments.
On-call schedules and escalation paths
Current on-call rotation and escalation chain so anyone can see who to reach.
Fugo features for IT displays
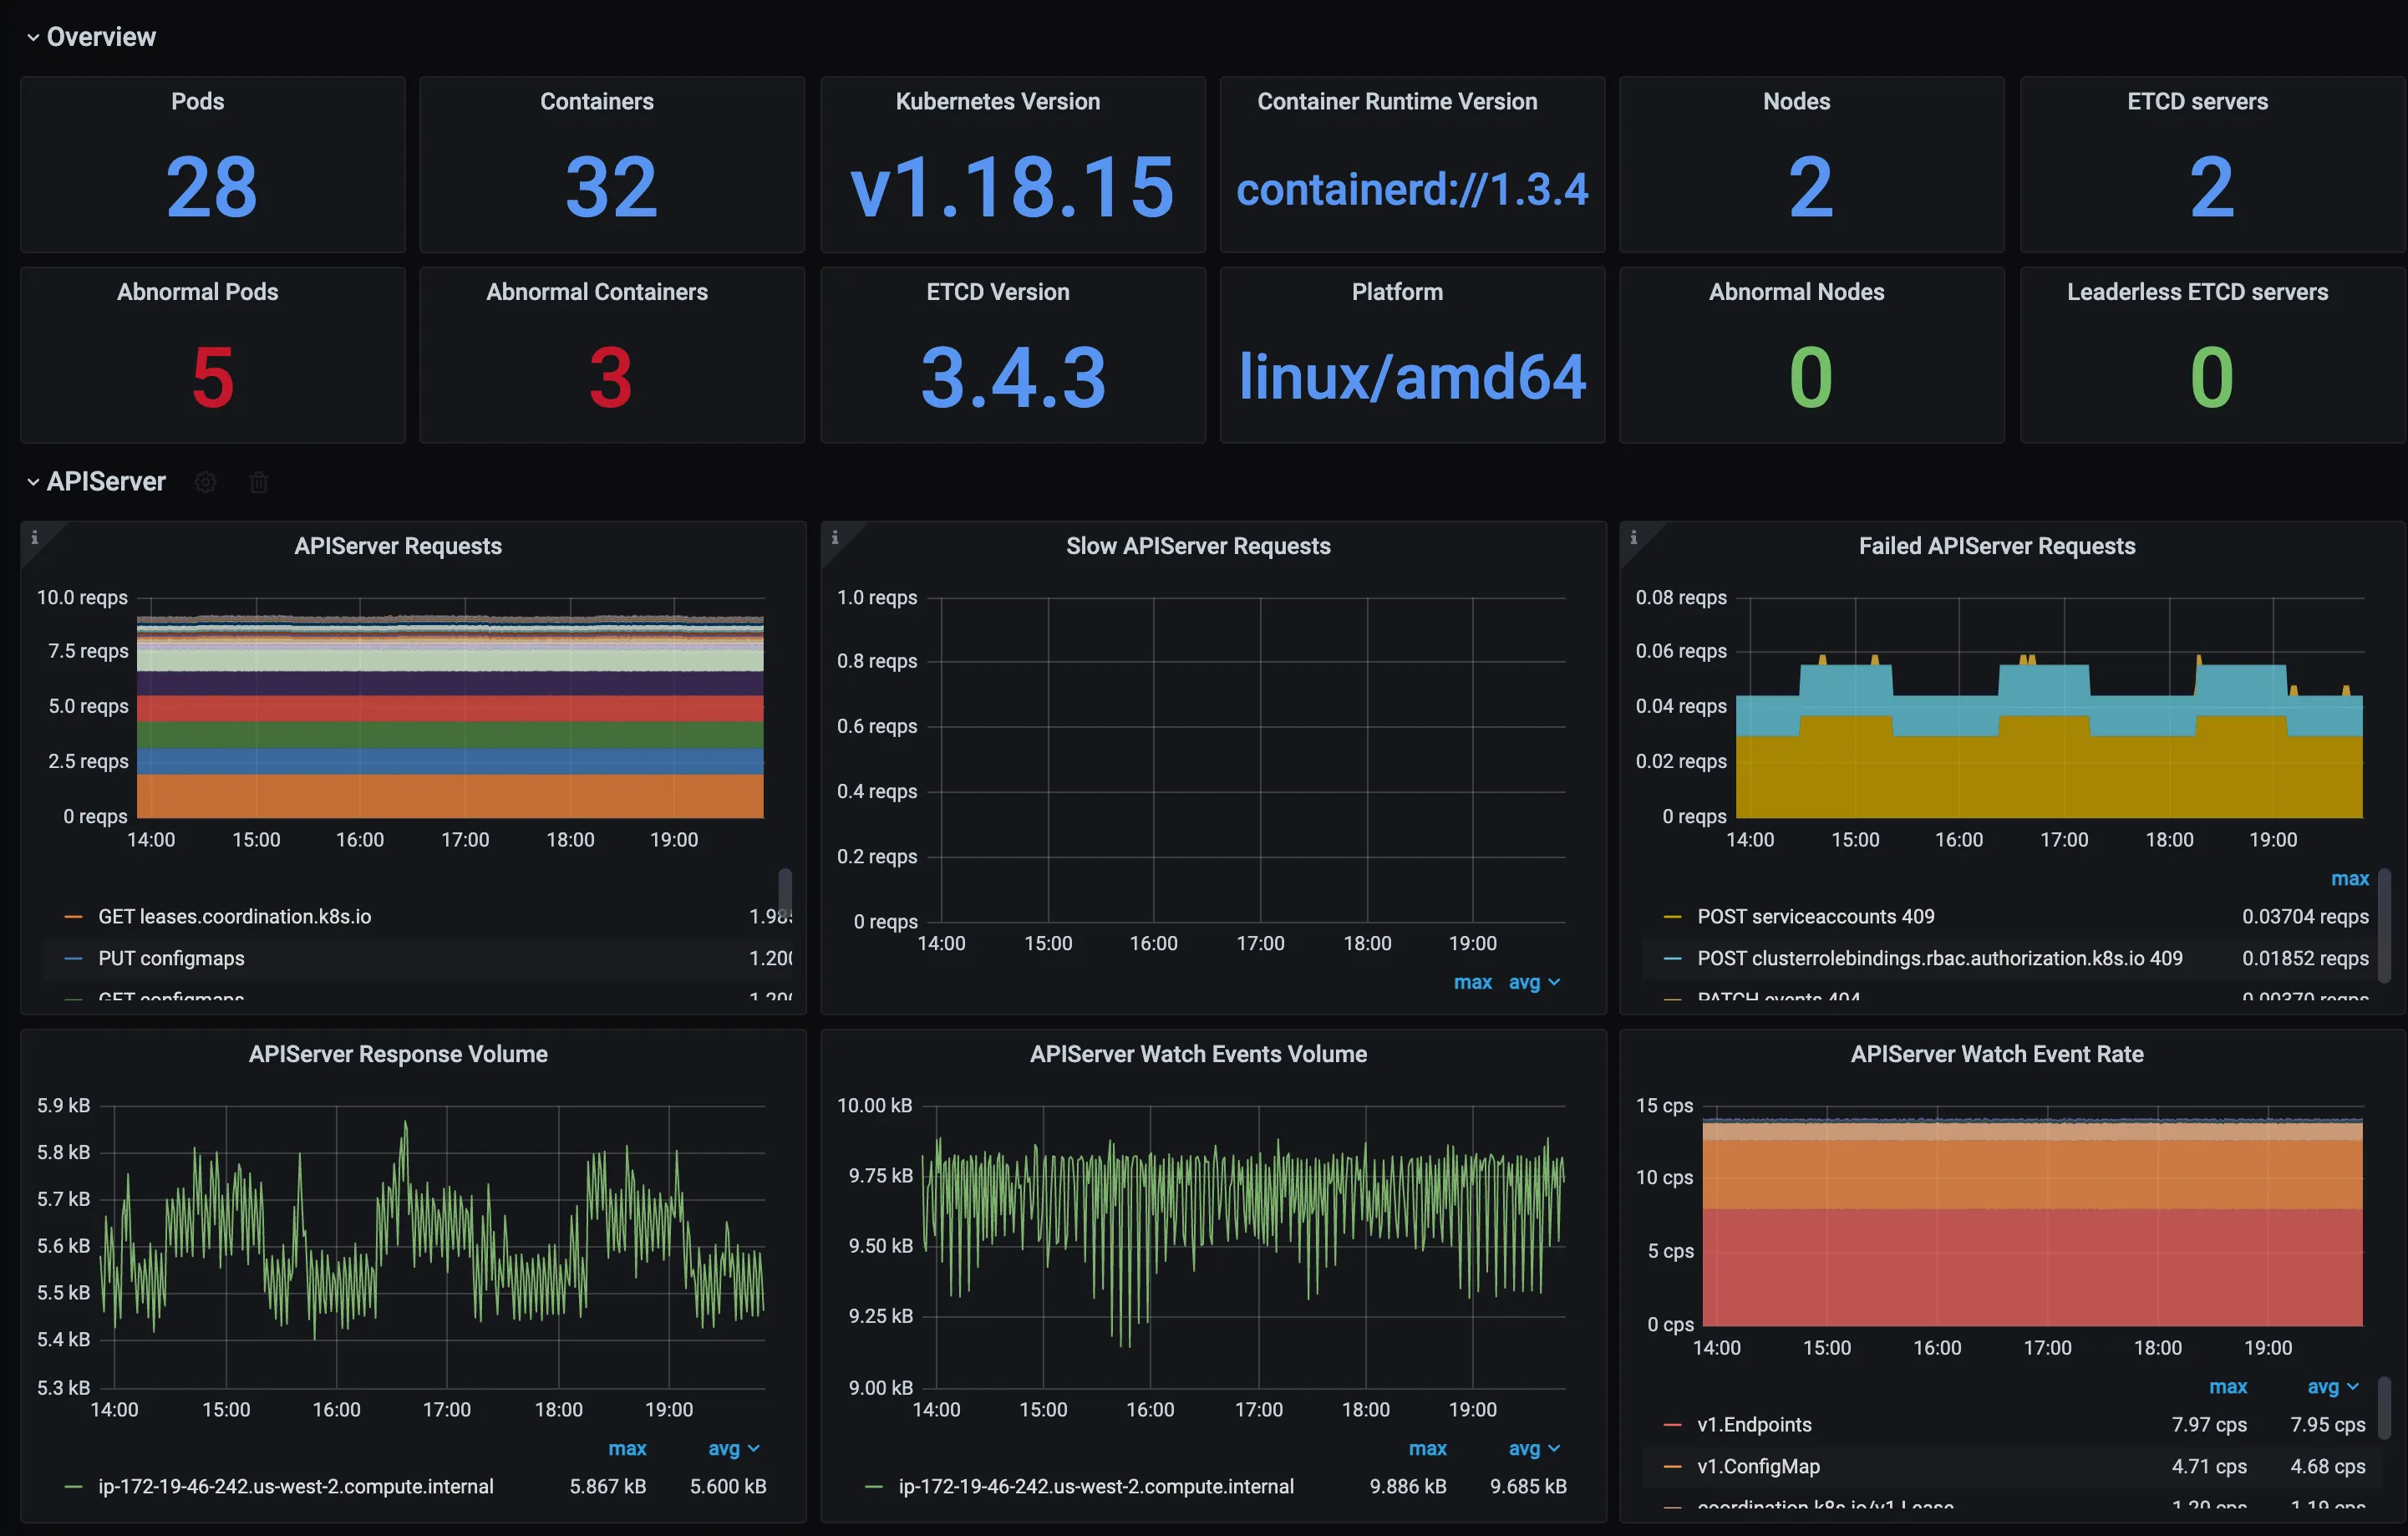
Grafana dashboards
Display any Grafana dashboard on screen using snapshot URLs or authenticated embed. Panels refresh on the interval you configure in Fugo.
Explore Grafana dashboards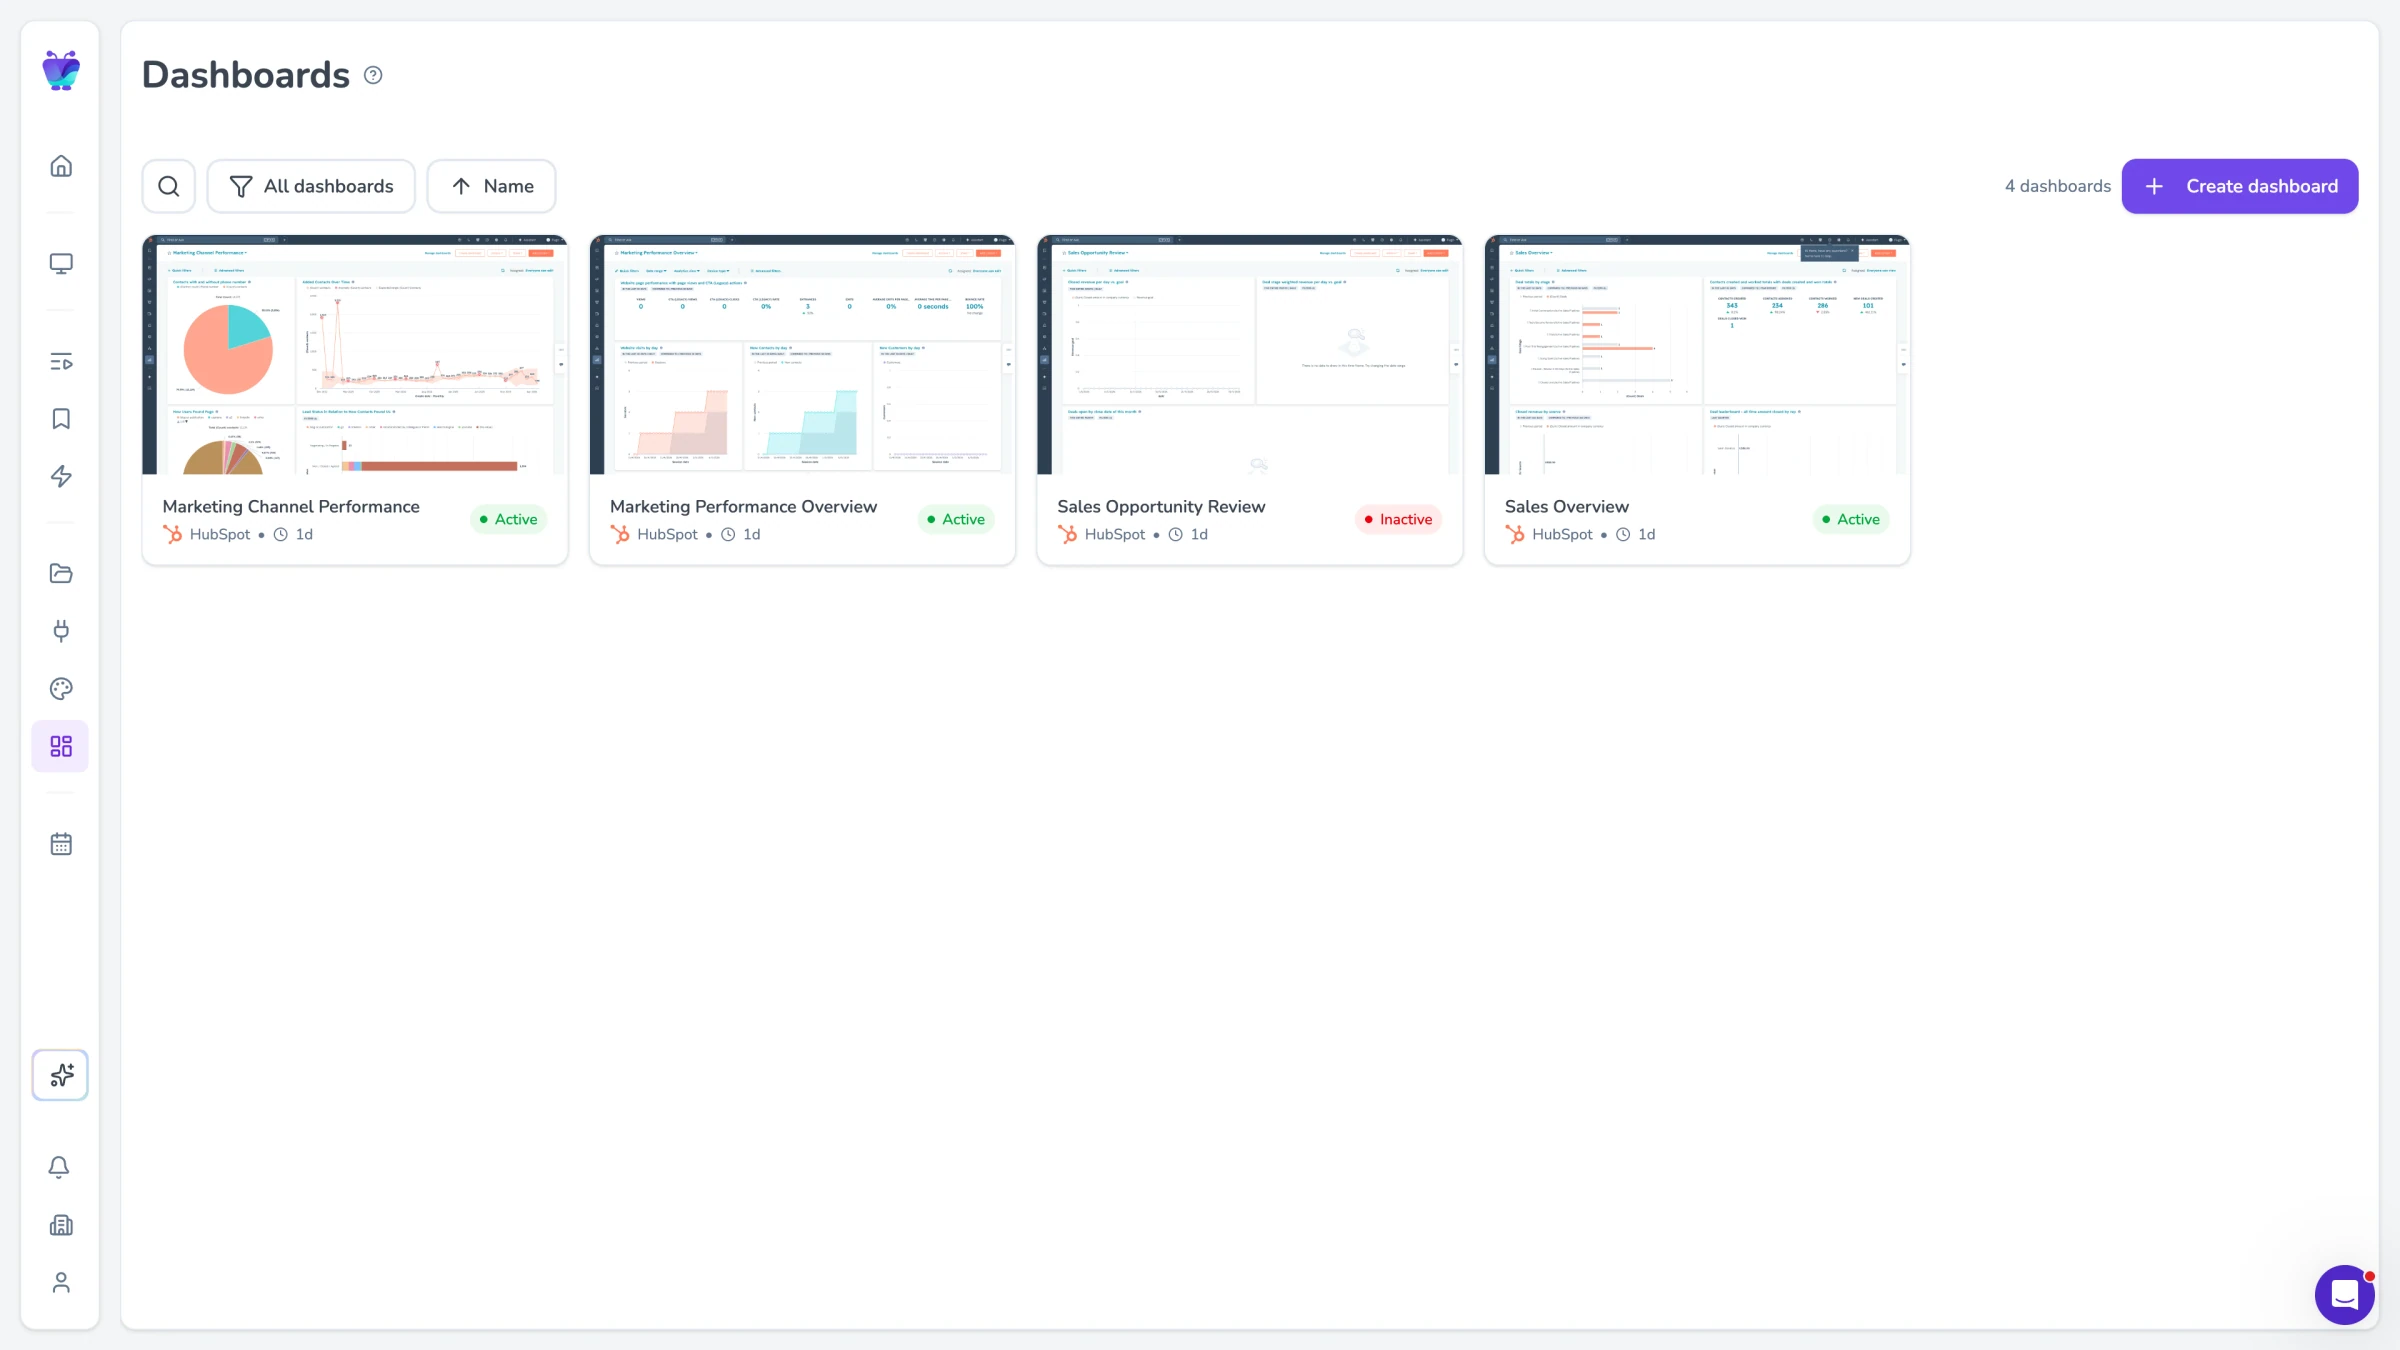
Dashboard integrations
Connect Datadog, New Relic, Grafana, Splunk, and other monitoring tools. Fugo renders their dashboards on screen without needing a dedicated browser machine.
Explore TV dashboards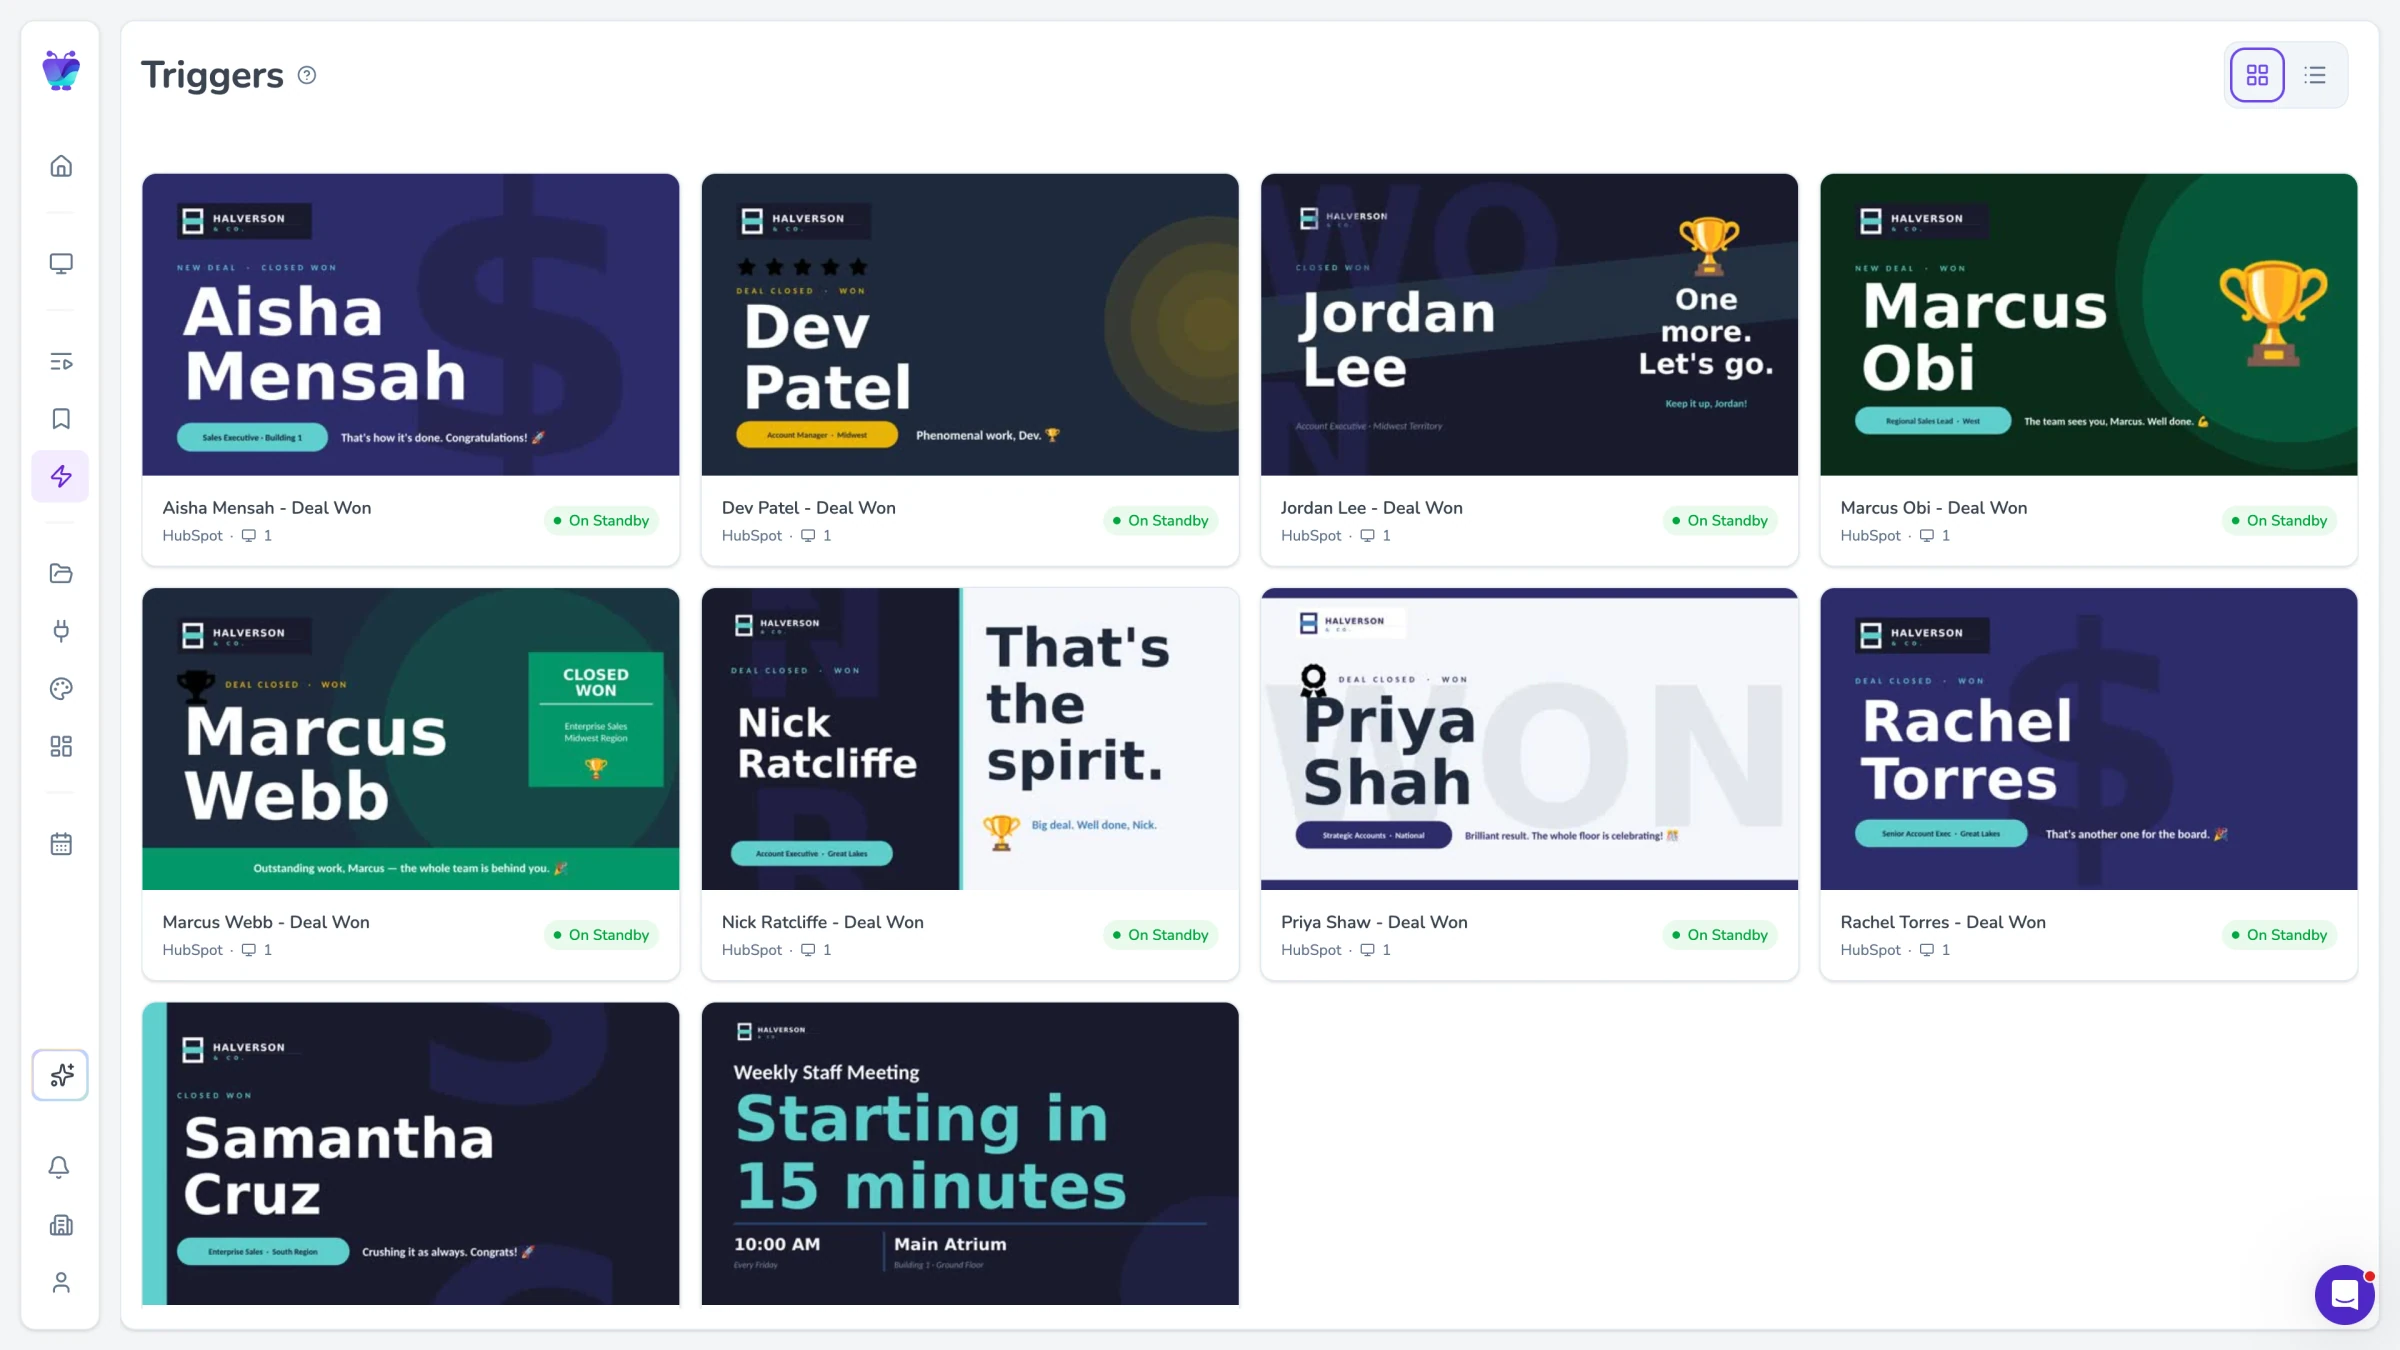
Content triggers
Automatically switch screen content when an incident fires. Use webhook triggers to push a specific dashboard or alert view to screens during a P1.
See content triggers
Screen mirroring
Mirror a live browser session to screens for ad hoc debugging or war room use. Useful when the dashboard you need is not pre-configured in a playlist.
See screen mirroring