

Loading dashboard information...
Loading dashboard information...
The Kubernetes Dashboard provides a web-based UI to manage, deploy, and troubleshoot Kubernetes clusters efficiently and effectively.
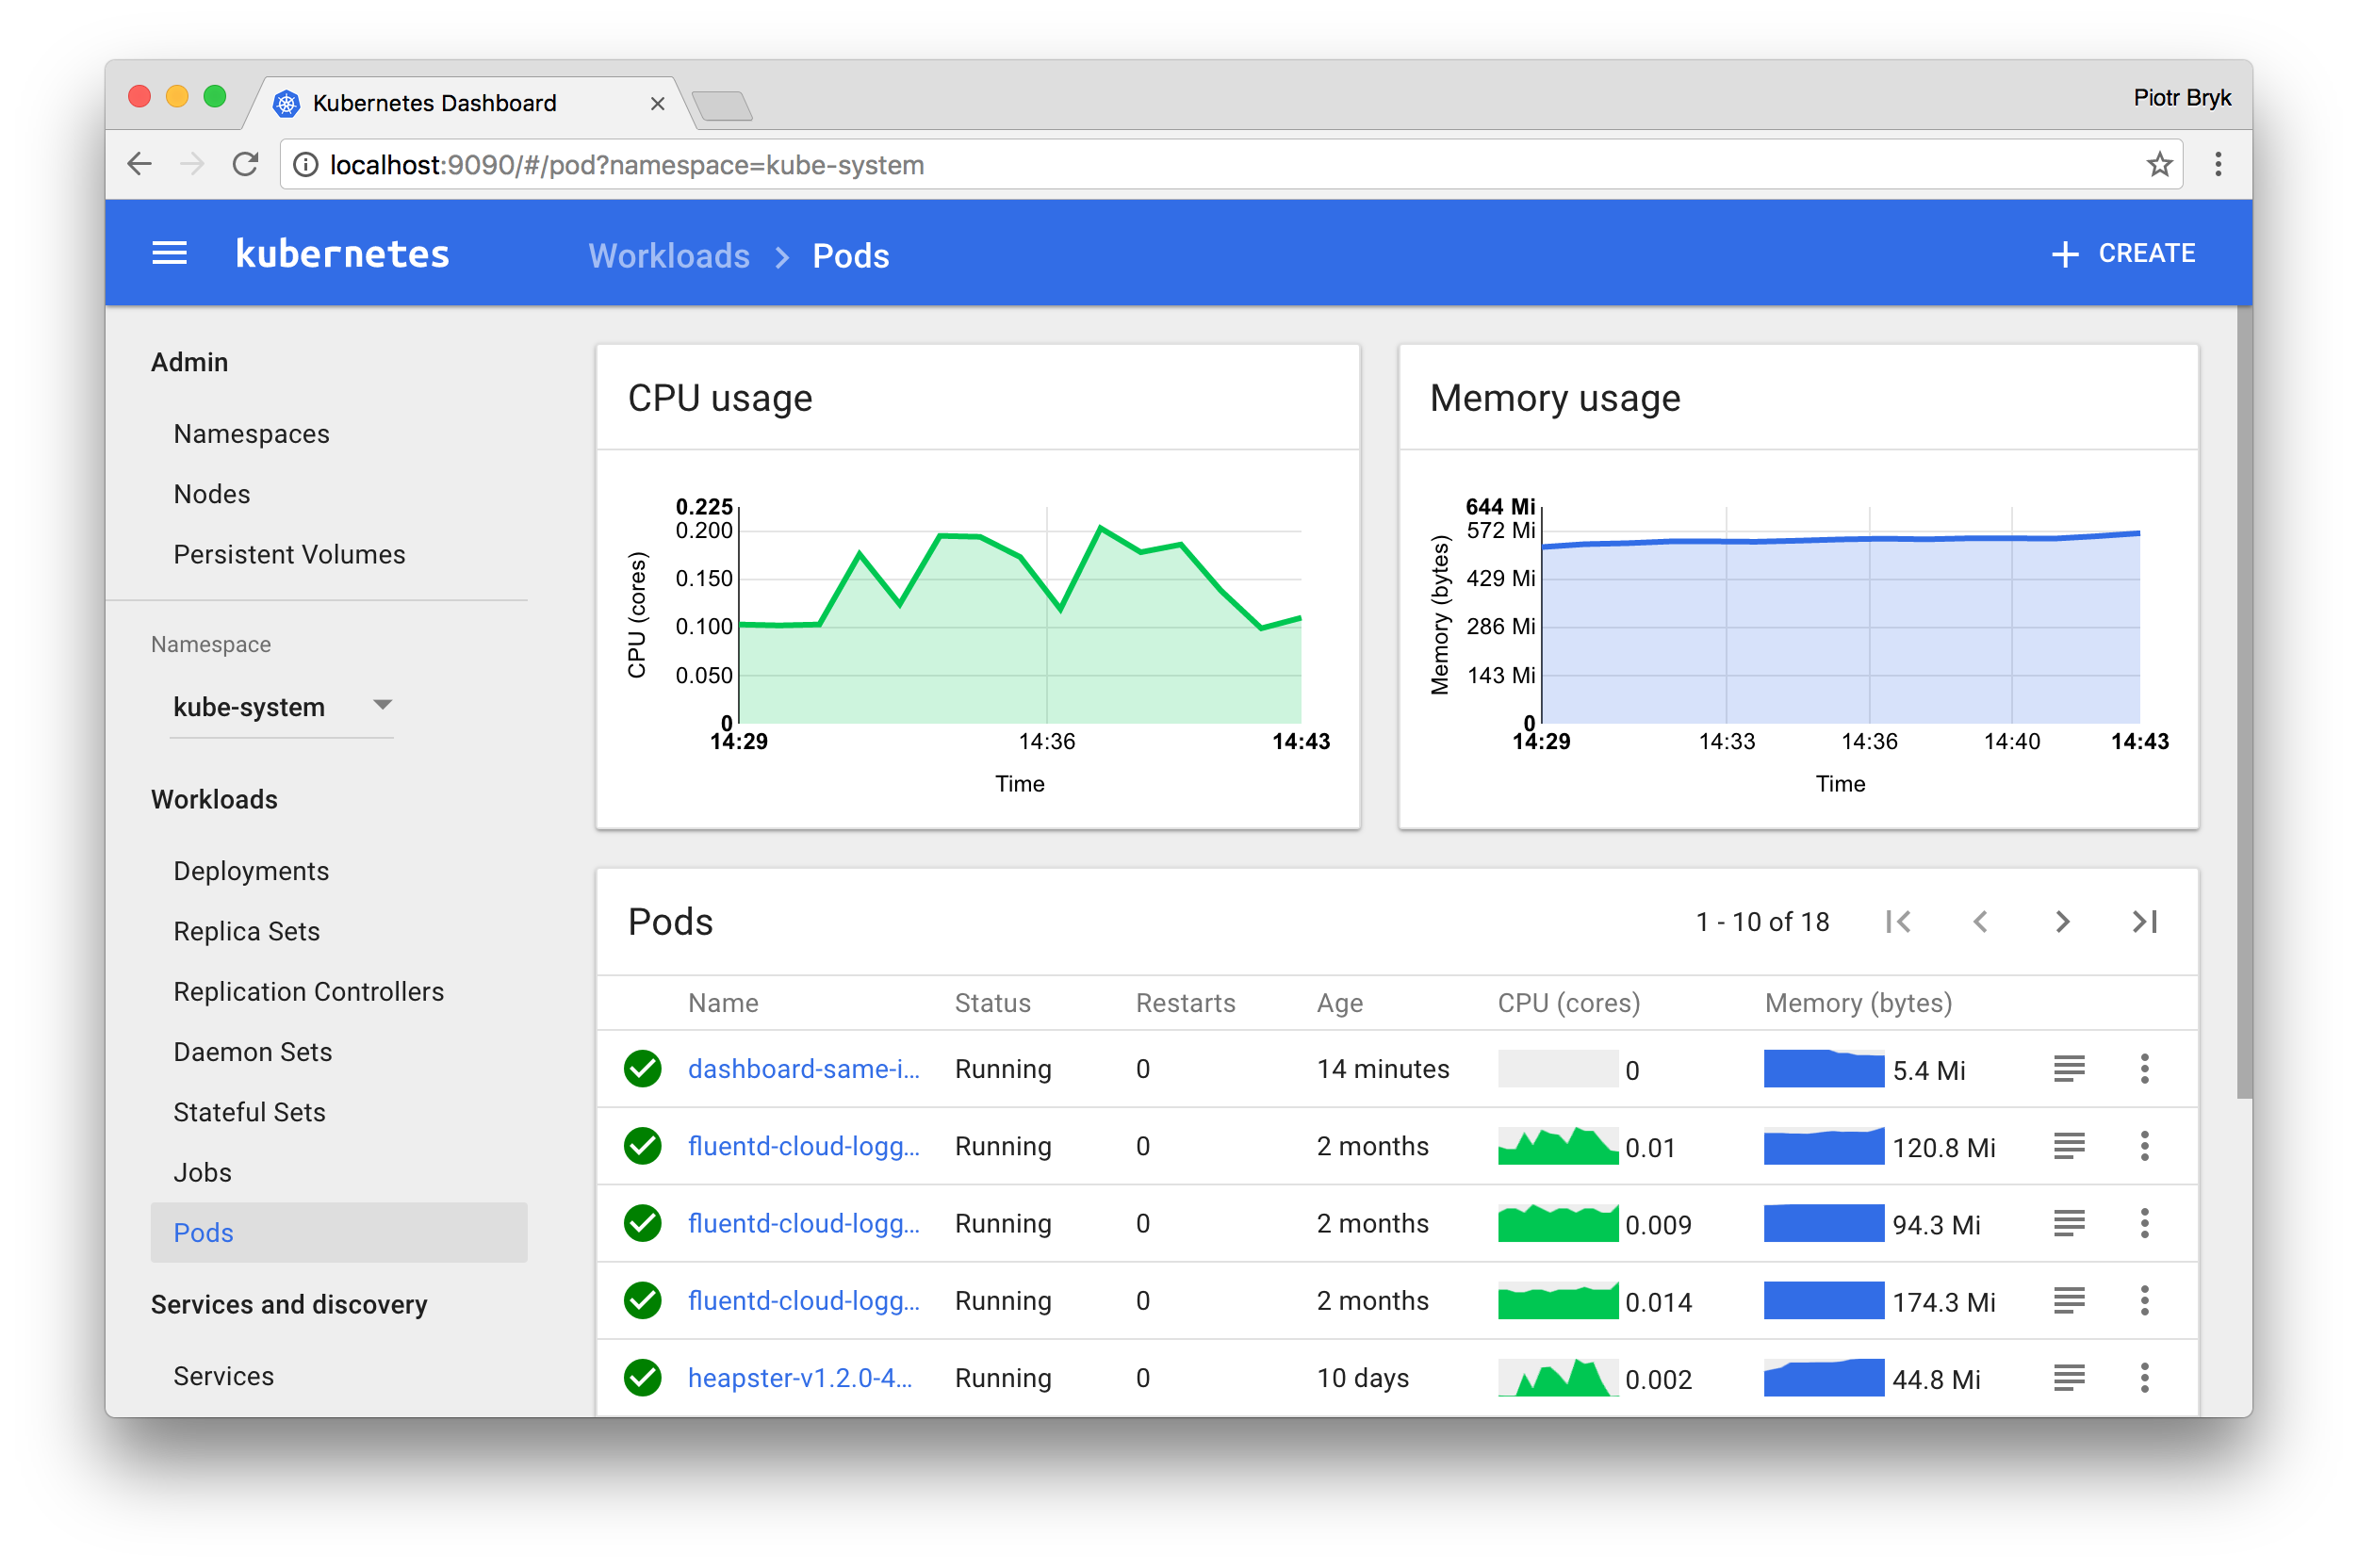
The Kubernetes Dashboard offers a comprehensive interface for managing your Kubernetes clusters. It allows users to deploy containerized applications, monitor resource usage, and troubleshoot issues within the cluster. With real-time insights, users can easily view the status of their applications, nodes, and overall cluster health. The dashboard simplifies complex tasks such as scaling applications, rolling out updates, and managing cluster resources, making it an essential tool for Kubernetes administrators.
Get a real-time view of your cluster's health and performance metrics.
Easily create, update, and delete Kubernetes resources like Deployments, Pods, and Services.
Manage resources across multiple namespaces for better organization and isolation.
Secure your dashboard with role-based access control (RBAC) to manage user permissions.
Access detailed logs and troubleshoot application issues directly from the dashboard.
Monitor CPU and memory usage to optimize resource allocation and performance.
View and manage workloads, including Deployments, StatefulSets, and DaemonSets.
Easily discover and manage services running within the cluster.
Extend the Kubernetes API with custom resources and manage them through the dashboard.

The Kubernetes Dashboard is designed for DevOps engineers, system administrators, and developers who manage Kubernetes clusters. It is particularly useful for those who require a visual interface to oversee cluster operations, deploy applications, and monitor performance. Whether you are new to Kubernetes or an experienced user, the dashboard provides the tools necessary to streamline cluster management and enhance operational efficiency.
Other dashboard tools that work with Fugo

Monitor and analyze real-time data with Grafana's interactive dashboard, offering customizable visualizations and seamless integration with various data sources.

The Jaspersoft dashboard offers dynamic data visualization and reporting tools, empowering users to make informed decisions with real-time insights.

Gain insights into your log data with Loggly's intuitive dashboard, offering real-time analytics, visualization, and monitoring for enhanced troubleshooting.