

Loading dashboard information...
Loading dashboard information...
Monitor and analyze real-time data with Grafana's interactive dashboard, offering customizable visualizations and seamless integration with various data sources.
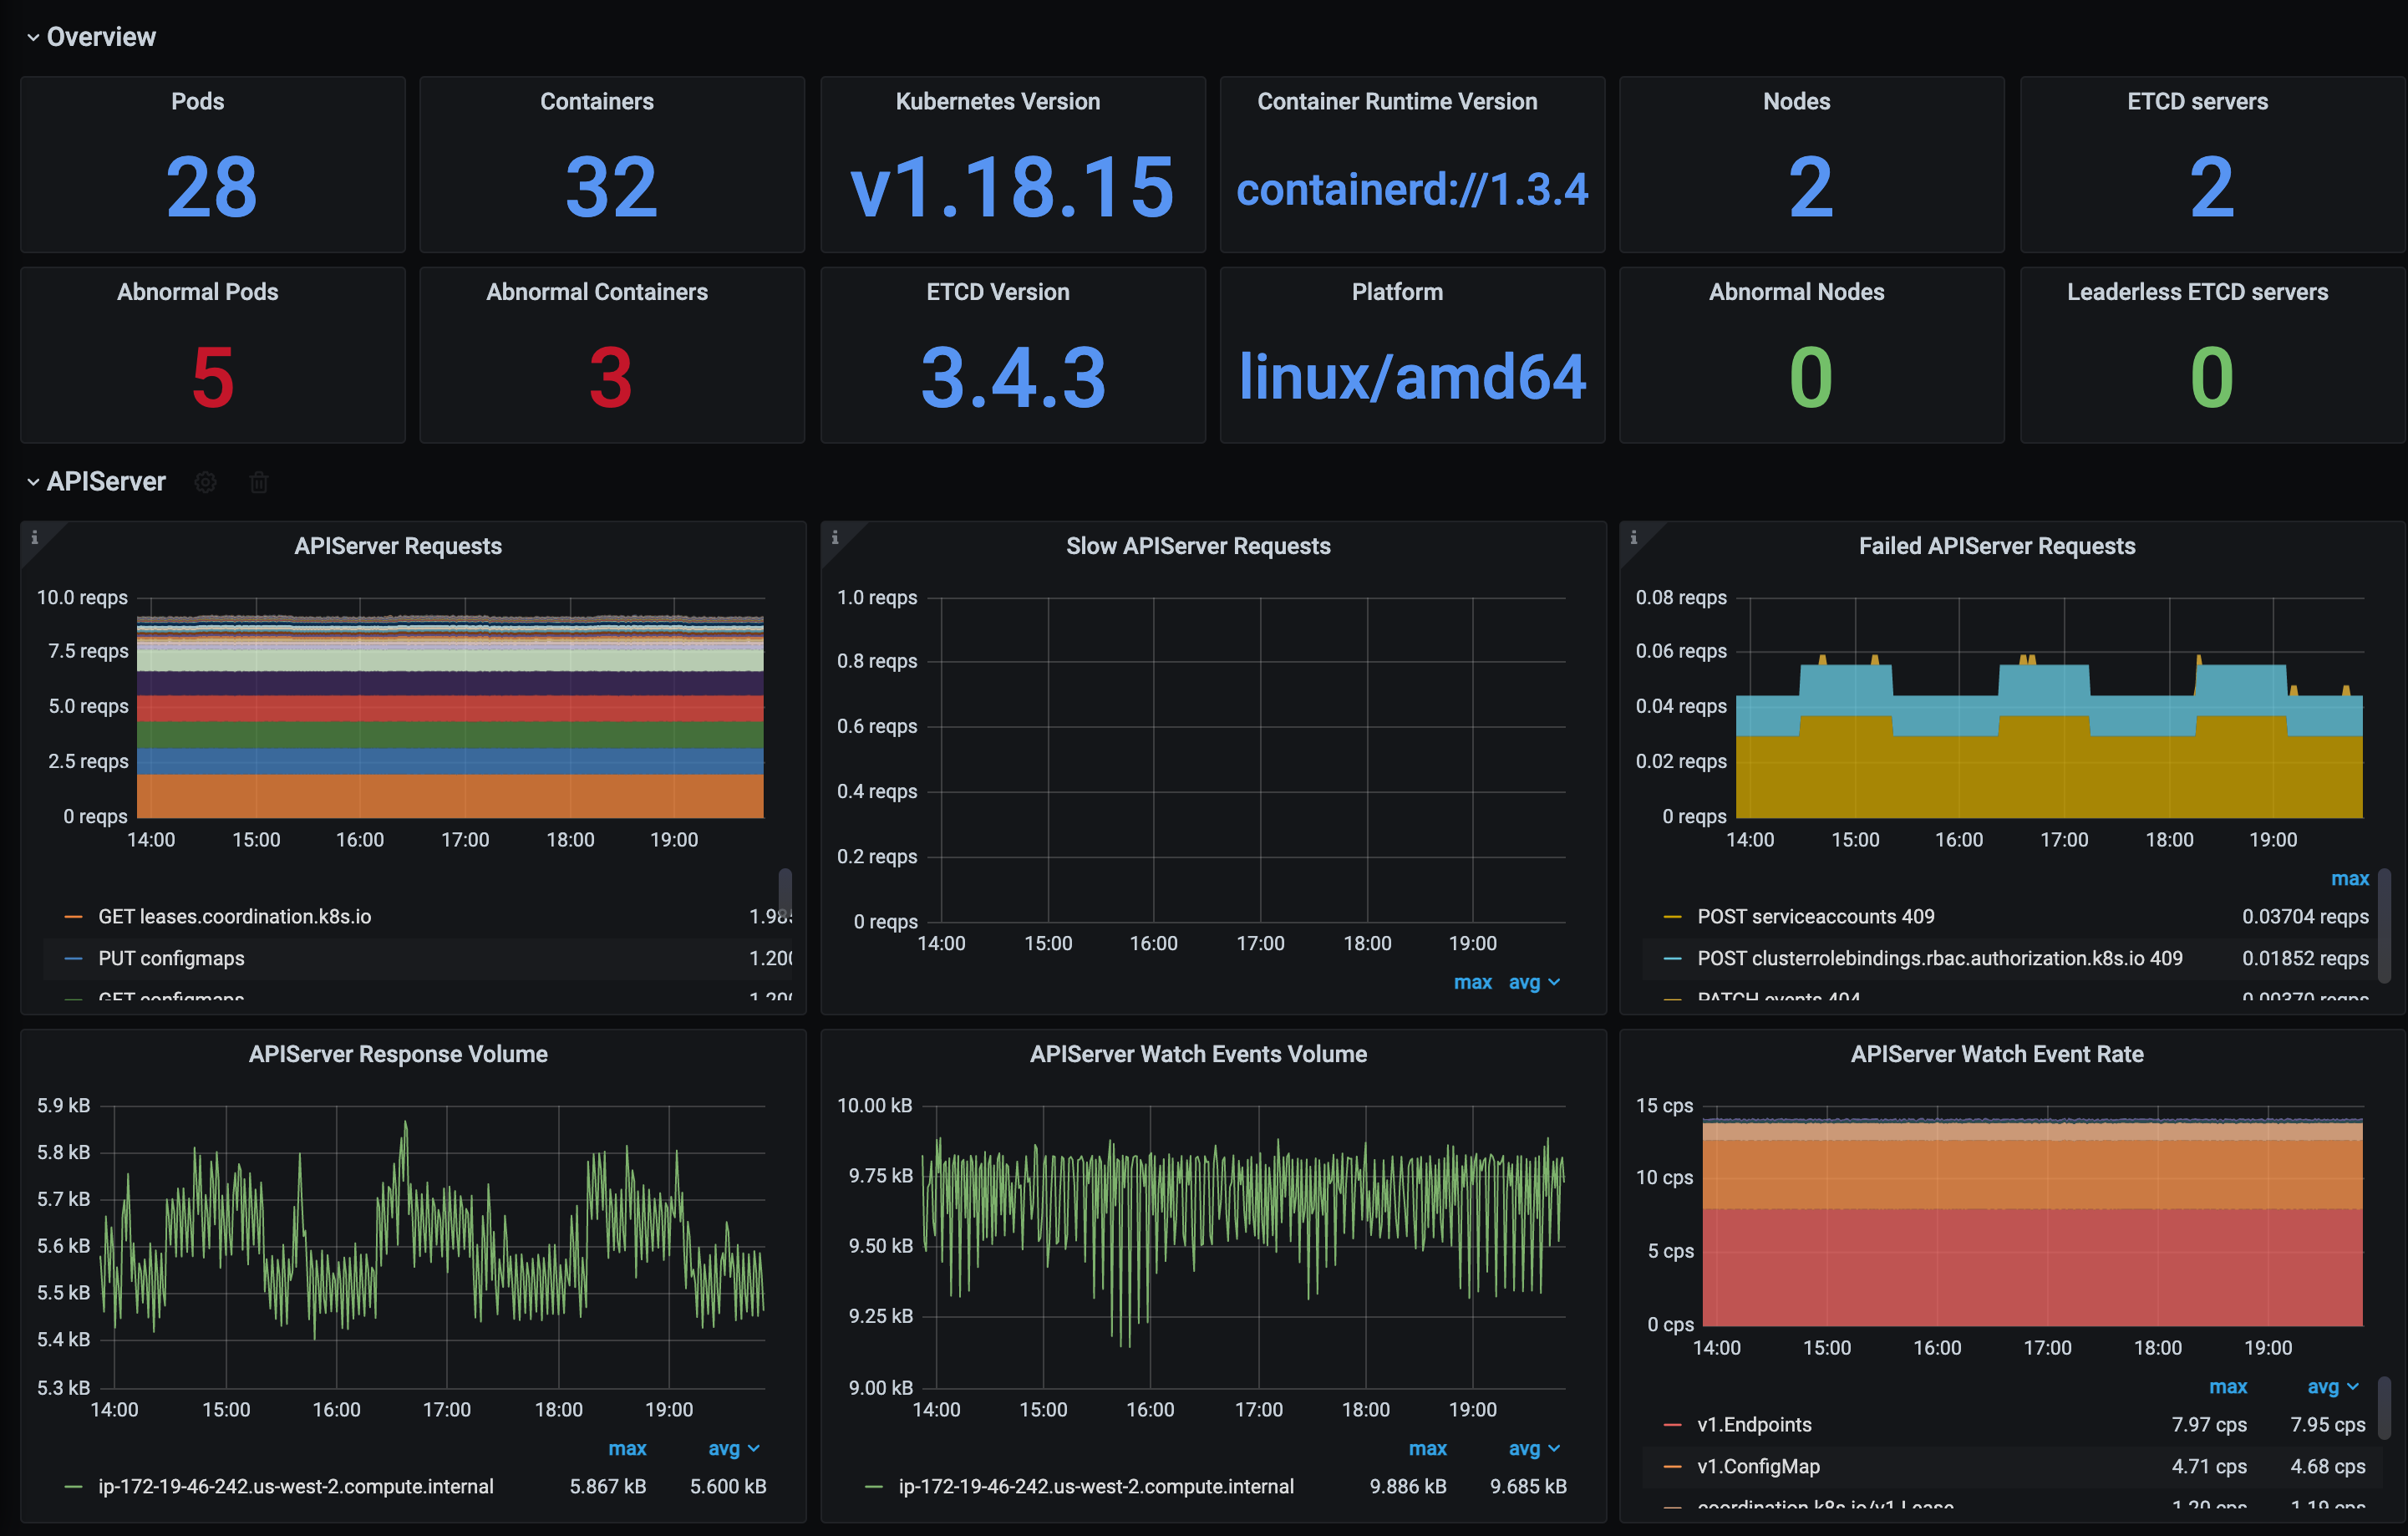
This Grafana dashboard is designed to provide users with real-time insights into their data streams. By leveraging Grafana's powerful visualization tools, users can track performance metrics, system health, and other critical data points as they occur. The dashboard supports a wide range of data sources, enabling seamless integration and comprehensive monitoring across different platforms. Users can customize the dashboard to fit their specific needs, ensuring that the most relevant information is always at their fingertips.
Tailor your dashboard with various visualization options to suit your data needs.
Seamlessly connect to multiple data sources like Prometheus, InfluxDB, and Elasticsearch.
Set up alerts to notify you of any critical changes in your data.
Control access with user roles and permissions for enhanced security.
Use templates to create dynamic dashboards that adapt to different data sets.
Add context to your graphs with annotations for significant events.
Easily adjust the time range to focus on specific periods.
Share your dashboards with team members or external stakeholders.
Extend functionality with a wide range of plugins available in the Grafana ecosystem.

This Grafana dashboard is ideal for IT professionals, data analysts, and operations teams who need to monitor and analyze data in real-time. It's particularly beneficial for those managing complex systems or applications that require constant oversight to ensure optimal performance and reliability. Whether you're working in DevOps, network management, or application development, this dashboard provides the tools necessary to maintain a high level of operational awareness and decision-making capability.
Other dashboard tools that work with Fugo

Monitor and optimize your application's performance with real-time insights and analytics using the Dynatrace dashboard.

Visualize, analyze, and monitor your Elasticsearch data in real-time with interactive charts and graphs using the Elasticsearch Kibana dashboard.

The Jaspersoft dashboard offers dynamic data visualization and reporting tools, empowering users to make informed decisions with real-time insights.