

Loading dashboard information...
Loading dashboard information...
Visualize, analyze, and monitor your Elasticsearch data in real-time with interactive charts and graphs using the Elasticsearch Kibana dashboard.
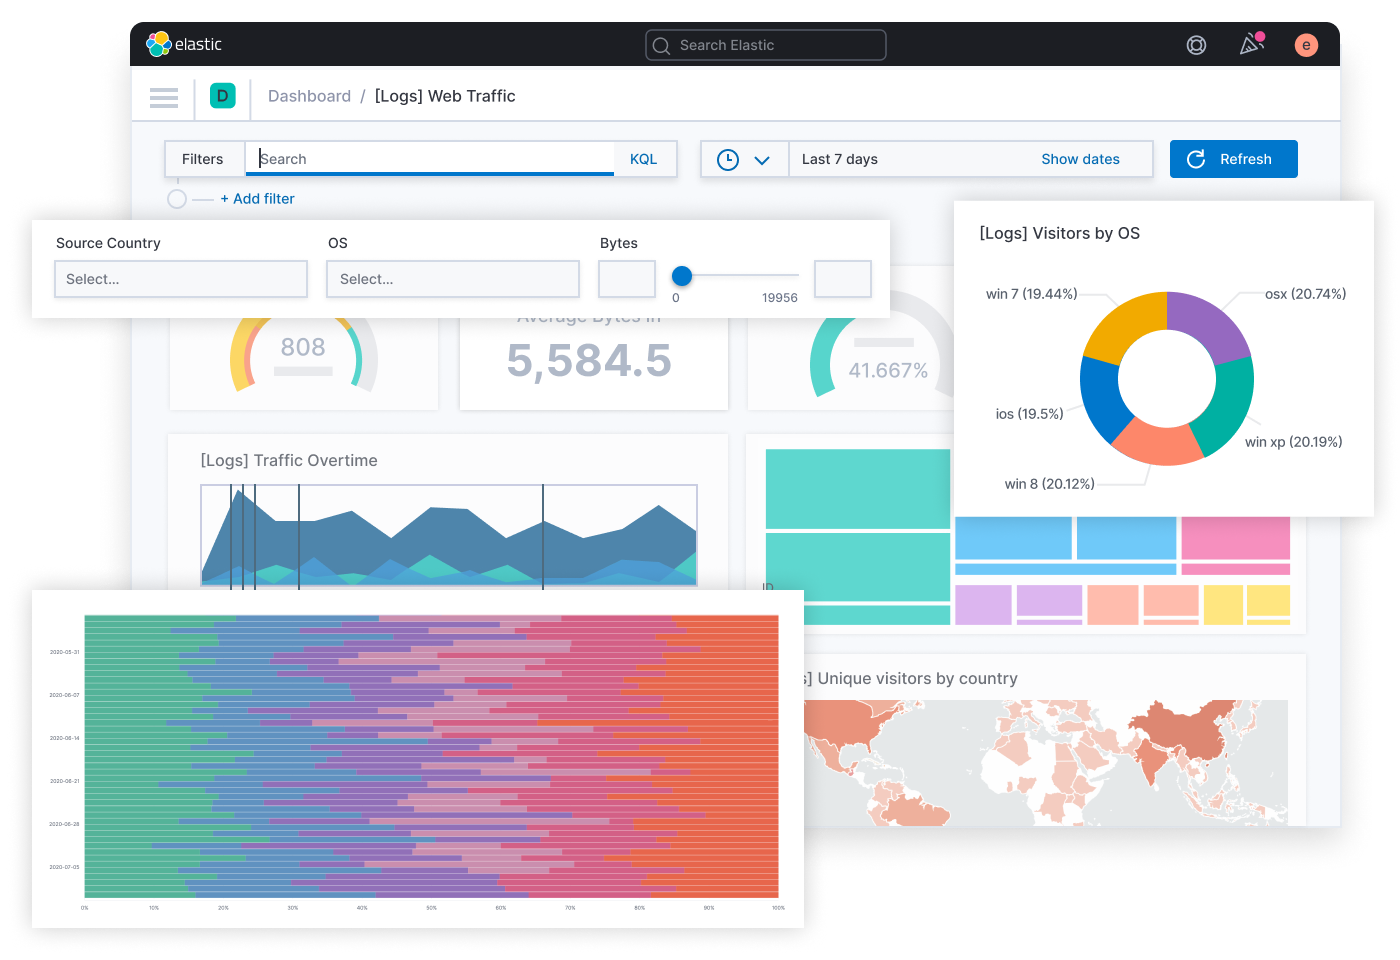
The Elasticsearch Kibana dashboard provides a powerful platform for visualizing and analyzing your Elasticsearch data. With its intuitive interface, users can create dynamic, interactive charts and graphs that allow for deep insights into data trends and patterns. The dashboard supports a wide range of visualization types, including bar charts, line graphs, pie charts, and more, enabling users to tailor their data presentations to specific needs. Additionally, the dashboard's real-time data monitoring capabilities ensure that users can track changes and updates as they happen, making it an essential tool for data-driven decision-making.
Tailor your dashboard to meet specific business needs with customizable widgets and layouts.
Utilize advanced search features to filter and query data efficiently.
Aggregate data across multiple indices for comprehensive analysis.
Engage with data through interactive charts and graphs.
Set alerts for specific conditions and generate reports for stakeholders.
Leverage machine learning to detect anomalies and forecast trends.
Ensure data security with role-based access permissions.
Integrate with other tools and platforms for enhanced functionality.
Handle large volumes of data with ease, ensuring performance remains optimal.

The Elasticsearch Kibana dashboard is designed for data analysts, IT professionals, and business intelligence teams who need to visualize and interpret large volumes of data efficiently. It's also suitable for developers and system administrators looking to monitor system performance and troubleshoot issues in real-time. Organizations that rely on data-driven insights to make strategic decisions will find this dashboard invaluable, as it provides a comprehensive view of data trends and patterns, enabling informed decision-making.
Other dashboard tools that work with Fugo

Monitor and analyze your infrastructure, applications, and logs in real-time with Datadog's comprehensive and customizable dashboard.

Monitor and optimize your application's performance with real-time insights and analytics using the Dynatrace dashboard.

Monitor and analyze real-time data with Grafana's interactive dashboard, offering customizable visualizations and seamless integration with various data sources.