

Loading dashboard information...
Loading dashboard information...
Gain insights into your GitLab projects with real-time analytics, tracking performance, productivity, and collaboration metrics efficiently.
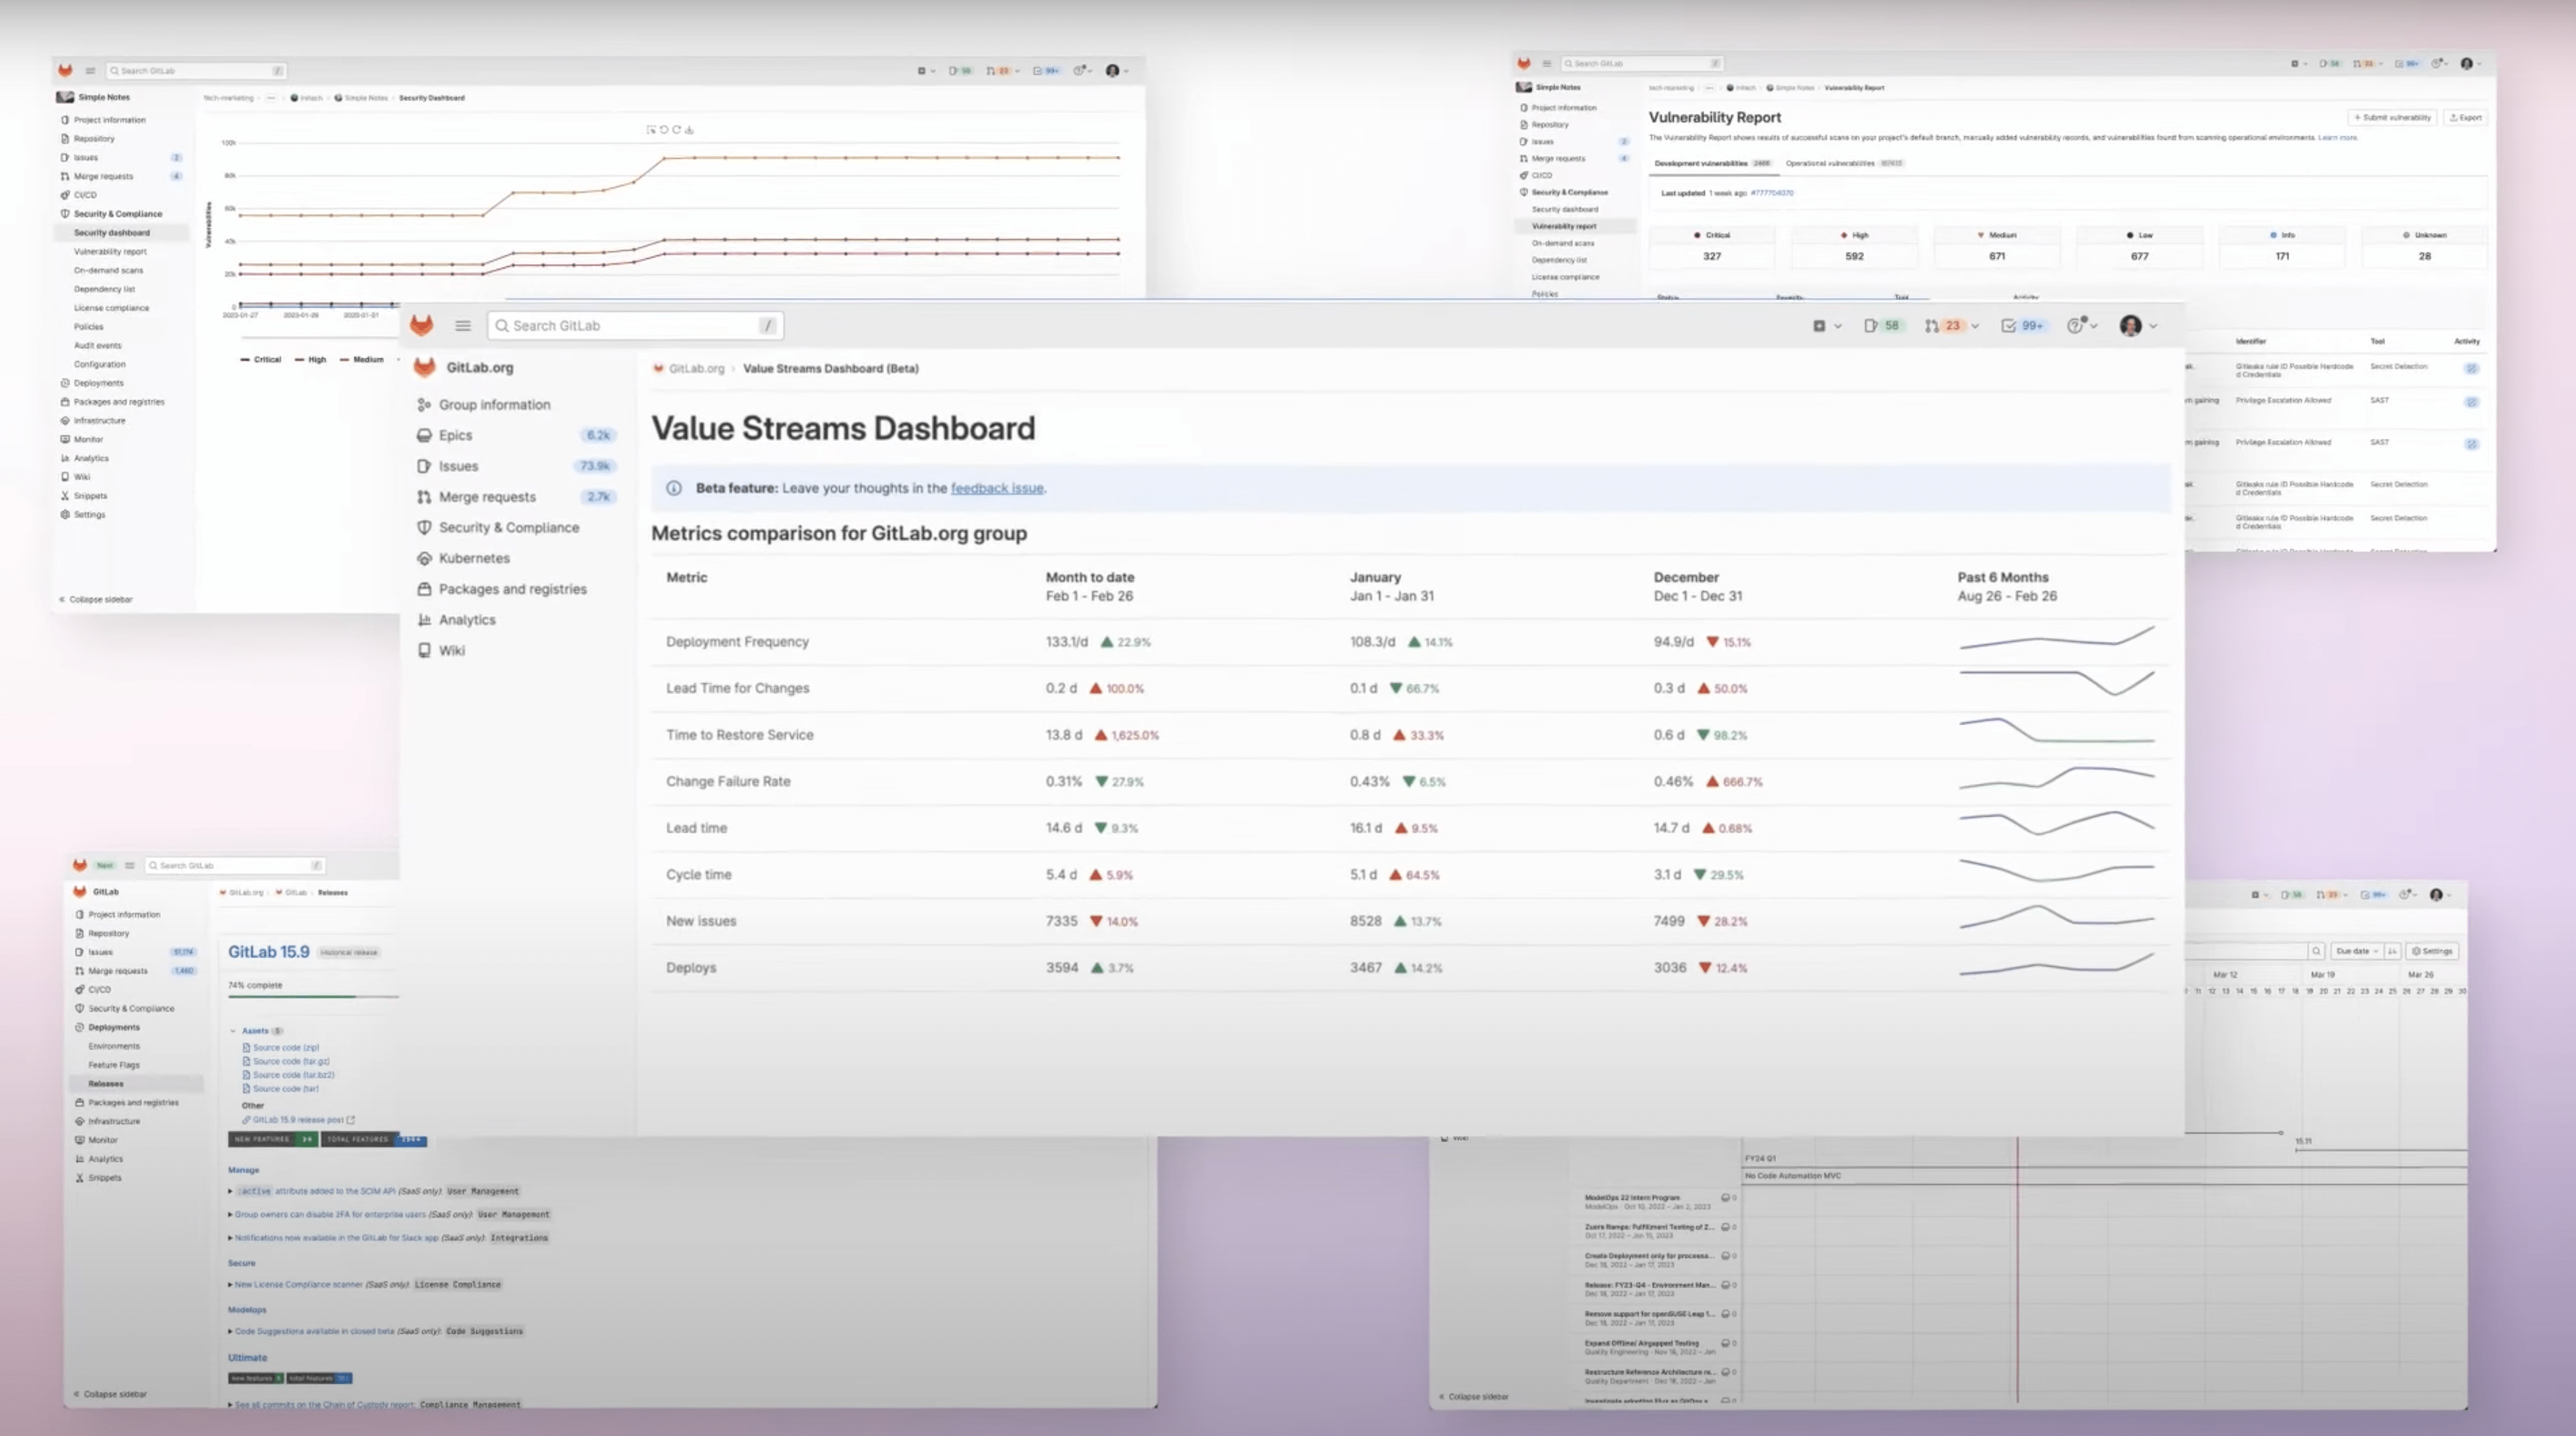
The GitLab Analytics dashboard provides a comprehensive overview of your project's performance. It aggregates data from various GitLab activities to present a clear picture of your project's health. You can monitor key performance indicators such as merge request throughput, issue resolution times, and code commit frequency. This section helps you identify bottlenecks and areas for improvement, ensuring your team meets its goals efficiently.

The GitLab Analytics dashboard is designed for project managers, team leads, and developers who need to track and optimize their project's progress. It is particularly beneficial for teams using GitLab as their primary version control and project management tool. By providing actionable insights, the dashboard helps these users enhance productivity, streamline workflows, and ensure timely project delivery.
Other dashboard tools that work with Fugo

CircleCI Insights provides real-time analytics on your CI/CD pipelines, helping teams optimize performance and improve software delivery efficiency.

Gain actionable insights into your GitHub repositories with real-time analytics and trends to optimize project management and collaboration.

The Heroku Dashboard provides a comprehensive view of your applications, enabling efficient management, monitoring, and deployment in a user-friendly interface.