

Loading dashboard information...
Loading dashboard information...
CircleCI Insights provides real-time analytics on your CI/CD pipelines, helping teams optimize performance and improve software delivery efficiency.
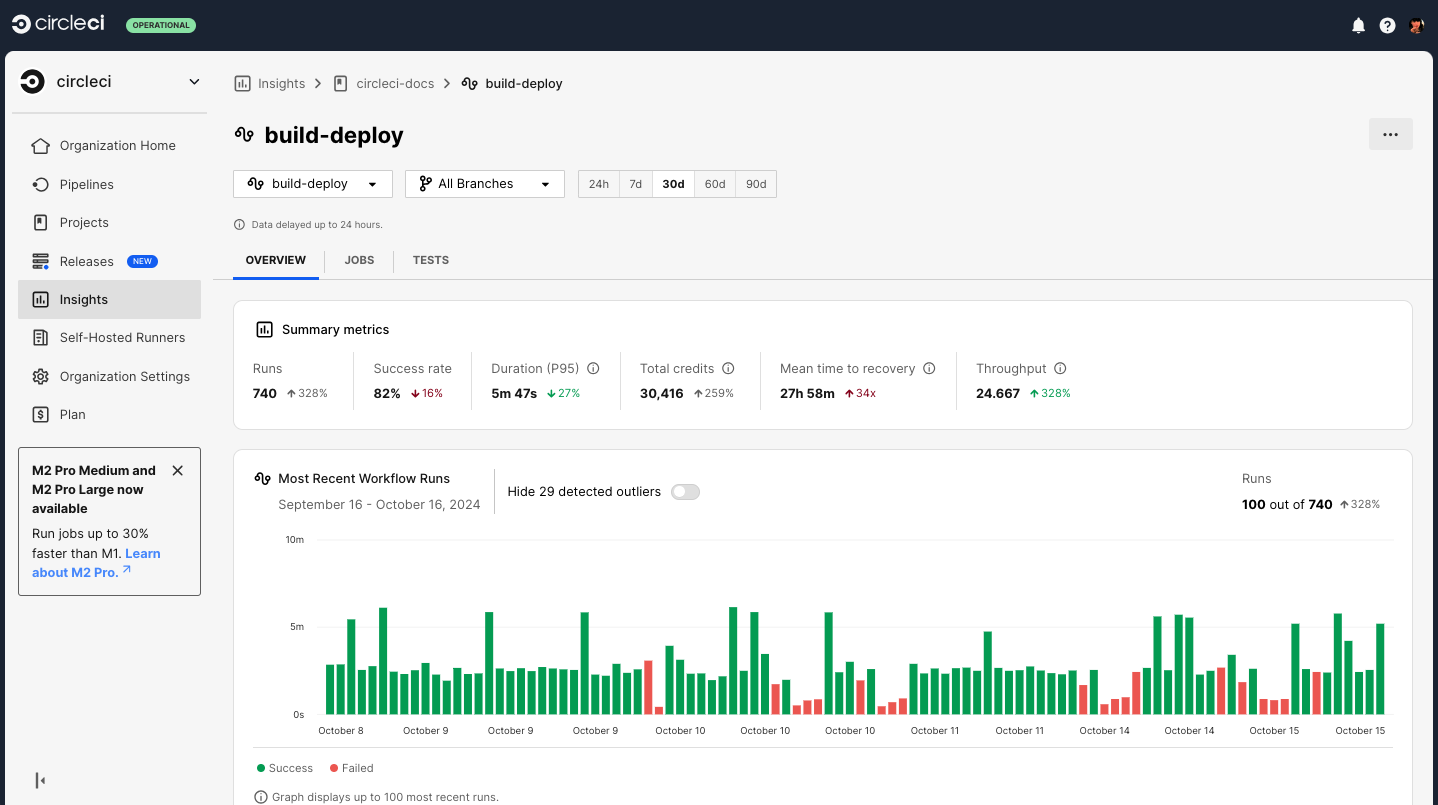
The Pipeline Performance Overview section of the CircleCI Insights dashboard offers a comprehensive view of your CI/CD pipeline's efficiency. It provides metrics such as build duration, success rates, and failure trends over time. This data helps teams identify bottlenecks, optimize resource allocation, and enhance overall workflow efficiency. By visualizing these metrics, teams can make informed decisions to improve their software delivery processes.

The CircleCI Insights dashboard is designed for DevOps teams, software engineers, and project managers who are responsible for maintaining and optimizing CI/CD pipelines. It's particularly beneficial for teams aiming to enhance their software delivery processes by leveraging data-driven insights. Whether you're a small startup or a large enterprise, this dashboard provides the necessary tools to streamline operations and improve collaboration across development teams.
Other dashboard tools that work with Fugo

Gain insights into your Bitbucket repositories with real-time analytics on commits, pull requests, and code reviews to enhance team productivity.

Chef Automate dashboard offers comprehensive insights into infrastructure automation, compliance, and application delivery in real-time.

Gain actionable insights into your GitHub repositories with real-time analytics and trends to optimize project management and collaboration.