


Metrics. KPIs. Objectives. Benchmarks. They all sound like different words describing the same thing… so you’re not in the wrong for feeling confused.
But you should know that KPIs vs metrics are actually fairly different beasts. If you can learn how they differ (and how they work together), it’ll be easier to keep tabs on your various business processes.
TL;DR: key performance indicators are collections of metrics that measure business goals. Metrics, on the other hand, are tiny measurements of progress within those goalposts.
That means all key performance indicators are types of metrics, but not all metrics are KPIs.
You can use this guide to learn more about the differences between KPIs vs metrics, plus how to use both to their fullest extent (including with data dashboards).
What are key performance indicators (KPIs)?

KPIs are quantitative measures of business success that can help you measure progress against specific business goals. They can also help you benchmark your company’s health (or departmental health) so you can better measure success over a set period of time.
Whew! Okay. So in a human translation: they’re a group of metrics that represent key business goals, like higher revenue, happier customers, lower risk exposure, and more.
There are two major types of KPIs to keep in mind:
- Lagging KPIs track things that have already happened. You might use lagging indicators to monitor increased customer satisfaction or look at the percent of actual customers who have signed up for your service in a given period.
- Leading KPIs (sometimes called leading indicators) help you predict trends to inform future business strategies. For example, you might want to estimate your net profit margin for the coming year, or estimate business performance according to recent sales growth.
All KPIs are basically goalposts for what you want to do, whether they’re leading or lagging indicators. You can think of them like a collection of books at the library: the subject of the 'collection might be ‘operations’ or ‘sales growth,’ but you’ll need multiple ‘books’ (aka performance metrics) to better understand the sum of the whole.
Types of key performance indicators
There are lots of different key performance indicators to track progress in your business.
Let’s take a look at some common categories below:
- Marketing KPIs: Your marketing team might want to improve the number of website visitors you receive, or want to track customer satisfaction to calculate the overall happiness and value of your subscriber base.
- Sales KPIs: Your sales team can track numbers related to business and sales growth. For example, might track overall performance by collecting data such as close rates, overall revenue growth, and/or lead quality.
- Strategic KPIs: These are multiple metrics designed to measure the success of a company’s long-term strategic goals. For example, maybe you want a bigger market share than your competitors, or you want to reach 1,000 paying customers in a year.
- Operational KPIs: These can help project managers keep tabs on routine business operations, plus make sure day-to-day activities are running as expected.
Specific key performance indicators
You’ve looked at a couple common categories by now. So let’s take things a step further by looking at specific measures within said categories, including:
- Website visitors: Knowing how many people visit your website can give you actionable insights for how to improve or optimize your digital funnel.
- Net promoter scores: This can help you understand customer satisfaction levels. You can also see how your business compares to industry benchmarks — including whether or not it’s falling behind.
- Inventory turnover: Think quantitative measurements of stock levels, customer returns, forecasted demand, and more.
- Customer lifetime value: How much value can you get from a single customer during their relationship with your business? What can you do to improve their value, or choose similar business targets in the future?
- Customer retention: This is mostly a measure of your business health. The higher your retention, the higher your revenue, and the stronger your business will remain over the years.
This, of course, barely scratches the surface. There are many other KPIs to keep in mind depending on the size and goals of your business.
💡Related: The 11 Most Useful SaaS KPIs (And How To Actually Use Them)
How to track KPIs

Now that you know what a KPI is, how do you actually go about tracking them?
One way to do this is with dedicated software that collects all your important metrics in a single place. Power BI, for example, offers a feature called the KPI Visual, which can help you visualize the tiny measurements that make up your KPIs (aka metric measures).
Another solution is to track KPIs in house and allow teams to monitor performance on their own. You might set up shared Excel documents or tap into tools like Google Sheets, which are trickier to use than dedicated software, but potentially simpler if you don’t need to track very many KPIs.
One final option is creating a data dashboard that displays a live feed of your most strategic KPIs. That way, you can easily collect and display data wherever your team needs it most, like a conference room TV, a secure link in their browser, or an embeddable dashboard in Notion, Slack.
What are metrics?
Metrics are simple data points designed for measuring business performance. Unlike KPIs, they’re typically standalone numbers. They aren’t inherently tied to business goals.
You can find metrics just about anywhere these days, from sales gamification platforms to Google Analytics. They’re simply quantifiable measures of some facet of your business, specifically designed to help you track numbers, amounts, percentages, volumes, increases, and decreases (along with other things of that nature).
To summarize: metrics are basically the tiny data points you need to benchmark the success of your business goals (aka, KPIs). They won’t tell you much sitting alone in a dashboard, but they can fuel your KPIs.
Don’t worry, we’ll cover more of this later.
Types of metrics

Let’s look at various metrics you might want to track to keep tabs on your growing small business:
- Performance metrics: These are usually quantifiable measurements for finance, employee activities, close rates, and more.
- Abandonment rates: How often people close out of a webpage, jump out of a call, or leave their virtual shopping cart full on your website.
- Search traffic: How many people found your website via organic search? Conversely, how many people tapped on an ad or searched for your URL directly?
💡Sidenote: You might have heard about an offshoot called vanity metrics, which are numbers that stroke your ego, but don’t necessarily point to tangible business results. For example, you might have 20,000 Instagram followers, but they’re not necessarily making you money. It’s a good idea to avoid vanity metrics so you don’t inadvertently miss something more important lurking in your data (like if you’re on track to miss key business goals). That said, you may still want to track the numbers for monthly reports or stakeholder meetings. Just make sure you’re labeling them by what they actually are: vanity metrics.
How to track metrics

KPIs and metrics are tracked in much the same way — in-house, with software, or with a dedicated data dashboard.
With metrics specifically, you might want more ‘boots on the ground tools,’ including platforms like Google Analytics, Ahrefs, Hotjar, and many others. You’ll notice these tools aren’t necessarily about tracking KPIs, which collect quantifiable numbers in light of specific business objectives. Instead, they simply provide quantifiable measurements so you can put them into context later (like in a larger data dashboard).
Speaking of data dashboards, you might also want to create ‘collection points’ for metrics that draw in all important numbers from the data collected. That way, you can zero in on the numbers that offer more measurable value and make it easier to monitor KPIs and track continuous organizational growth.
You can do this with software, or handle it manually via Google Sheets or Excel. The bottom line is making sure you can track everything quickly and accurately.
Comparing metrics vs KPIs
KPIs and metrics are two sides of the same coin. But that doesn’t mean they’re terribly easy to understand.
So when is something a KPI, and when is something a metric?
Here’s a quick chart of the key differences you should know:
The key differences are:
- Metrics are smaller measurements of business processes, while KPIs use smaller measurements to calculate specific percentages, ratios, or ‘magic numbers.’
- KPIs are always tied to a goal. But metrics are numbers that exist in vacuum — you’ll need to assign them to a KPI so they make sense in context.
- You’ll want to track 10 KPIs or less for your business. But you can track dozens of metrics that feed into said KPIs.
TL;DR: if KPIs are your recipe for success, your metrics are the ingredients.
You can have two cups of web traffic, a pinch of engagement, and a dash of bounce rate, which don’t make much sense on their own. But with KPIs, they all come together to create a clear, measurable goal, without just throwing numbers into a pan.
So why does my business need both key performance indicators and metrics?
There are some pretty major differences in KPIs vs metrics, but in the grand scheme of things, you’ll need both to build your business.
First, you should set goals for specific business processes, like how much you want to make this quarter, or how many customers you want onboarded by the spring. You should have all your KPIs measure a total of 10 or less. That way, you don’t get overwhelmed by unnecessary numbers or spin your wheels tracking so many unnecessary stats.
The next step is setting key objectives that show you’re on the right path toward achieving said goals (in other words, your KPIs). Just make sure you’re collecting accurate data points around your business objectives. It’s hard to measure success with a mislabeled ruler, after all.
Put them all together, and you’ll have a solid idea of what your key business objectives are and what numbers you’ll need to track progress.
Now we just need to make them easy to track.
Which brings us to our next point…
Why metrics vs KPIs matter when building dashboards

KPIs and metrics both belong in data dashboards — but if you don’t respect their differences, your beautiful dashboard might look a bit… messy.
Traditional dashboard tools (lookin’ at you, Excel) often overwhelm users with too many numbers and not enough story. You’ll end up drowning in data instead of getting the context you actually need. That’s where knowing the difference between metrics and KPIs can save your bacon.
Remember: metrics tell you what’s happening in your business. When you put them into KPIs, you can see whether or not they’re making a difference.
A good dashboard can help you filter out noise, spot patterns, and drive decisions whenever your KPIs take center stage. Just find the metrics that point toward critical performance indicators. Then, consolidate everything together into a simple, streamlined dashboard.
Let’s take a look at how to do this below.
The easiest way to display metrics and KPIs for your business
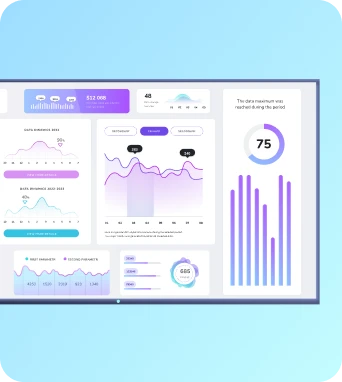
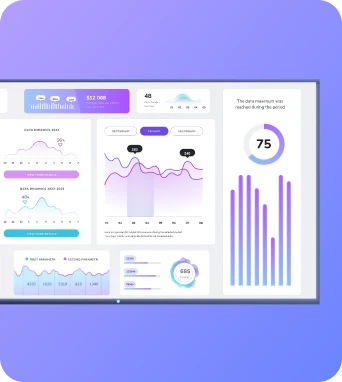
You can create KPI dashboards that live in BI software, are saved to your computer, or exist on company intranets. But by far the easiest solution is creating a TV dashboard, which lets you display critical data wherever your team needs it most.
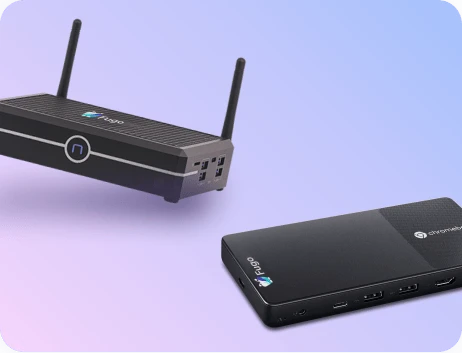
You can use tools like Fugo to set up simple TV dashboards that push the right data to the right screens without any extra work on your part. We’ve also got a little secret — an AI dashboard builder — in the works. This is the easiest way to put both metrics and KPIs on display for your business.
Imagine a tool that asks what your goal is, then builds the right dashboard based on what it knows about your brand. Or access to prompt-based reporting as a smarter, easier alternative to creating manual dashboards all on your own.

Above all, Fugo’s dashboard tools can help you prioritize KPIs instead of settling for charts in a customizable, cloud-based display. You can keep frontline teams engaged, show off your hard work, and let everyone on your team stay in the know with KPIs and metrics.
Sign up today for a 14-day free trial of Fugo to test our TV dashboards for yourself. Then, fill out the form to join our AI Beta Program and get exclusive access to our newest AI dashboard features.
Frequently asked questions about metrics vs KPIs
Q: What is the difference between KPIs and metrics?
KPIs refer to an outcome or goal you’re trying to achieve. Metrics are all the data points you track while working on achieving said goal.
So if you’re trying to reduce your customer churn rate to under 5% this year (your KPI), you’ll want to keep track of business metrics that can help you complete the formula — like number of accounts churned in one time period or the number of accounts at the beginning of same time period (your metrics).
Q: Is a KPI a goal or a metric?
A KPI is a group of metrics tied to a business goal — so technically both. You might set an overarching KPI metric, like achieving 500 new subscriptions over the next six months. Then, you’ll need to gather data to see if you’re actually moving in the right direction, like closing percentages, conversion rates, performance tracking, and more.
Q: What are KPI metrics examples?
A few classic KPI examples include:
- Monthly recurring revenue (MRR)
- Customer acquisition cost (CAC)
- Website conversion rate
- Net promoter score (NPS)
Q: What is the difference between KPI and test metrics?
KPIs tell you how your whole business is doing. Test metrics tell you how an experiment is performing.
Let’s look at it another way.
If KPIs are how healthy you are, test metrics are like your fitbit readings — think heartrate, step counter, and blood sugar readings. Your overall KPI might be to ‘get healthier,’ but your test metrics might be how much you exercise, how low your blood pressure is, and how much you modulate your blood sugar readings.