


Data dashboards in 2026 are a pretty non-negotiable part of business. And if you already have a digital signage program, it’s both easy and advantageous to combine the two.
But how do you integrate your data dashboards with digital signage? What if you use Power BI for marketing data, and then Grafana for your sales team? And how in the world do you set up a real-time data integration to track key metrics without paying extra for view-only licenses?
We did the heavy lifting so you can get started ASAP.
Here’s everything you should know about setting up dashboard integrations with digital signage.
But first: what are dashboard integrations in digital signage?
Before we get into the meat and potatoes, let’s first define our terms.
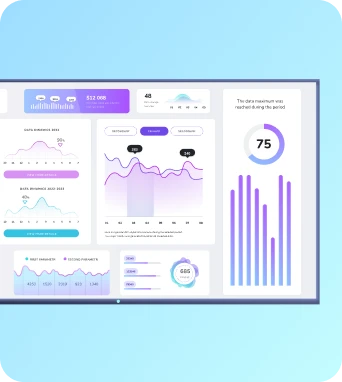
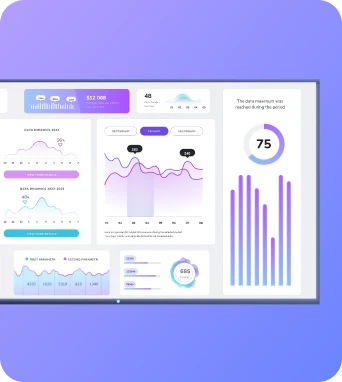
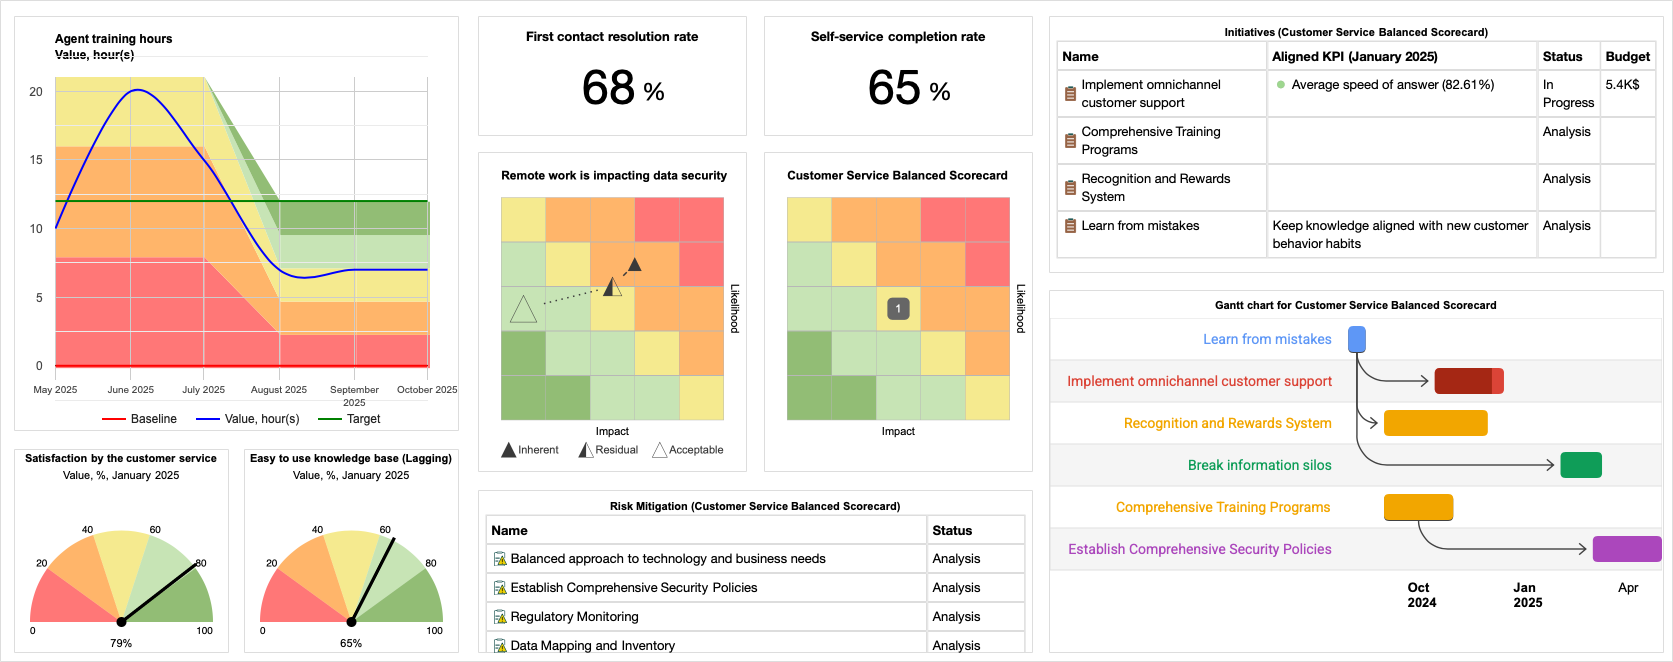
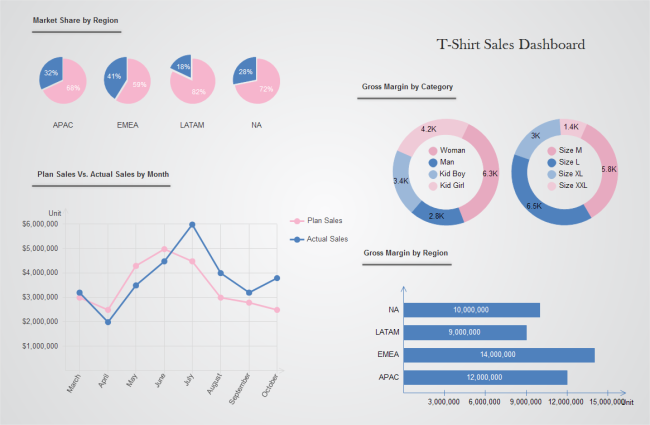
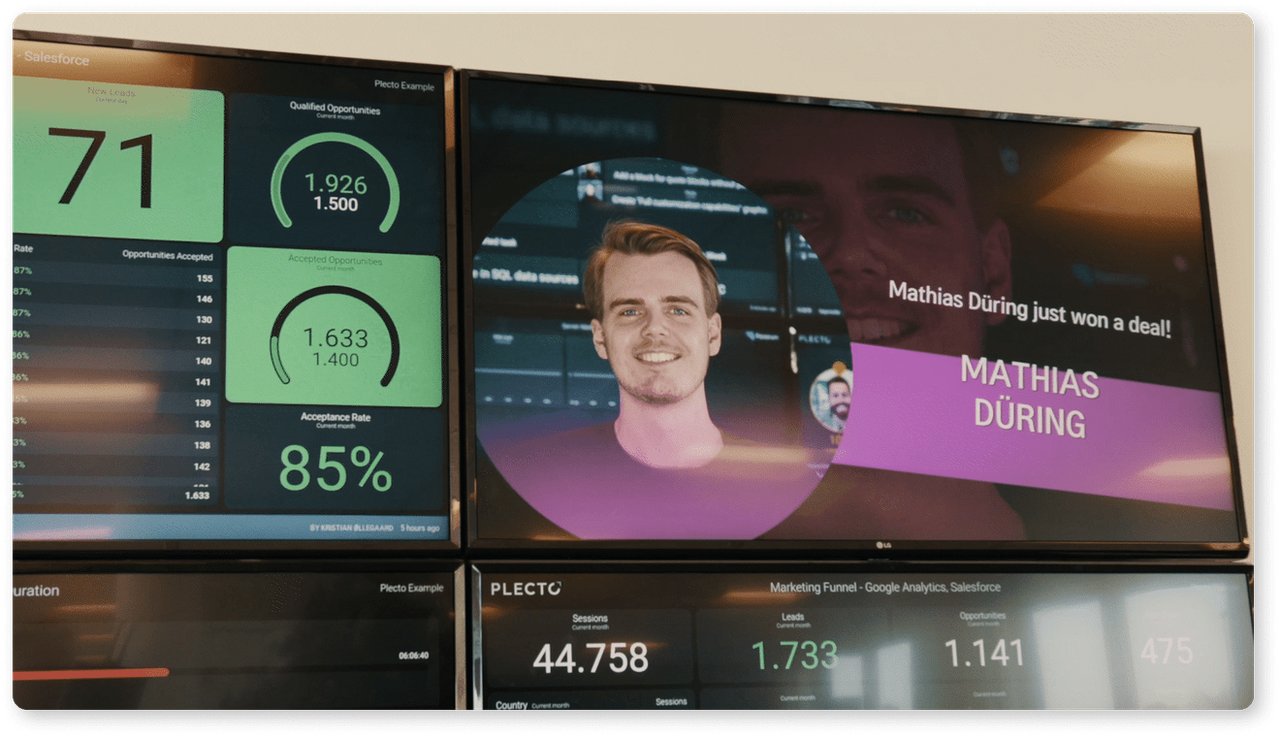
Dashboard integrations in digital signage refer to the ability to display live data dashboards on platforms like Power BI directly on a screen. Instead of uploading static images or slides, you embed a live feed or continuously updated screenshots that let multiple people see your business data at once.
In other words: dashboard integrations let you push your BI tools into a digital signage platform so you can display them on TVs, create company links, or embed them in intranets like Slack and Notion.
Like this:
As you can see, there’s a pretty big difference between a data dashboard and a data dashboard integration with digital signage.
But rather than writing it all out again, here’s a helpful comparison chart that summarizes everything we’ve talked about so far:
The business value of displaying dashboards on screens
So… if you already have data dashboards set up, why bother creating a dashboard integration in the first place?
Here are the benefits of connecting your dashboards to your TV screens with real-time data integration:
- Faster alignment and decision-making. This is especially relevant to frontline teams that don’t have time to log into various data formats. It can also save you hundreds of dollars per year, as we will explore below.
- No payments for view-only licenses. Many data dashboard sites require you to purchase user licenses so individual team members can log in and view your data. But a seamless integration with digital signage frees you from this. Not only can multiple business teams see data from anywhere, but they don’t need to have user licenses to do so.
- No need to tab between various sources or databases for information. By streamlining data from multiple data sources, your team can easily pull out actionable insights. Plus, you don’t need to worry about losing operational efficiency — it’s much harder to lose track of data when it’s all consolidated inside a single CMS platform.
- Supports security and remote monitoring. This visibility across multiple locations makes it easier to manage employees from anywhere. Let’s say you manage warehouse employees across three shifts and two states, for example. TV dashboards can help to keep everyone on the same page from a single, unified view.
- Cuts status meetings. Since everyone can find your dashboard on a company TV channel or TV screen, you don’t need to pencil in meetings just to look over data (or save a buck, for that matter).
- Eliminates (or at least limits) manual reporting tasks. This can also help limit your margin of human error. Like misplacing a zero or adding a comma where it shouldn’t.
- Improves business accountability. There’s much less room to sandbag numbers when everything’s displayed on a massive TV screen. But outside of a sales context, you can also use dashboards to encourage transparency around other numbers. Think marketing campaigns, warehouse speed, number of patients in your waiting room, and so on.
Still not convinced that dashboard integrations are a good idea?
Here are six more reasons you should be using Fugo’s TV dashboards.
Types of dashboards you can display on digital signage
There are five major types of dashboards you can display on digital signage:
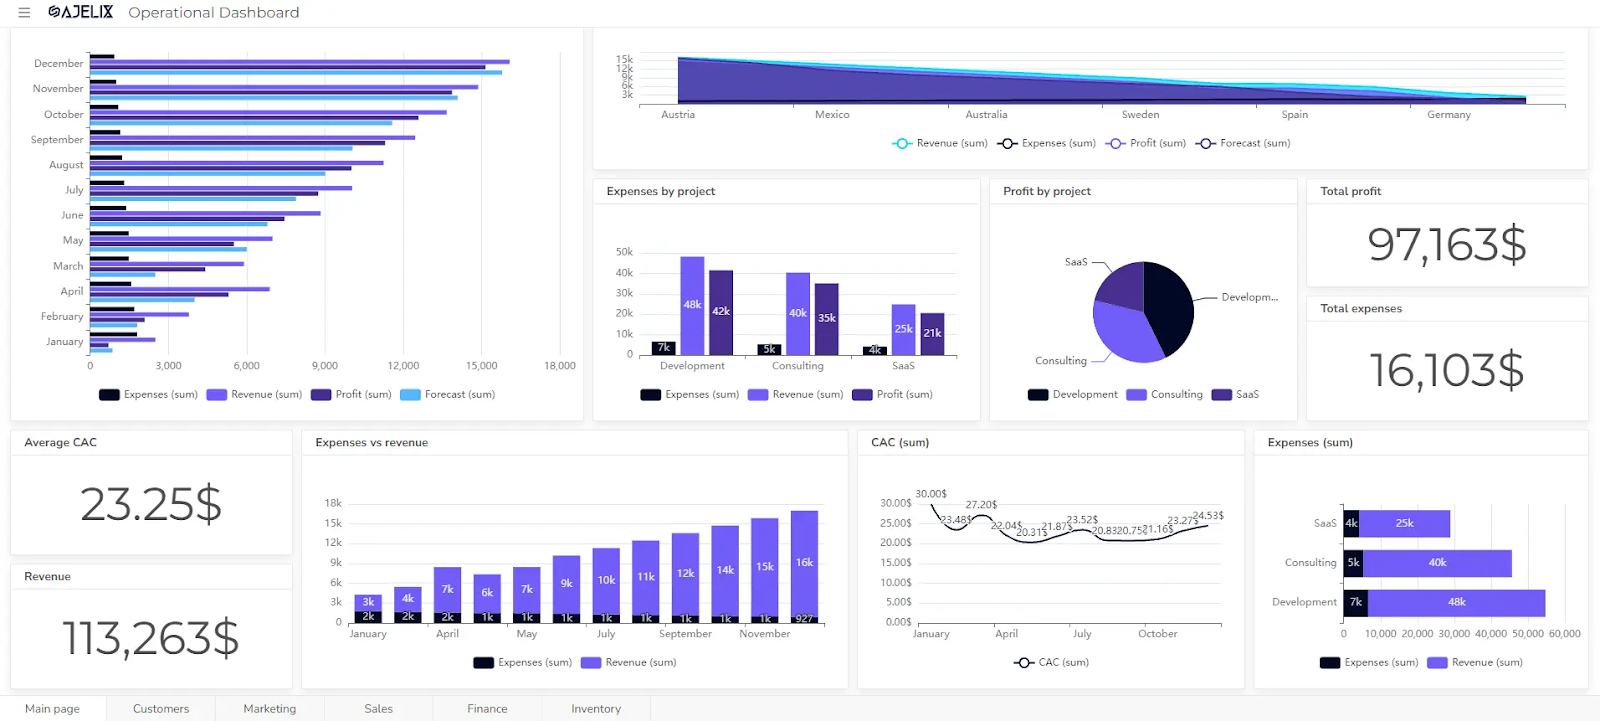
Operational dashboards
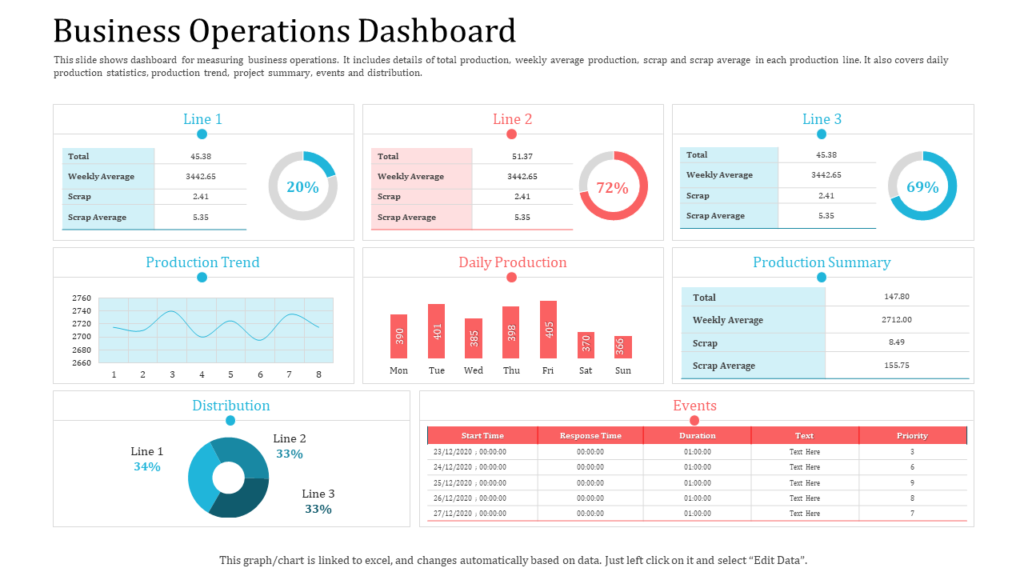
Best for: Business operations managers, frontline supervisors
Operational dashboards focus on the day-to-day execution of your business. They surface metrics that keep processes moving and teams accountable in real time, like:
- Production output
- Order fulfillment rates
- Inventory levels
- Queue length and wait times
- On-time delivery metrics
- Shift performance tracking
Tactical dashboards
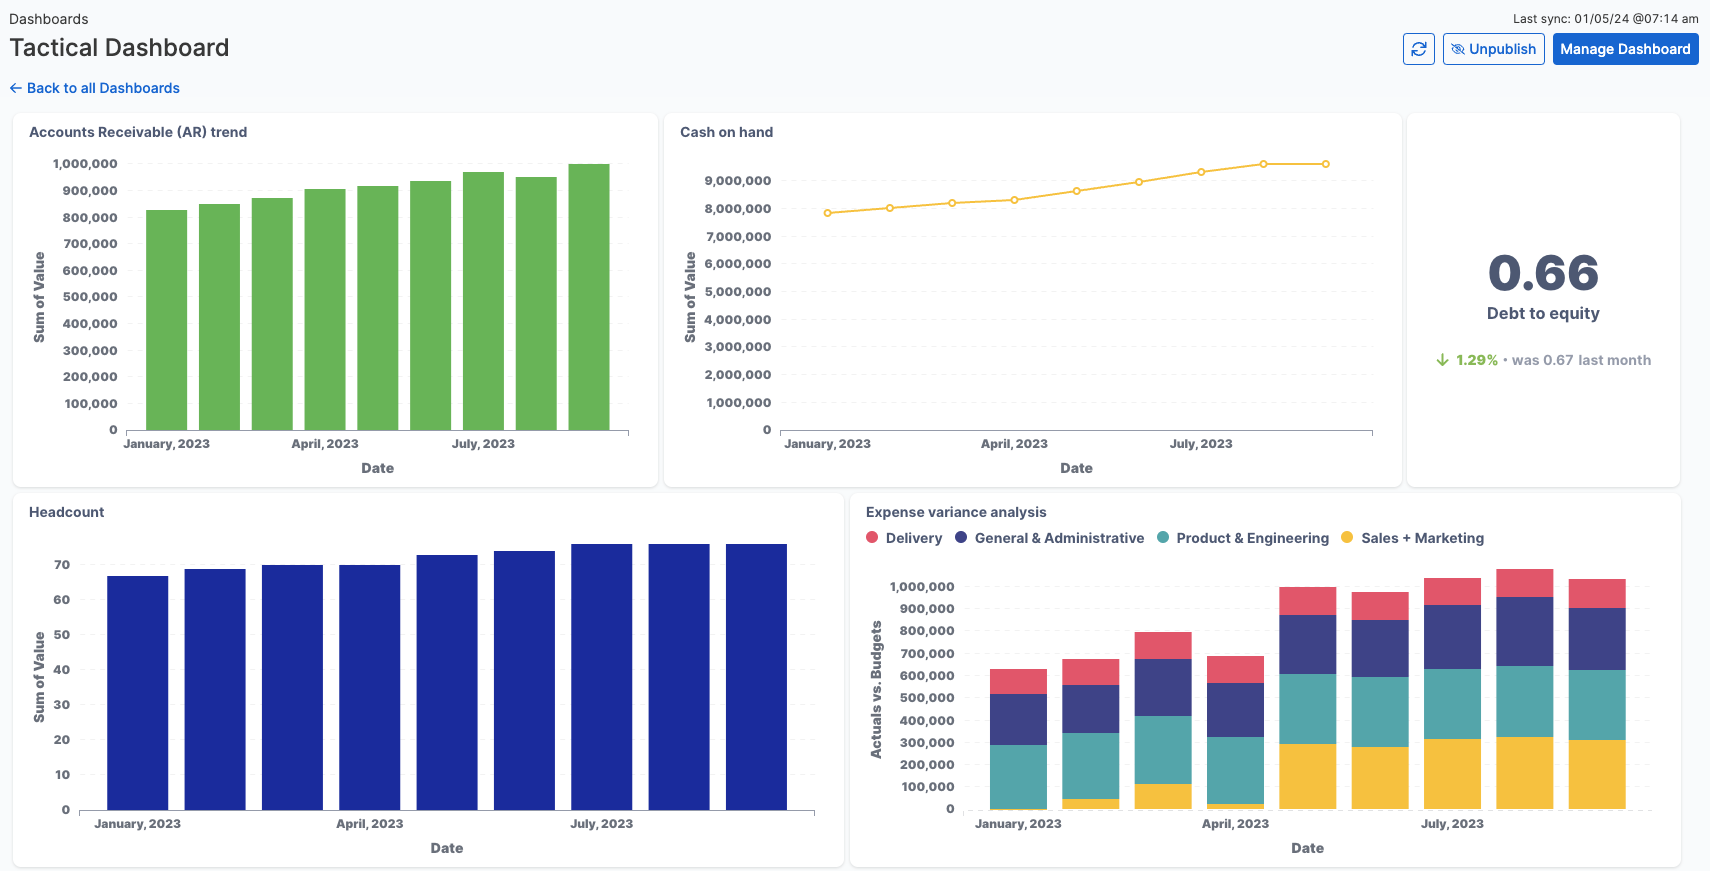
Best for: Sales, marketing, C-suite/executives
Tactical dashboards care about the practical elements of performance and strategy (think user performance and new tool analytics). This includes dashboards for things like:
- Platform performance analytics
- User satisfaction KPIs
- Targets vs. actuals
- Executive and frontline performance
Analytical dashboards
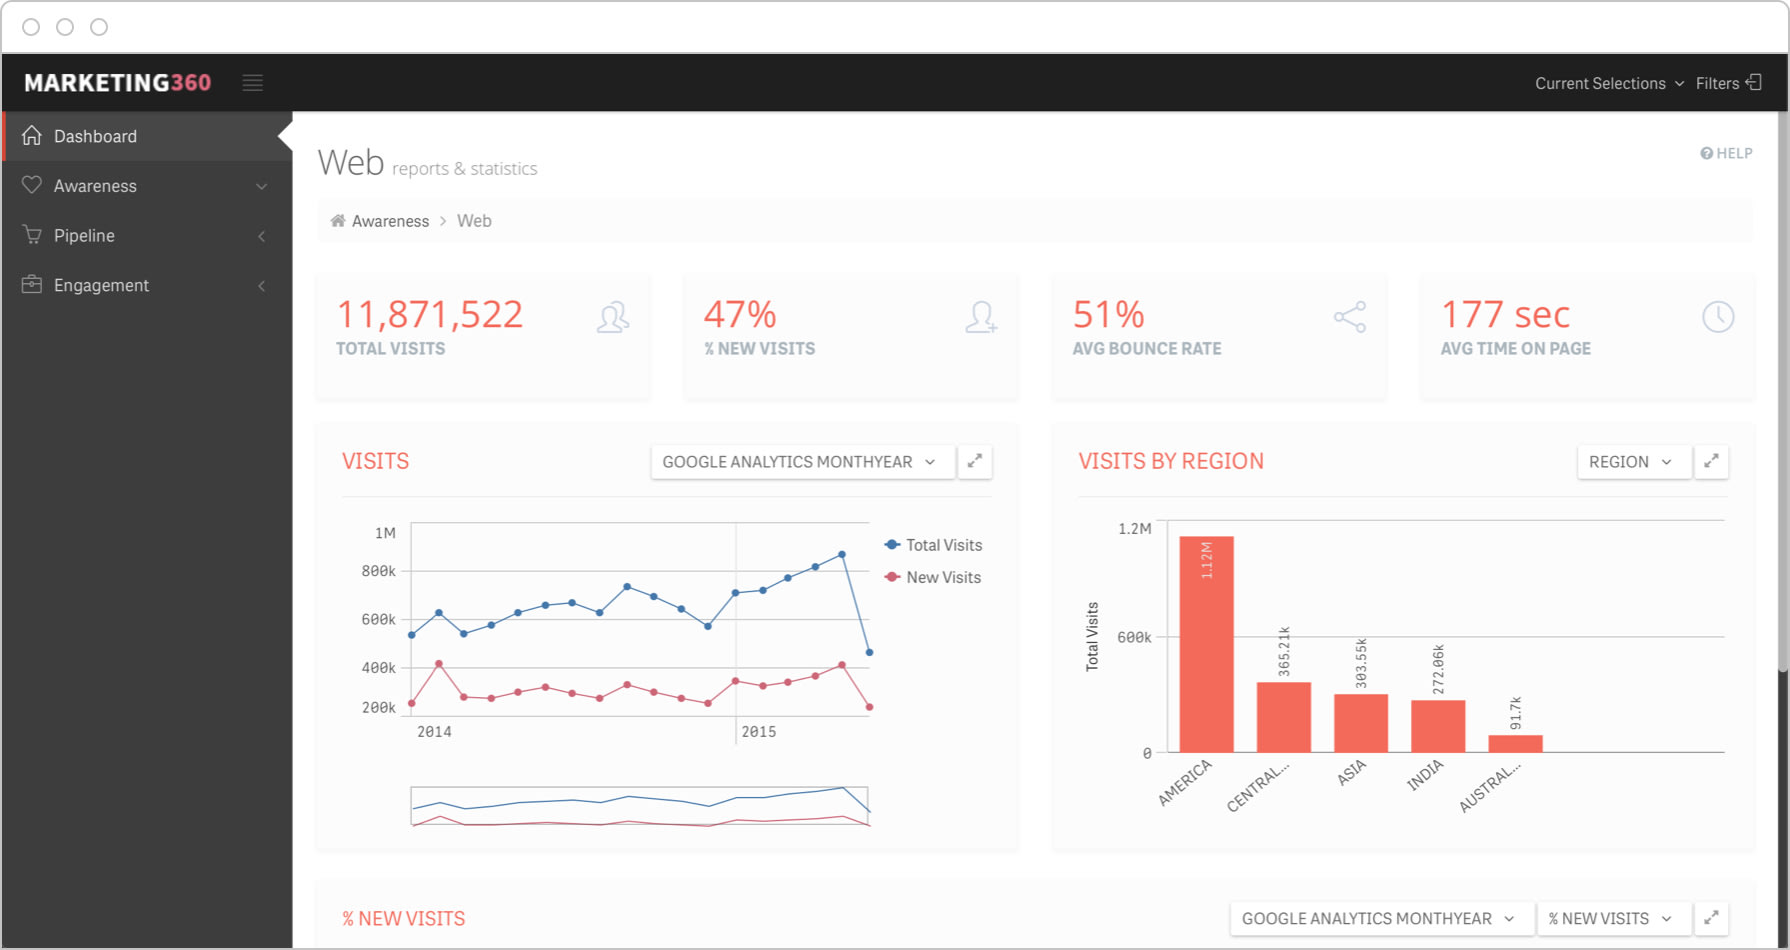
Best for: IT professionals, DevOps teams, technical leadership
Analytical dashboards care about nitty-gritty analytics like device diagnostics or system reliability. This allows you to keep a closer eye on infrastructure and performance trends, then correct potential failure points before they happen.
Analytical dashboards may include metrics for:
- System health alerts
- Uptime monitoring
- Active incidents
- Server or network performance metrics
- Security alerts
- Internal visibility for troubleshooting tickets
- NOCs and SOCs display walls
Strategic dashboards
Best for: Regional managers, boards of directors
You can think of strategic dashboards as the birds’ eye view version of tactical dashboards. Instead of ‘zooming in,’ they ‘zoom out’ on high-level KPIs that reflect your overall business direction rather than daily fluctuations.
They’re great for aligning leadership teams around:
- Quarterly or annual revenue growth
- Market expansion metrics
- Customer acquisition and retention trends
- Profit margins
- Regional performance comparisons
- Long-term productivity metrics
Contextual dashboards
Best for: Multi-location businesses, retail environments, distributed teams
Contextual dashboards adapt data map out the trends of a specific business location, department, or moment. Instead of showing one universal view, these dashboards adjust based on where the screen is located or what’s happening in that environment.
For example, you might use contextual dashboards to display things like:
- Store-specific sales performance
- Location-based inventory levels
- Regional weather or demand impact
- Time-of-day activity trends
What dashboard integrations exist for digital signage?
The most important step in a successful dashboard integration is selecting tools that make data integration easier. This means opting for a digital signage platform that supports multiple complex systems form various sources, like:
- Trello
- Asana
- Klipfolio
- Signal FX
- Microsoft OneDrive, Sharepoint, and Power Apps
But this is just a small piece of a much bigger puzzle. There are dozens of other databases that you should be able to connect with quickly.
Below are some of the most popular integrated systems you can connect with a high-qaulity digital signage platform:
Microsoft Power BI
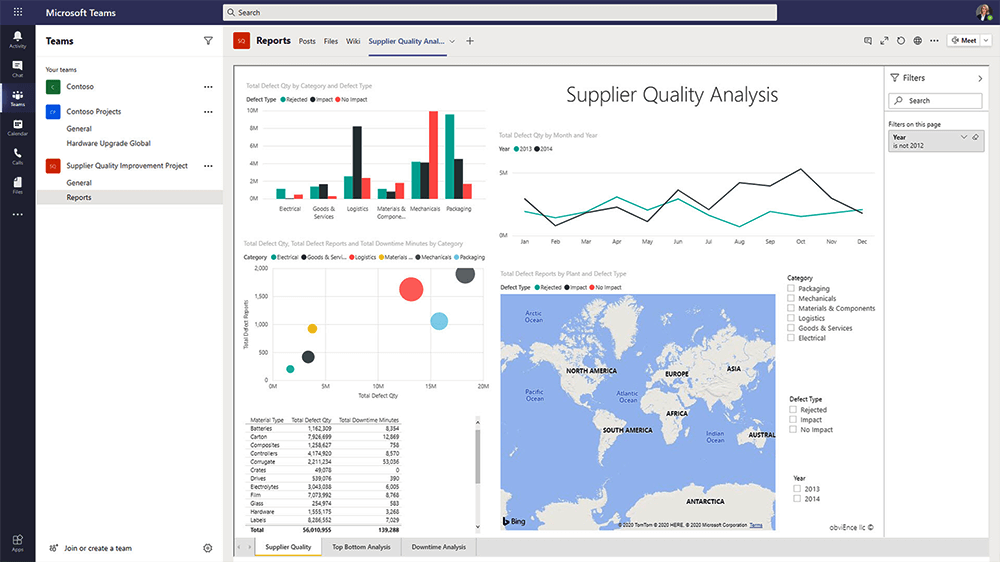
Power BI is the quintessential business intelligence app for professional service industries, and no wonder. It’s a fairly expensive platform, sure, but comes with many features your business may need for essential reporting tasks, like Power Query, DAX, and calculator groups.
Learn more about setting up dashboard integrations via Power BI with Fugo.
Grafana
Grafana is a favorite among IT, DevOps, and infrastructure teams, since it offers plenty of real-time monitoring tools. It connects to a wide range of other data sources and is commonly displayed in NOCs (Network Operations Centers), SOCs (Security Operations Centers), and internal IT environments.
Learn more about setting up dashboard integrations via Grafana with Fugo.
Tableau
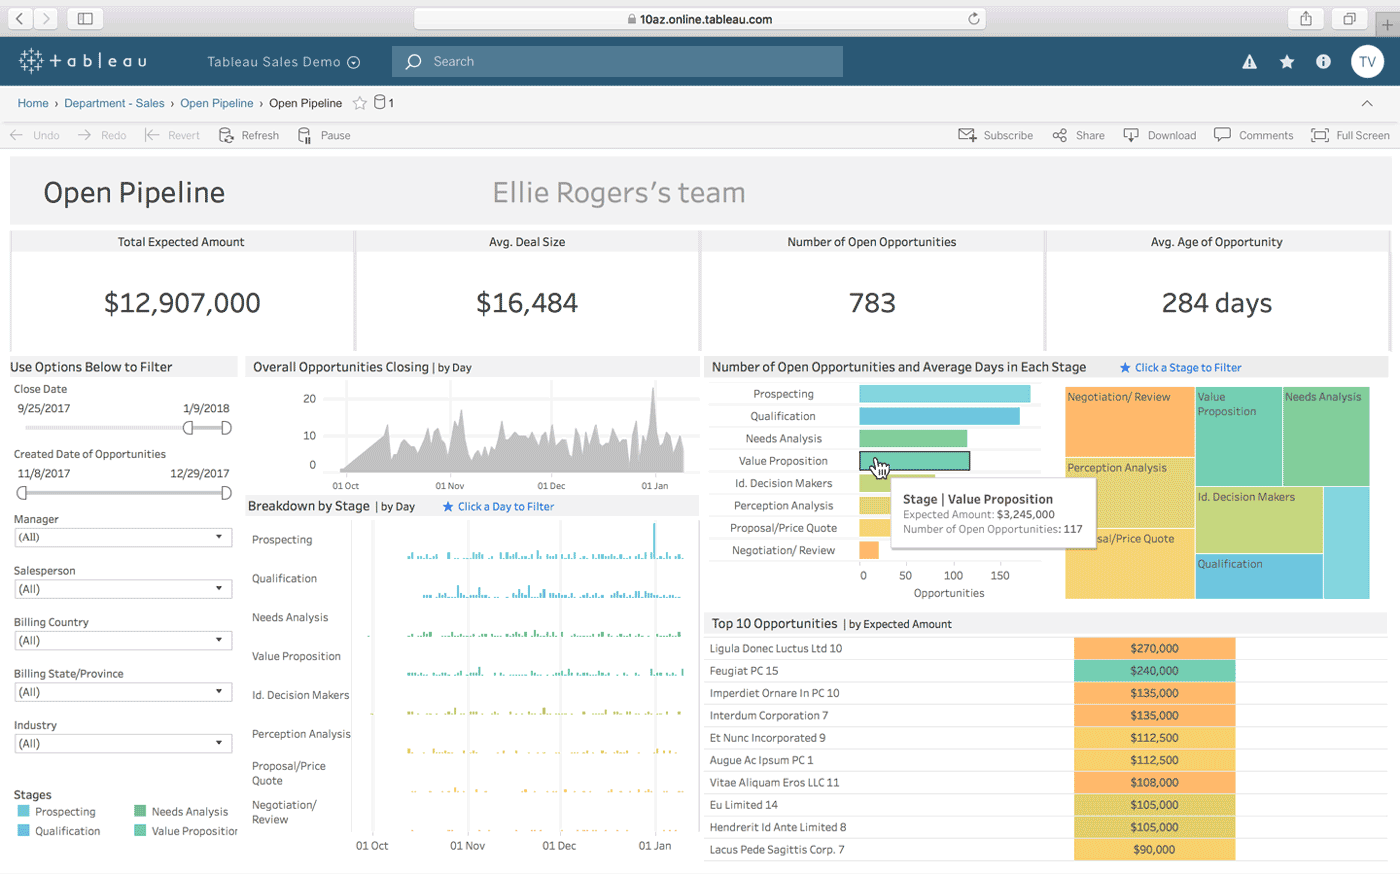
Tableau is probably best known for its highly interactive dashboards, which lets users create and tell visually appealing stories with data alongside other tools. It’s easy to create new visualizations in seconds, which is great for answering questions on the fly during managerial meetings.
Learn more about setting up dashboard integrations via Tableau with Fugo.
SAP Analytics Cloud
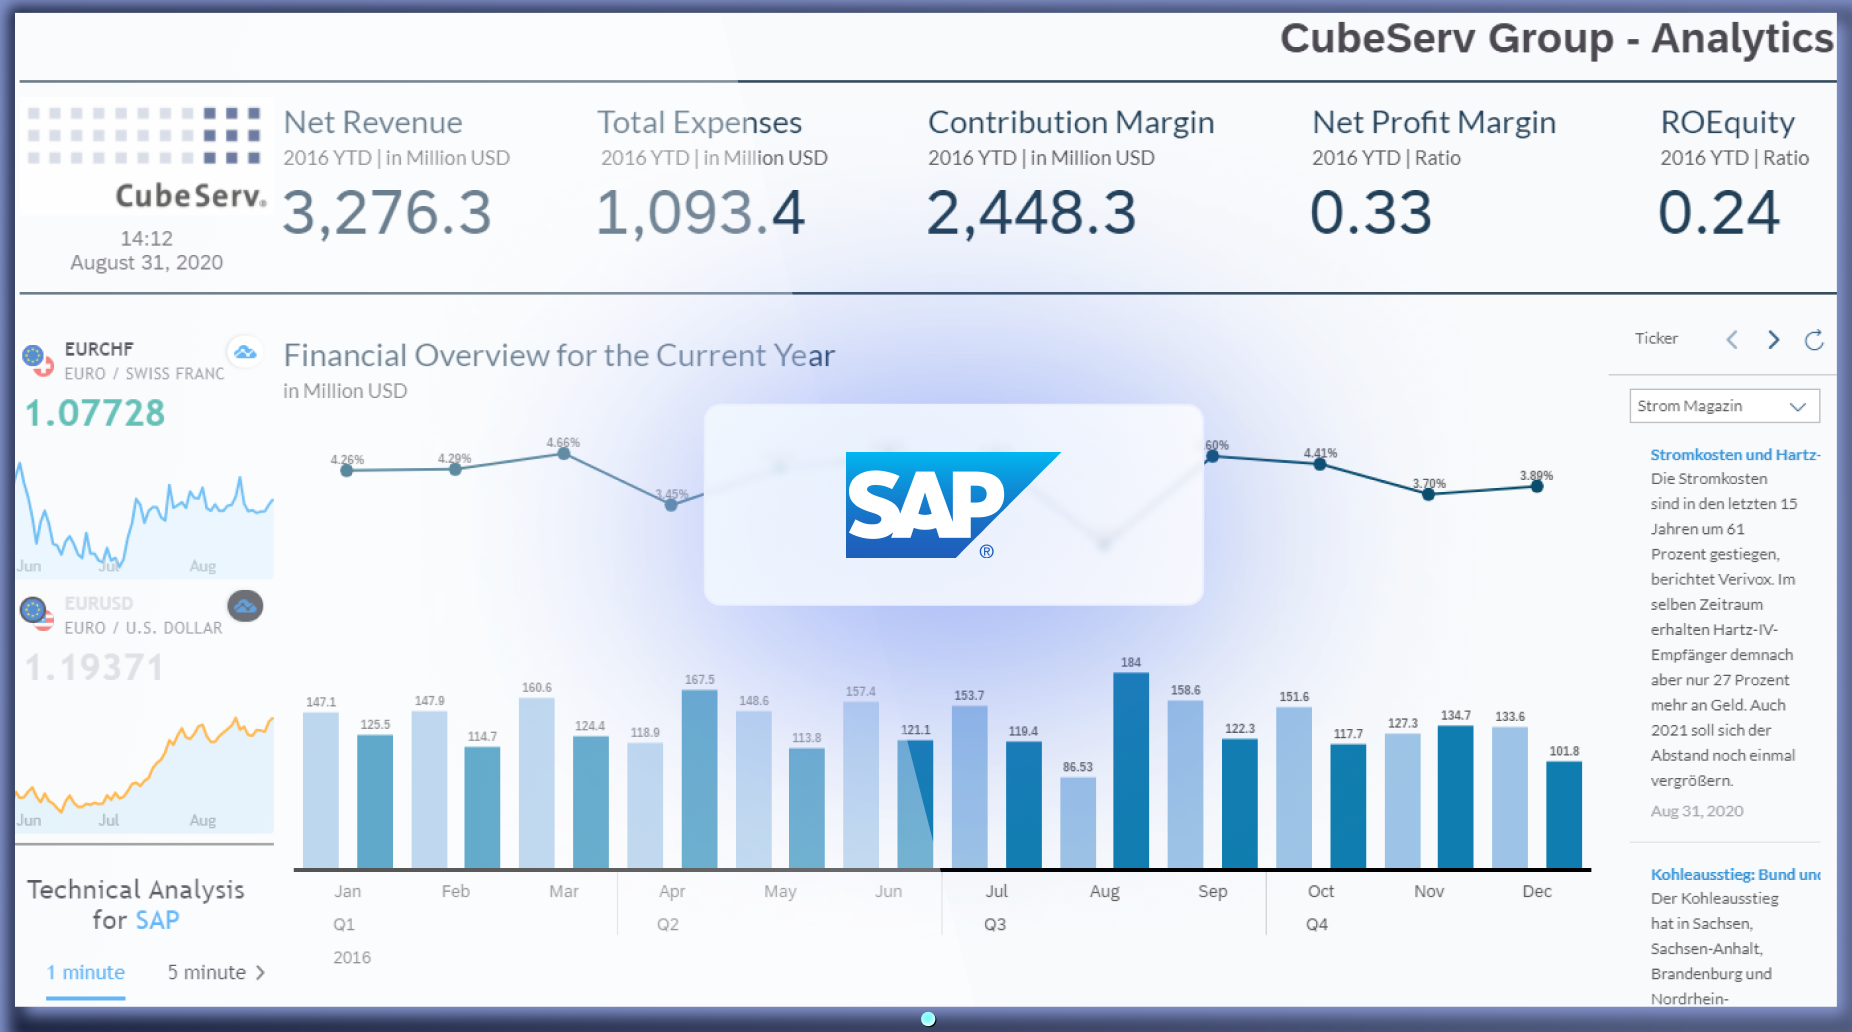
The SAP Analytics Cloud was designed for large enterprises needing integrated planning, business intelligence, and predictive analytics. It’s typically used within financial settings — think supply chain analytics and financial forecasting — and an excellent choice for organizations already invested in SAP infrastructure.
Learn more about setting up dashboard integrations via the SAP Analytics Cloud with Fugo.
Looker
Looker is now part of Google Cloud and offers one of the best things a business owner could ask for: a free price tag. It’s free to use, share, and create on the cloud. It also lets you tap into more advanced analytics for customizable data modeling and self-service analytics.
Learn more about setting up dashboard integrations via Looker with Fugo.
Zendesk
Zendesk is primarily a customer and employee service app, although it also comes with customizable dashboards so you can keep an eye on customer support performance and service operations. This is a great option for teams already using Zendesk who want to monitor service health without digging through reports.
Learn more about setting up dashboard integrations via Zendesk with Fugo.
Jira
Jira dashboards are widely used by software development and product teams wanting to track sprint progress, backlog health, and issue resolution. That said, it’s not the only tool out there for ITSM. We cover a few options in this guide to Jira alternatives.
Learn more about setting up dashboard integrations via Jira with Fugo.
HubSpot
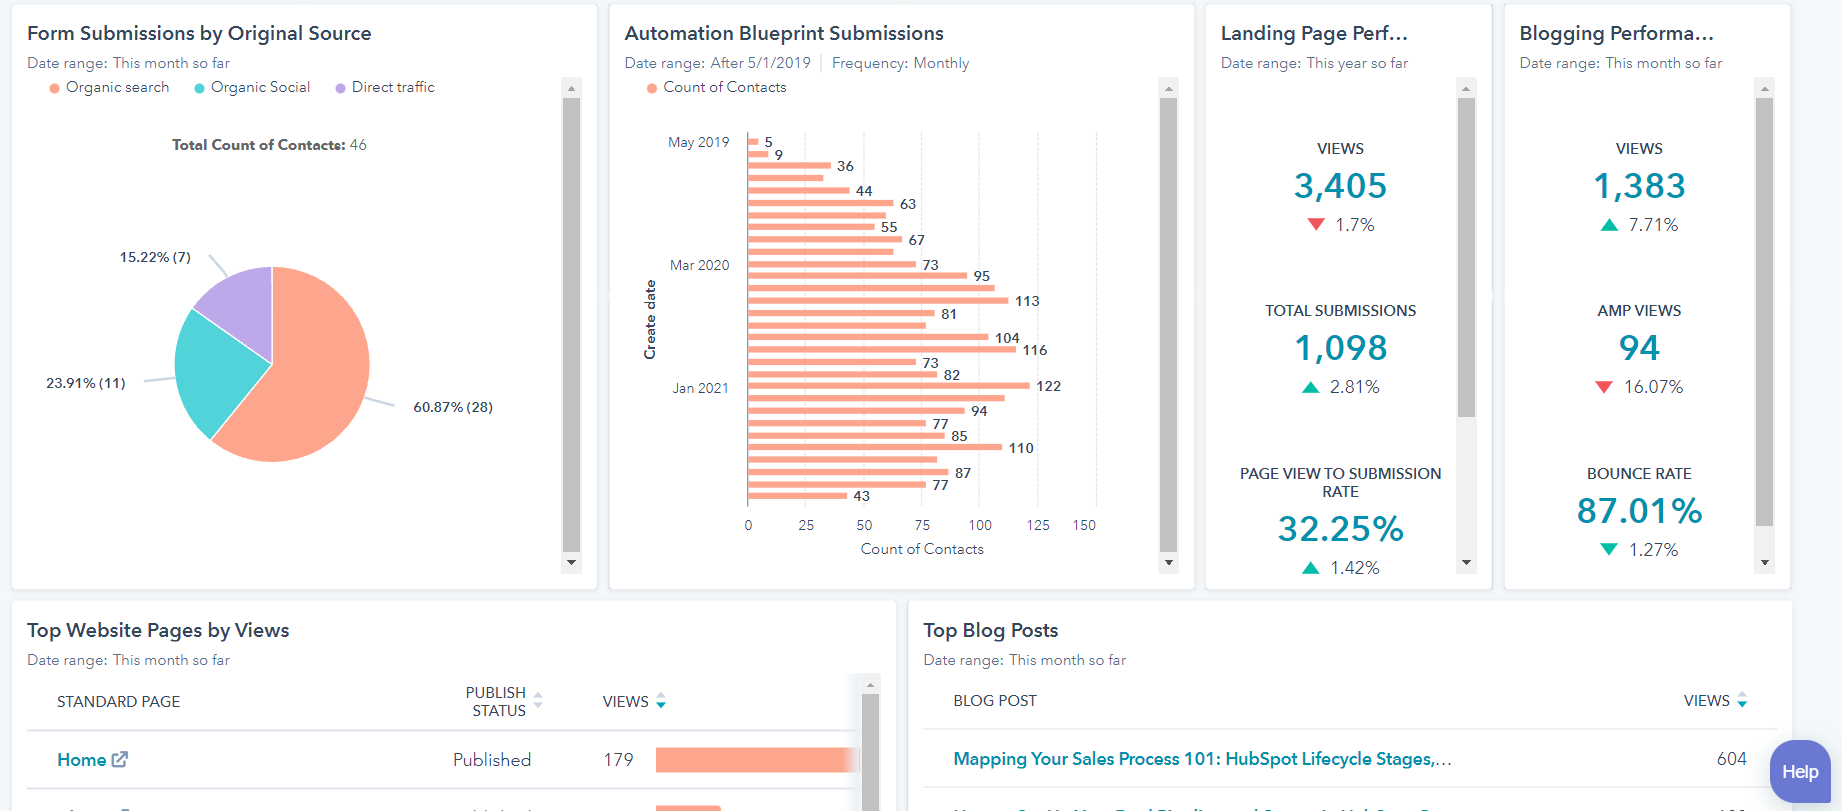
HubSpot’s dashboards are big among marketing and revenue teams who track funnel performance and campaign effectiveness. Not only can you monitor things like campaign ROI while live, but you can also loop in your sales teams by tracking KPIs like pipeline value.
Learn more about setting up dashboard integrations via HubSpot with Fugo.
P.S., wondering if HubSpot isn’t the right system for you? Explore your options in this guide to HubSpot alternatives.
Salesforce
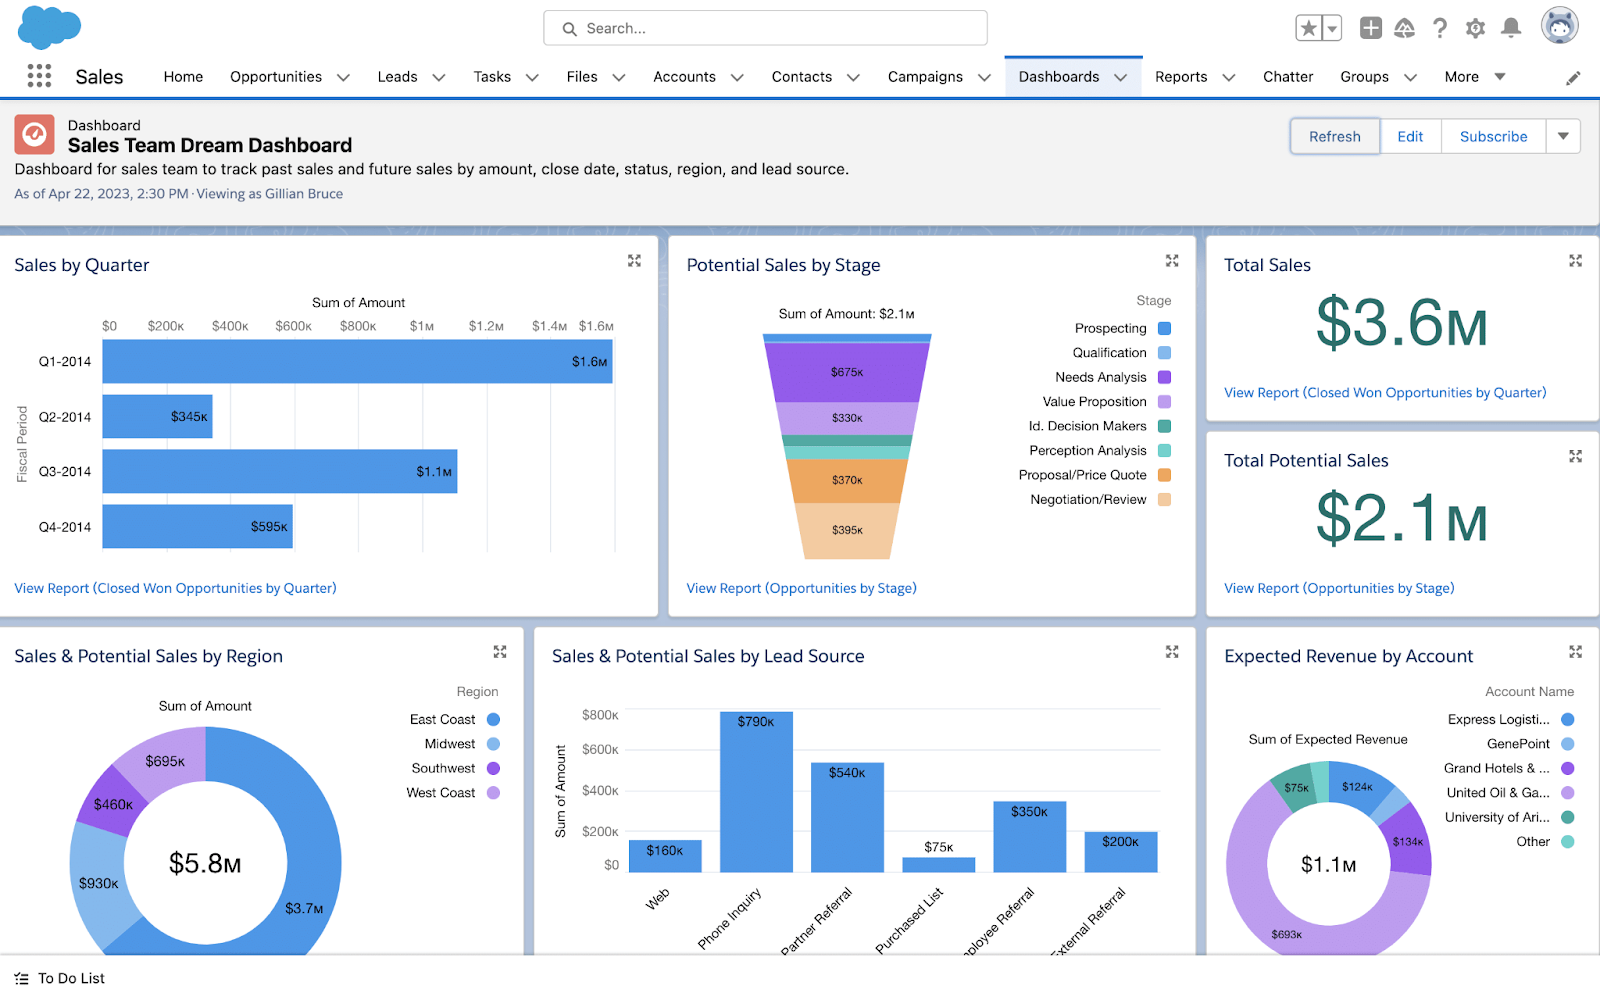
Salesforce dashboards are a staple in enterprise sales environments (emphasis on sales). Unlike HubSpot, which is slightly more marketing-focused, Salesforce fills in the sales niche with real-time data for revenue targets, rep performance, and regional sales comparisons. Also works great for sales gamification strategies. 😉
Learn more about setting up dashboard integrations via Salesforce with Fugo.
P.S., not really enjoying your Salesforce dashboard instance? Here’s a simpler alternative to Hoopla Salesforce Dashboards.
💡Keep in mind: Some digital signage dashboard tools allow you to combine multiple data sources into the same screen. Fugo, for example, lets you decide which sections of your dashboard(s) you want to display at any one time. That way, you can combine multiple real-time dashboards into the same screen for faster decision-making and more organized displays.
You can also use Fugo to loop multiple dashboards together in a playlist. This acts like a slideshow that automatically scrolls from one dashboard to the next. You can even control the length of each dashboard display before it transitions to the next.
Best practices for dashboard integration with digital signage
Now that you’ve narrowed down which data sources make sense, how do you make the most of your dashboard integrations with digital signage?
Below are a few helpful tips and tricks for optimizing your real-time data sources:
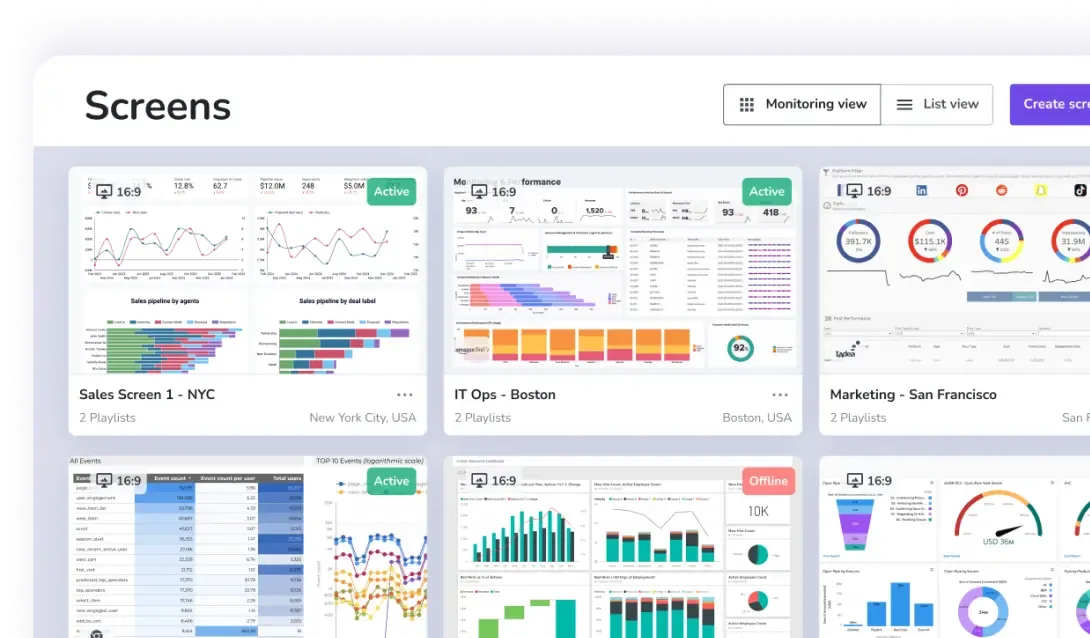
Organize your dashboards so nothing falls through the cracks
Creating a data dashboard is work enough. But making sure nothing calls through the cracks is another step entirely.
The best way to avoid this is to organize your dashboard integrations with digital signage inside your CMS so you don’t lose track of important screens.
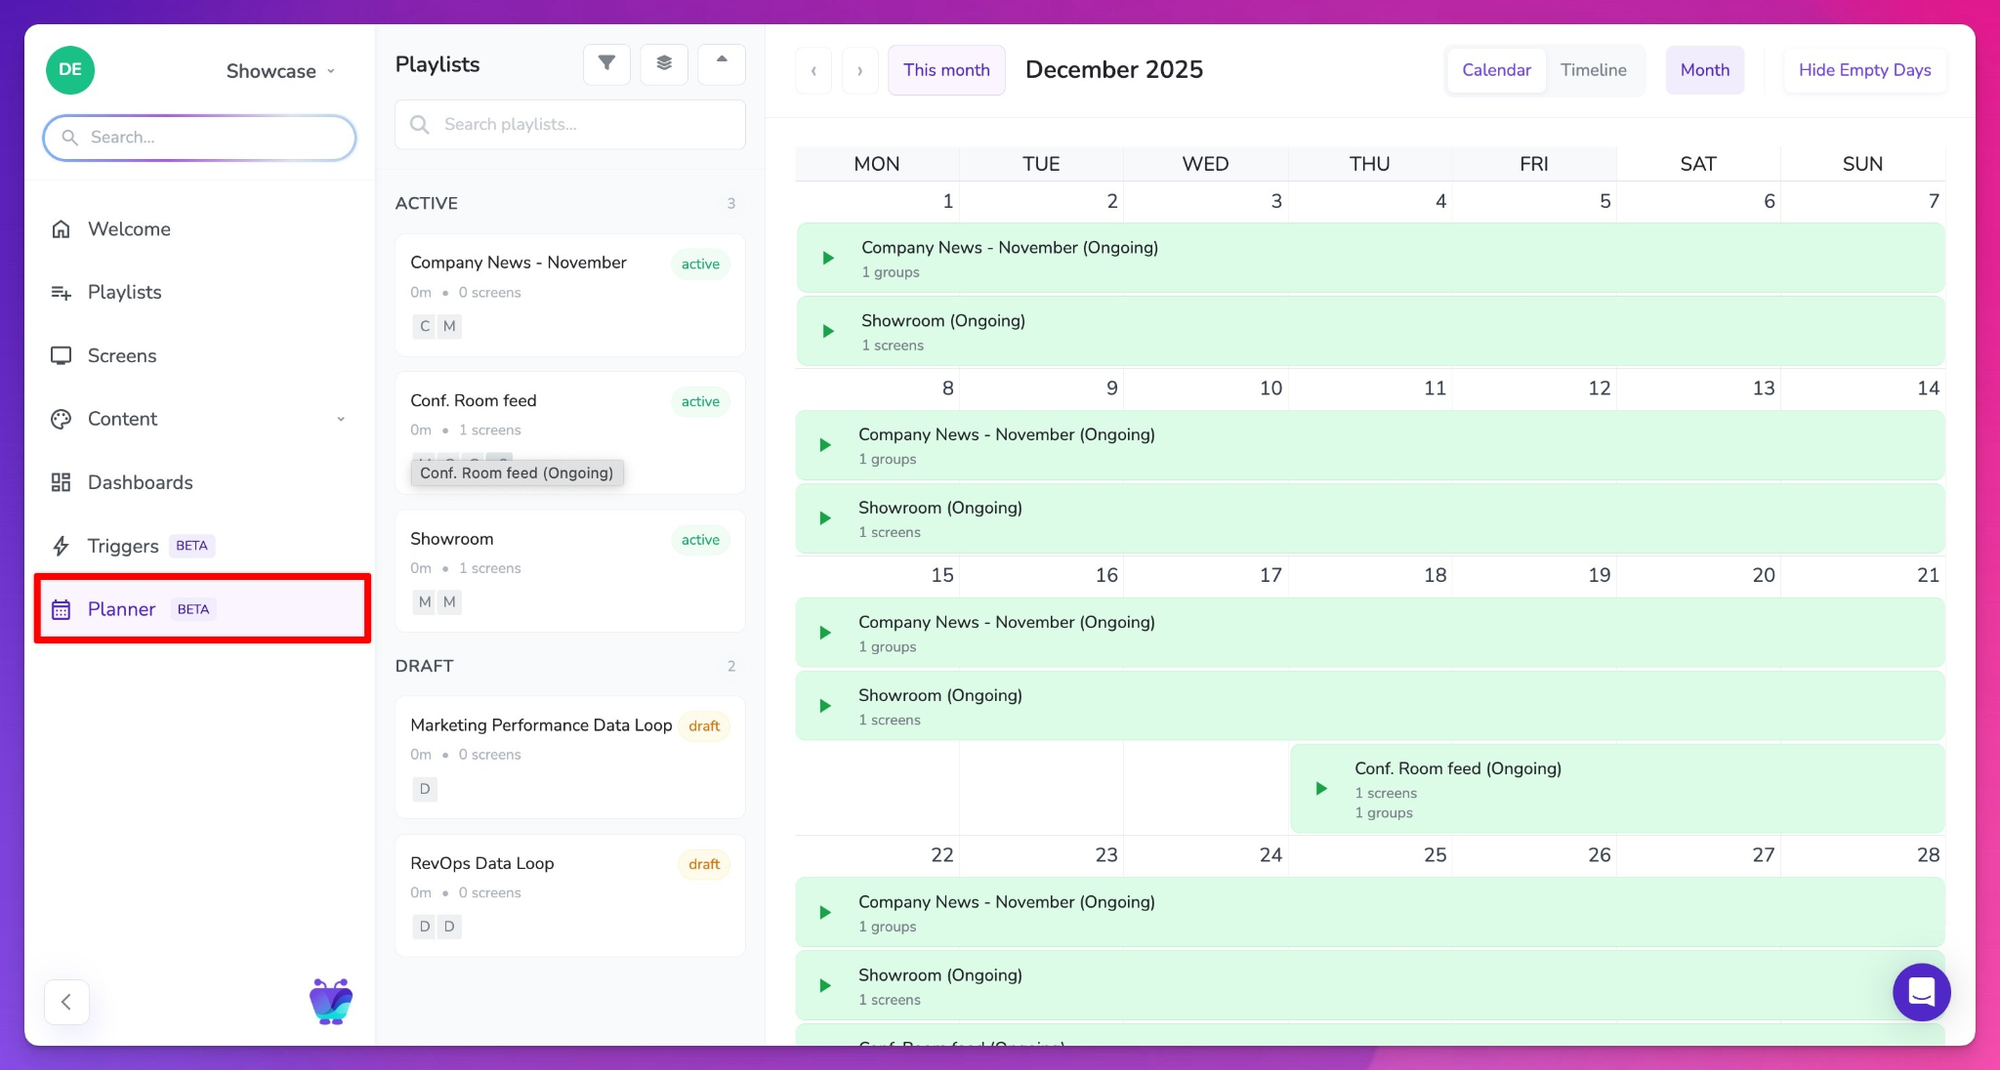
For example, you can use tools like Fugo’s Planner to schedule dashboard content across screens in a calendar-based view. That way, instead of manually rotating dashboards, you can schedule different dashboards by time of day, assign content by shift or region, and even pre-plan campaign or reporting windows so your team doesn’t have to remember specific dates.
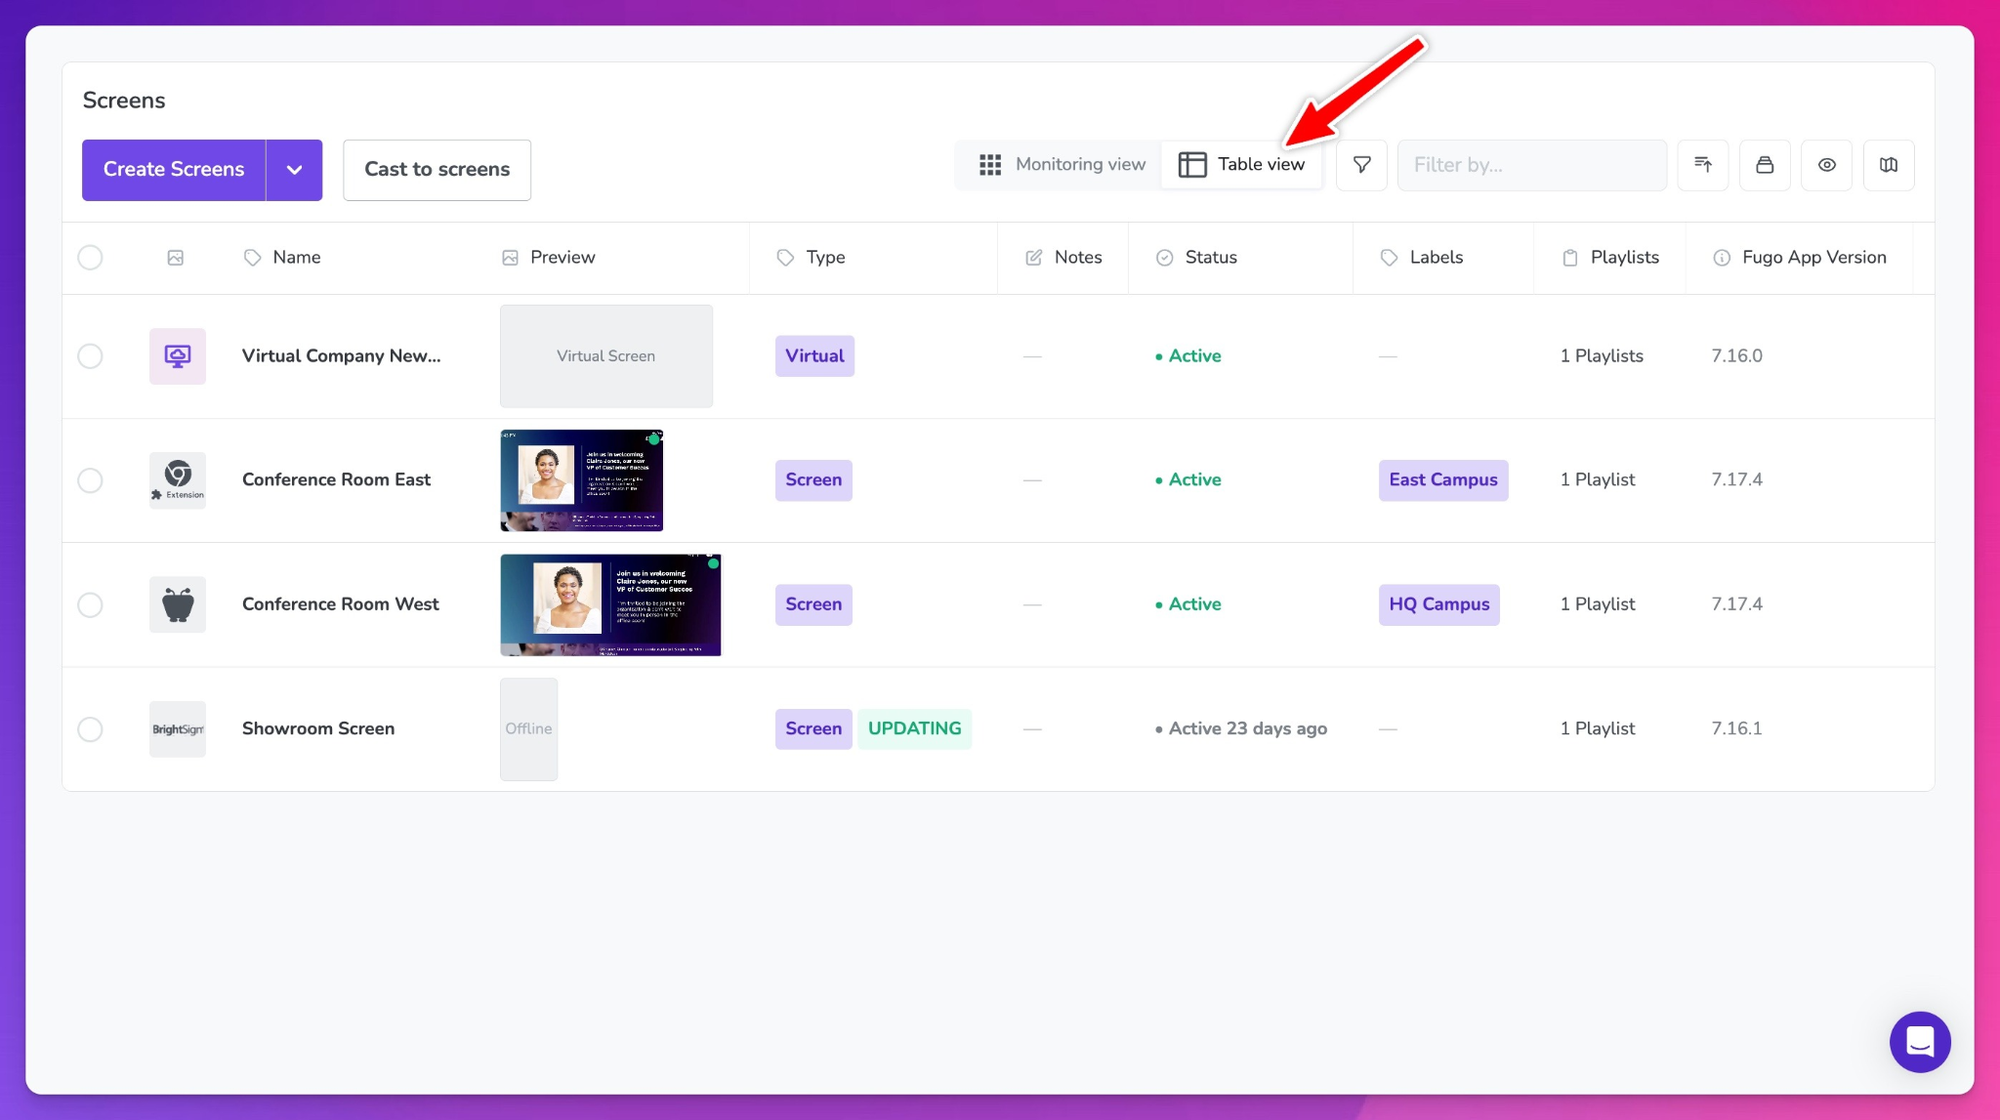
There’s also a table view of screens that lets you review your entire dashboard network at a glance. Instead of clicking into each dashboard individually, you can:
- See screen status and connectivity
- Identify what content is playing
- Quickly spot offline or misconfigured devices
- Bulk-manage screens according to your business needs
You can also create screen labels to group displays logically by location, department, region, or function. Labels make it easier to avoid publishing sensitive dashboard data to unintended screens. They can also help you apply automations selectively, which we’ll get into later on.
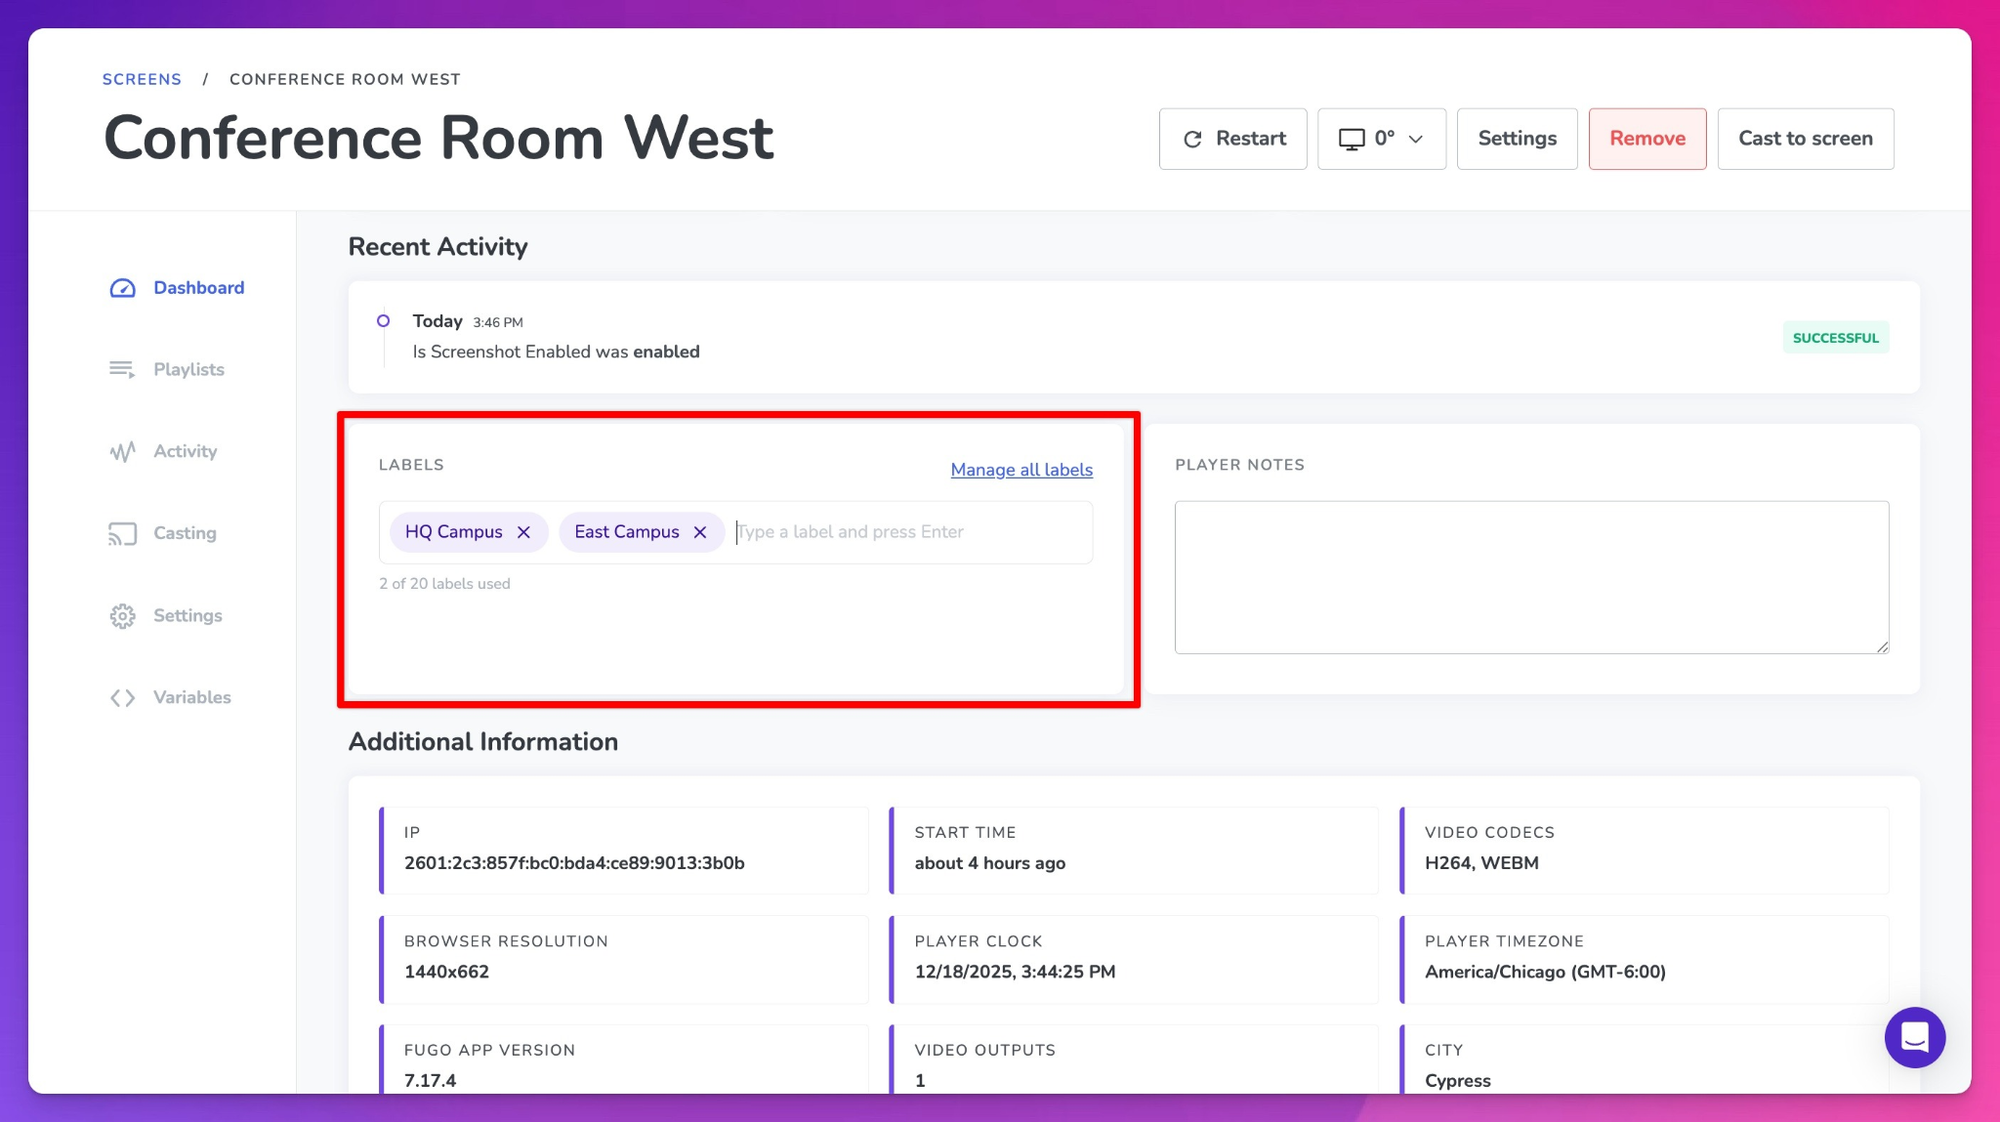
These allow you to quickly locate specific screens in question and ensure they’re displaying your data sources as intended.
Standardize what company dashboards should look like
Different fonts, inconsistent layouts, cluttered visuals, or overcrowded KPIs can make your dashboard much harder to read. In a worst-case scenario, it may not even be visible at a distance… which is sort of the point for dashboard integrations with digital signage.
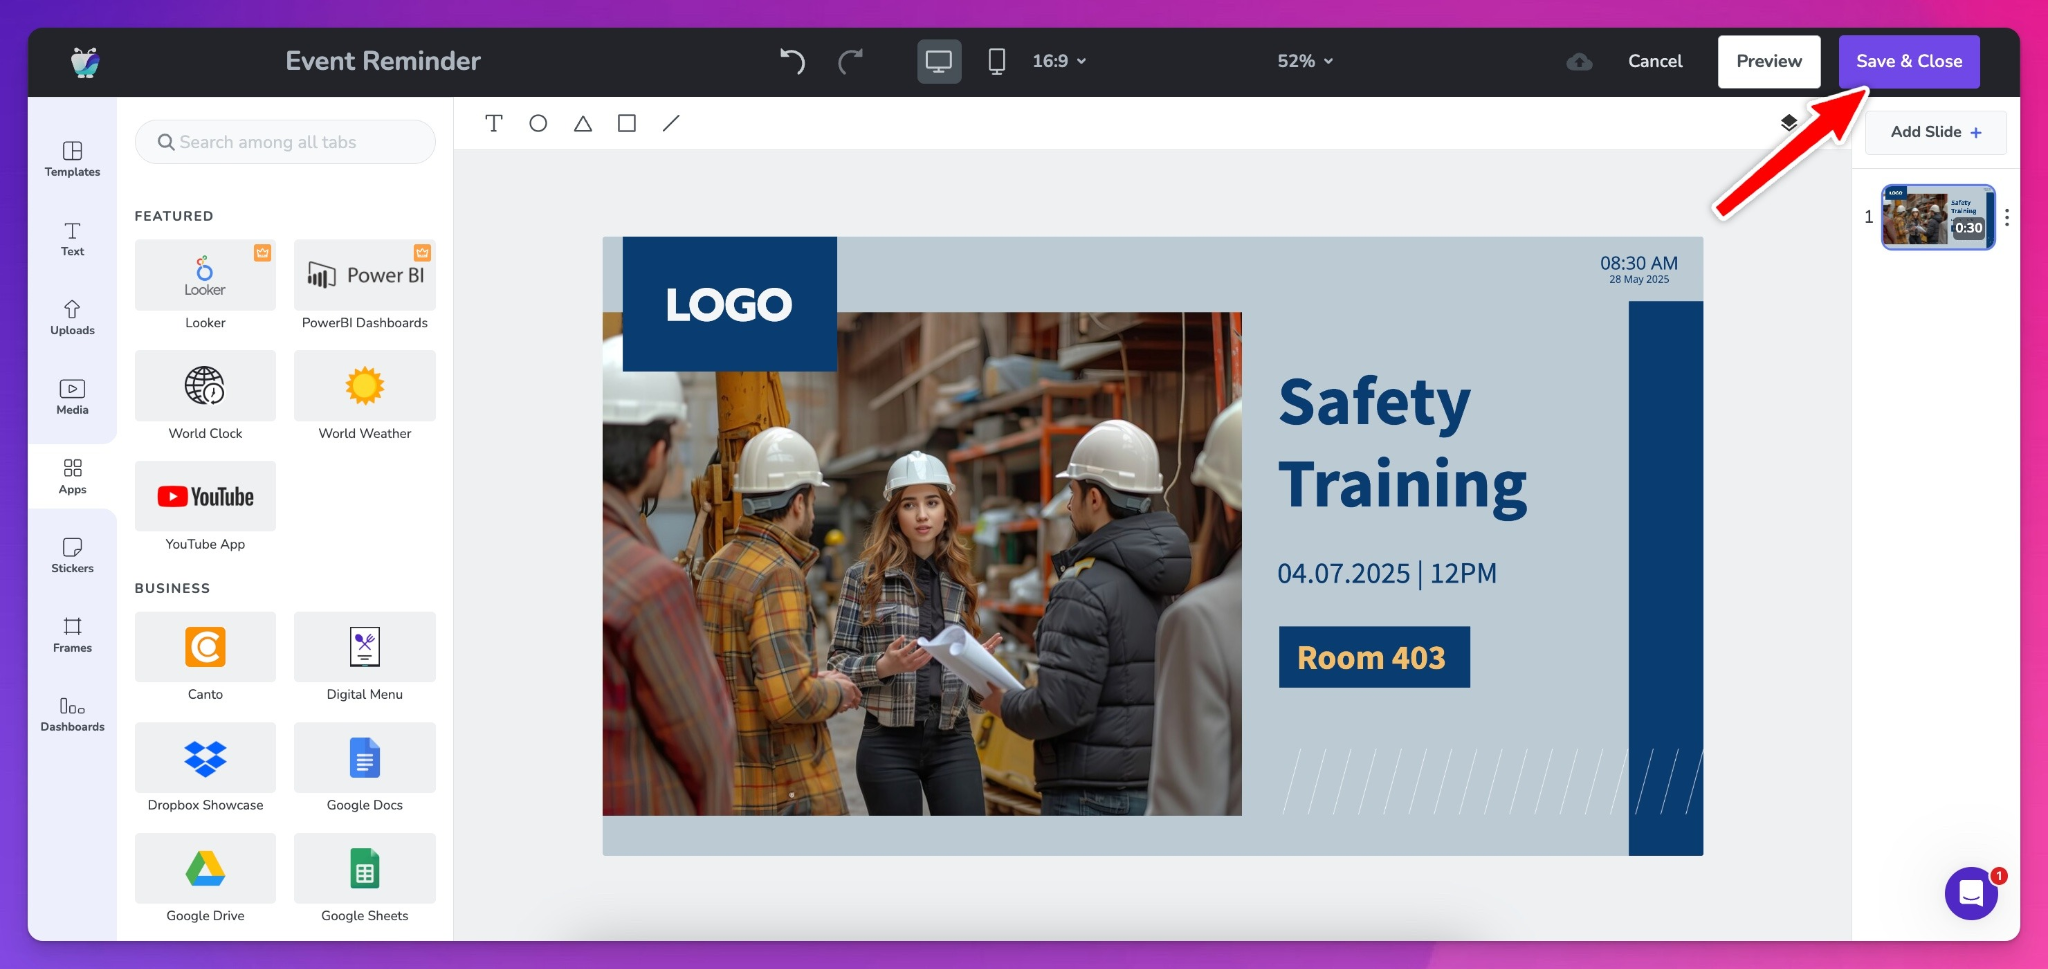
The ability to create lockable Company Templates can help you fix this issue by standardizing layout and branding across all dashboard displays. First, decide on the elements each dashboard integration should have, like your company logo, or specific color patterns. Then, you can lock these design elements and predefine zones for data, alerts, or specific photos.
This prevents business teams from reinventing the wheel and wasting time on design when they could be focused on data quality.
Need some inspiration for designing a company template?
Start with one of our hundreds of free digital signage templates available here.
Automate as much as you can
The real power of dashboard integrations is the ability to automate what happens with your dashboards, and not necessarily just to display your numbers on a big screen.
Player variables, for example, let you set unique playback settings that change your dashboard display depending on specific conditions, dates, or triggers.
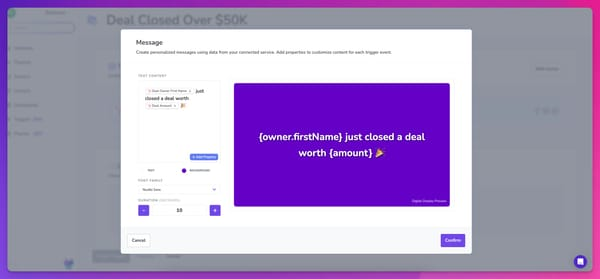
You can also use Triggers to automate when dashboard content appears. That way, you don’t need to manually display data unless the situation calls for it.
Let’s say you want to celebrate your sales rep’s performance by linking deal stages in HubSpot to a Trigger that displays a celebratory dashboard moment across sales floor screens. That way, the next time your reps sign on a new client, you can display a message like, “New Closed Won Alert.”
Keep in mind that AI may also have a piece of the puzzle. And while it’s still finding its footing in the digital signage world, there are plenty of applications within dashboard integrations. Like:
- Generating a fully designed data dashboard via voice prompt (no manual input needed)
- Provide layout and formatting suggestions according to your business standards
- Spot opportunities to integrate multiple dashboards and spot trends you might have otherwise missed
Learn more about Fugo’s AI beta program.
Common mistakes to avoid with your dashboard integration
You’re just about ready to get started with dashboard integrations.
But before hopping off the diving board, make sure you have everything you need to get the job done right.
So, please DON’T:
- Treat your dashboards like digital posters. There’s much to be said for digital signage posters, but turning large datasets into a single screenshot might prevent your team from gathering real-time insights. That’s why digital signage plays so much of a role in aligning your frontline teams. Make sure you set up a genuine real-time integration with updated data every five, 10, or 60 minutes, depending on your organization’s needs.
- Overload your screens with too much data. Too much data in one place can be confusing to users, if not overwhelming, which makes it harder to spot trends. A better solution is to focus on organizing your data into small chunks that make sense on individual screens. For example, one screen can house your revenue goals and what percent has been met for this quarter. Another could be a sales leaderboard dashboard with a lineup of everyone on your sales floor.
- Ignore feedback from your team. This is one of those instances where no news isn’t always good news. Instead, proactively ask your team for feedback on your data dashboards so you can get a better idea of performance improvements. For example, maybe your support team asks if you can add new data sources, like the number of tickets in the queue versus tickets resolved. Or maybe you only need to resolve simple operational errors (think font sizes and color schemes) so employees can read your dashboards at a distance.
And instead, DO:
- Decide on ownership early on. Who owns each data source in your lineup? And who owns the dashboard integration itself? Everyone on your team should know exactly who’s in charge of what so they can get in touch with the right people whenever issues arise. You can even break this down in terms of function (i.e., who updates metrics, who validates data, etc.).
- Audit your dashboards on a regular rhythm. This might be weekly, monthly, quarterly, or yearly, depending on how often your datasets change. But regardless of the cadence, don’t forget that this is a critical step to ensure data quality and the usability of your existing data sources.
- Keep it simple, silly. There’s always a temptation to add fun background images to your dashboard, or add funny fonts or colors to emphasize a point. But remember: sometimes, creativity is more distracting than enjoyable. And if your users struggle to understand what they’re seeing on screen, your integration efforts might be for nought.
No need to take my word for it, though. Learn more about the major dashboard design mistakes to avoid.
How to choose the right dashboard integration for your business objectives
You can choose just about any digital signage platform or dashboard provider to create a TV dashboard. But picking the best option versus an okay option comes down to your evaluation process.
So without further ado, here are some questions to ask before integrating your data dashboards with digital signage platforms:
✅ Do you actually need a data dashboard, or could you rely on screencasting? Screencasting works great for simple data formats like Excel documents, Google Sheets, and other metrics that aren’t what you’d call ‘complicated.’ But if you have sensitive data that must remain behind a login, you’ll need a dashboard integration that can capture information securely. With Fugo, you can even set up on-premise dashboards that display sensitive information within your own network. This ensures you don’t expose essential credentials across your internet connection.
✅ Which organizations or teams need which integrations? Do you actually need multiple integrations? Or can everyone in your organization (sales, marketing, warehousing, etc.), rely on existing systems? Remember: you’ll want to match the tools in your stack to your teams and environment. If it’s possible to set up a simpler workflow for your data dashboards, that’s likely your most efficient option.
✅ What’s the price of your dashboard integration? With the right digital content management system (CMS), you shouldn’t have to pay extra per platform just to set up a dashboard. Fugo allows you to set up unlimited TV dashboards that refresh once per hour, starting at $30 per screen per month.
✅ How often do you need generated data? Some dashboard integrations update in true real-time fashion. Others update once per day or once every hour, depending on your needs. If you’re looking at data like revenue business goals, for example, an integration that only updates once per day might work well. But if you’re trying to stay on top of trends for lightning-fast decision-making, you may want a system that reports updates every few minutes or hours.
How to set up your first data dashboard with Fugo
With Fugo, it’s possible to set up data dashboard integrations on digital signage without acquiring technical skills or studying complicated webhooks.
After you sign up for a 14-day free trial of Fugo, you can create your first data dashboard in 15 minutes or less:
1. Configure security settings for your dashboard display.
We recommend creating a separate account in your dashboard with ‘least privileged’ access to the rest of your signage system. That means all said account can do is browse your Fugo instance; it can’t edit, change, or update anything without express consent. But you don’t necessarily have to worry about this during your initial 14-day trial. 😊
The reason for this is twofold. First, this can eliminate the risk of accidental changes made by people using said service account (especially if they’re not authorized to make said changes. Second, this can prevent people from getting backdoor access to your signage system. Either way, it plays a crucial role in maintaining both data security and business processes for your team.
2. Grab details from your dashboard’s account.
First, get everything you need to log into your account, starting with your username and password.
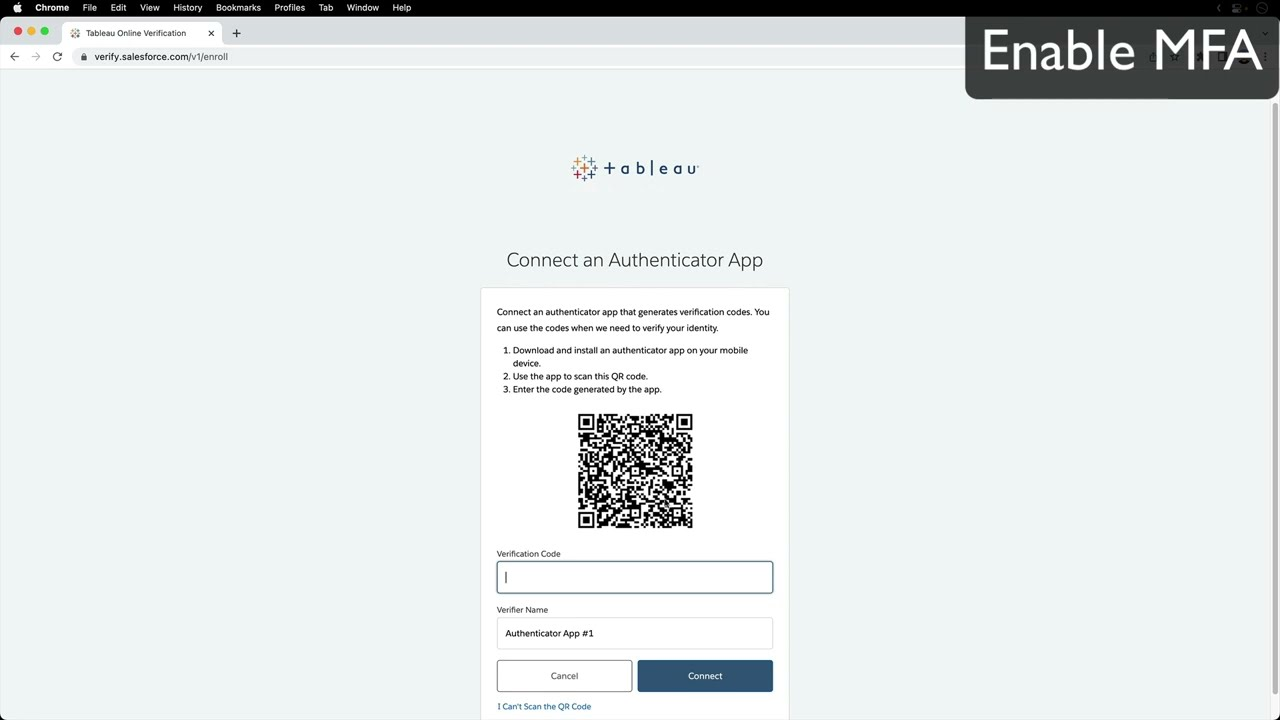
If you use SSO or two-factor authentication, you’re also going to need the Secret Key from your login service (like Okta, Google Authenticator, Microsoft Entra, etc.). Some platforms, like Salesforce and Power BI, can provide you with secret keys directly inside your account.
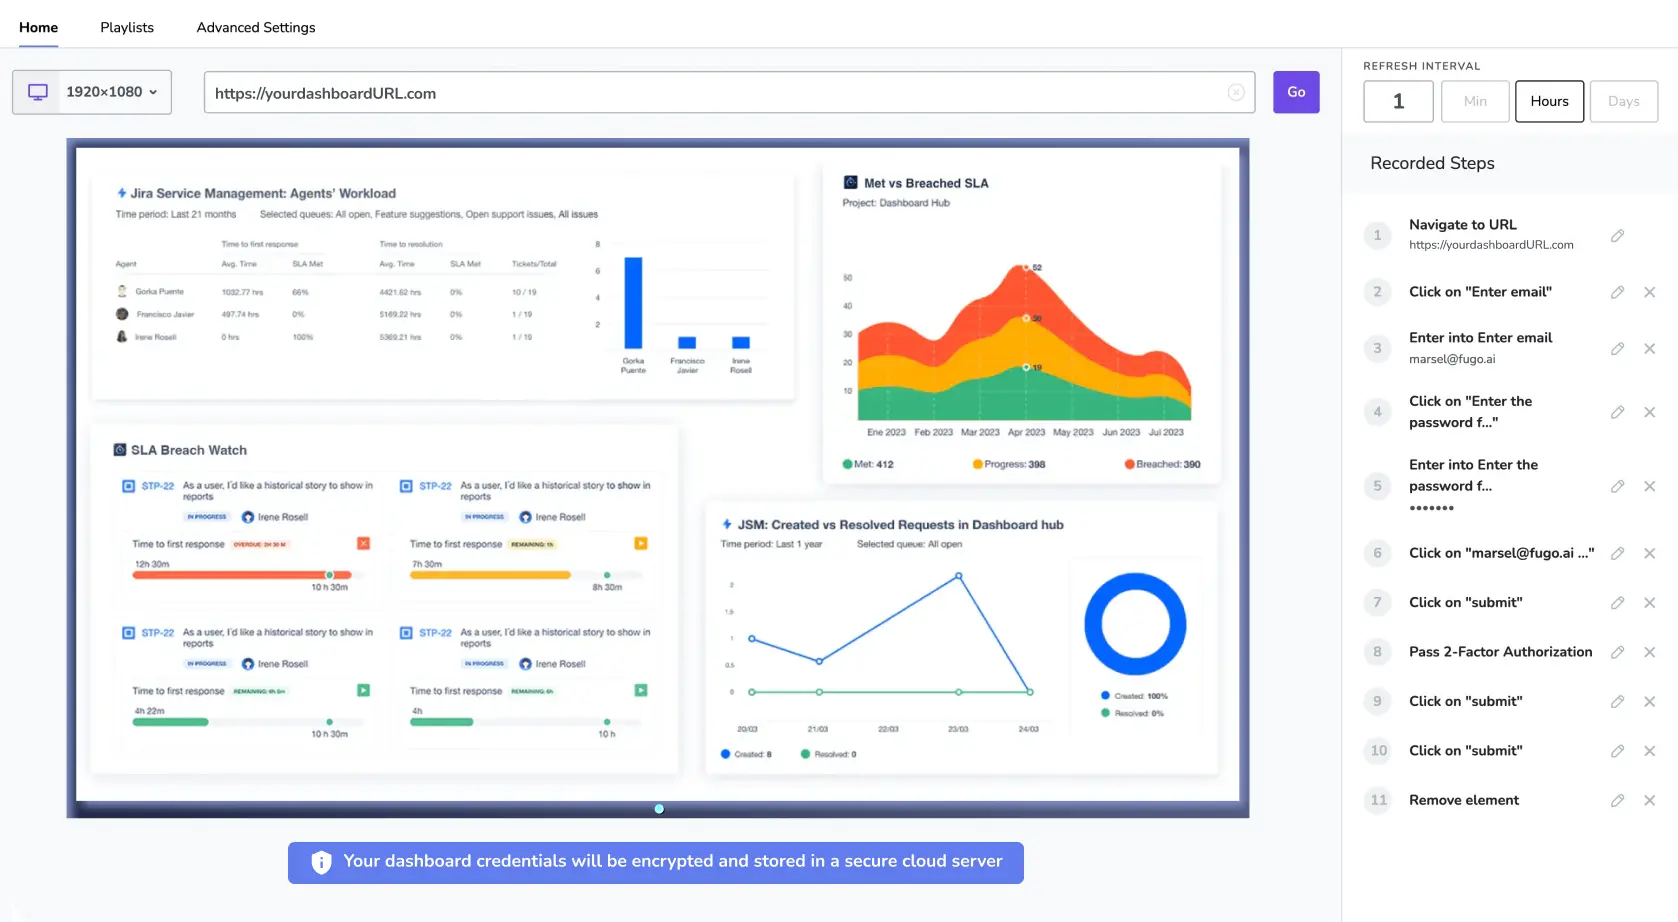
Next, grab the link to the real-time dashboard you want to display. You’ll need this to paste into Fugo’s Dashboards Step Recorder so you can capture real-time data on-screen. More on this later.
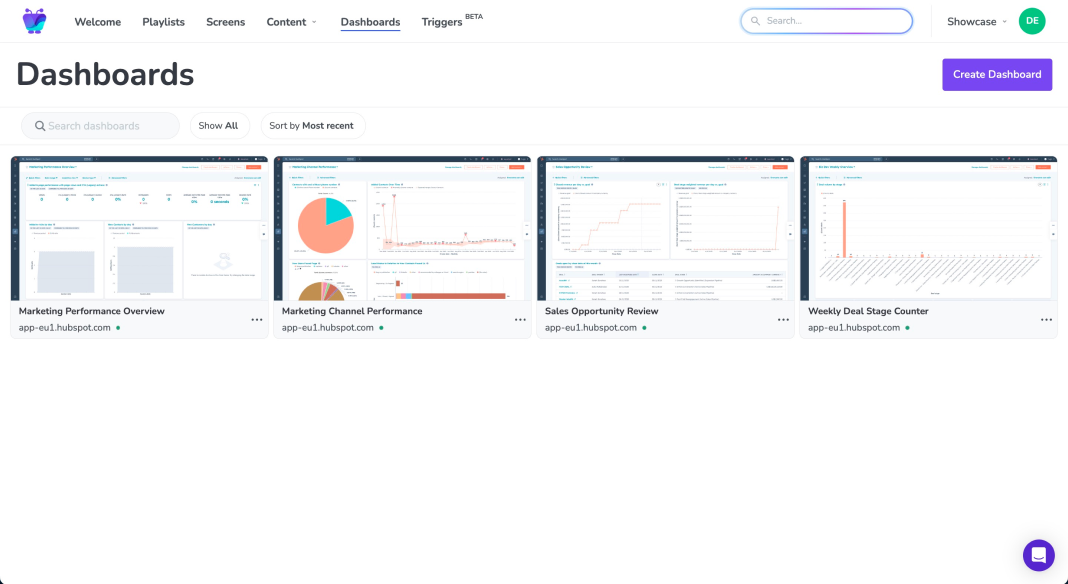
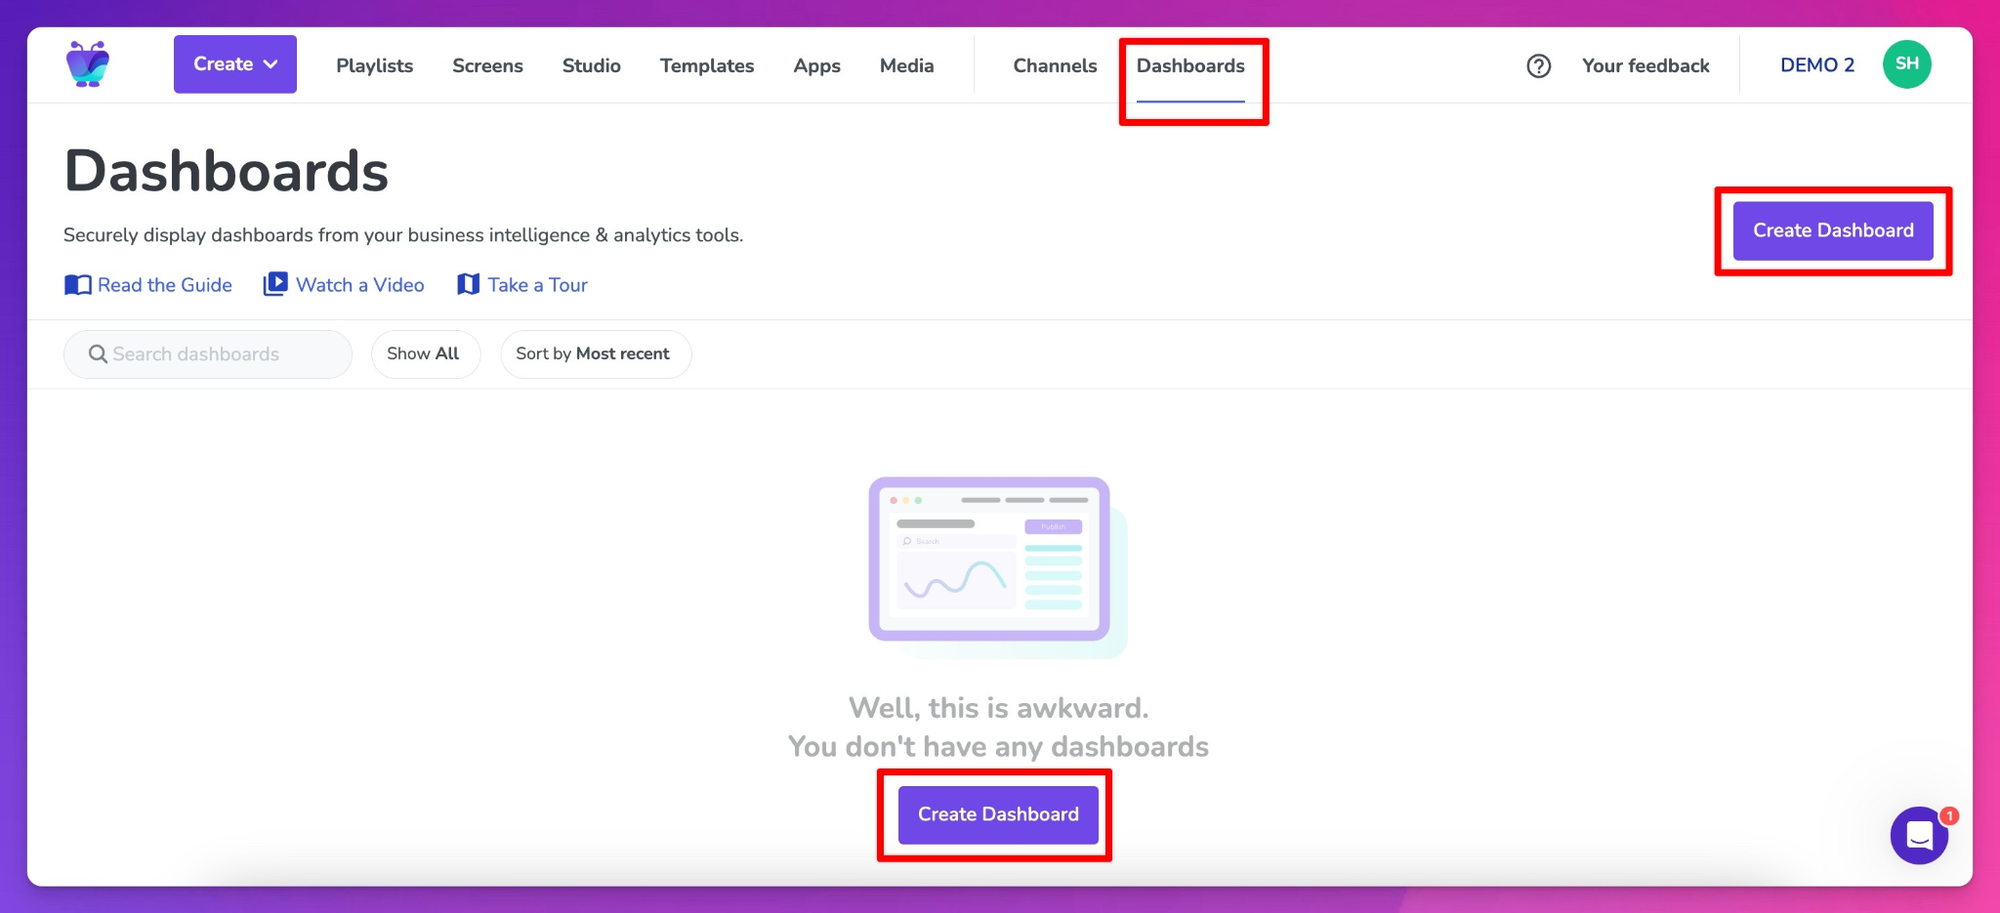
3. Create a blank dashboard.
Under Dashboards, click Create Dashboard. This will launch a new Dashboard Window.
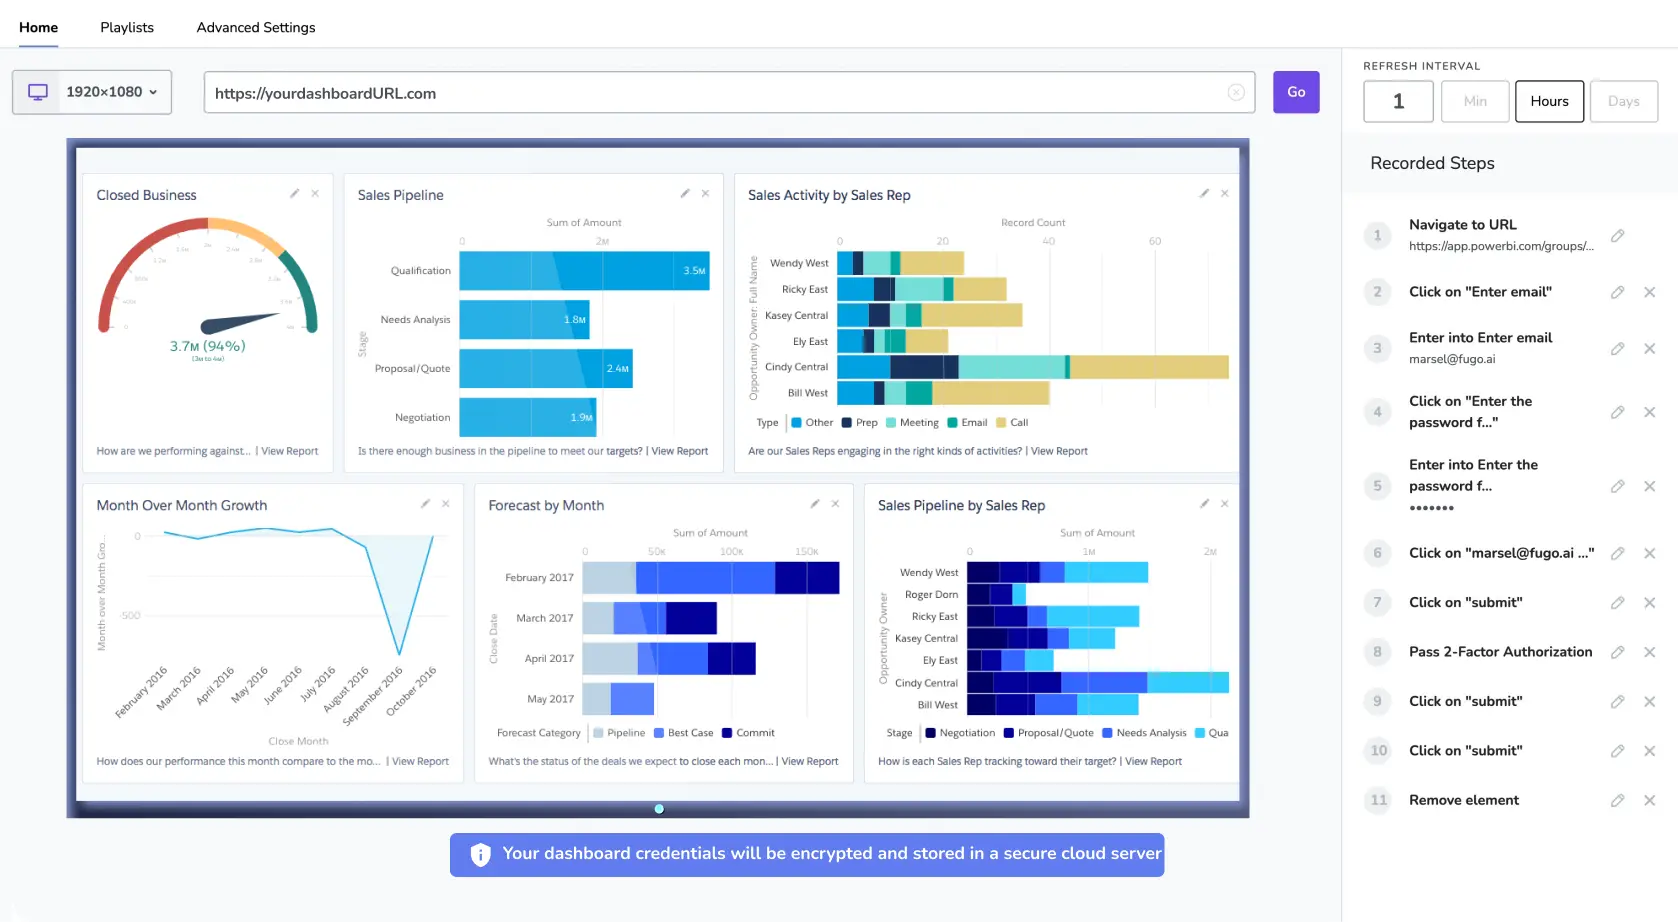
4. Enter your dashboard URL
It should look something like this:
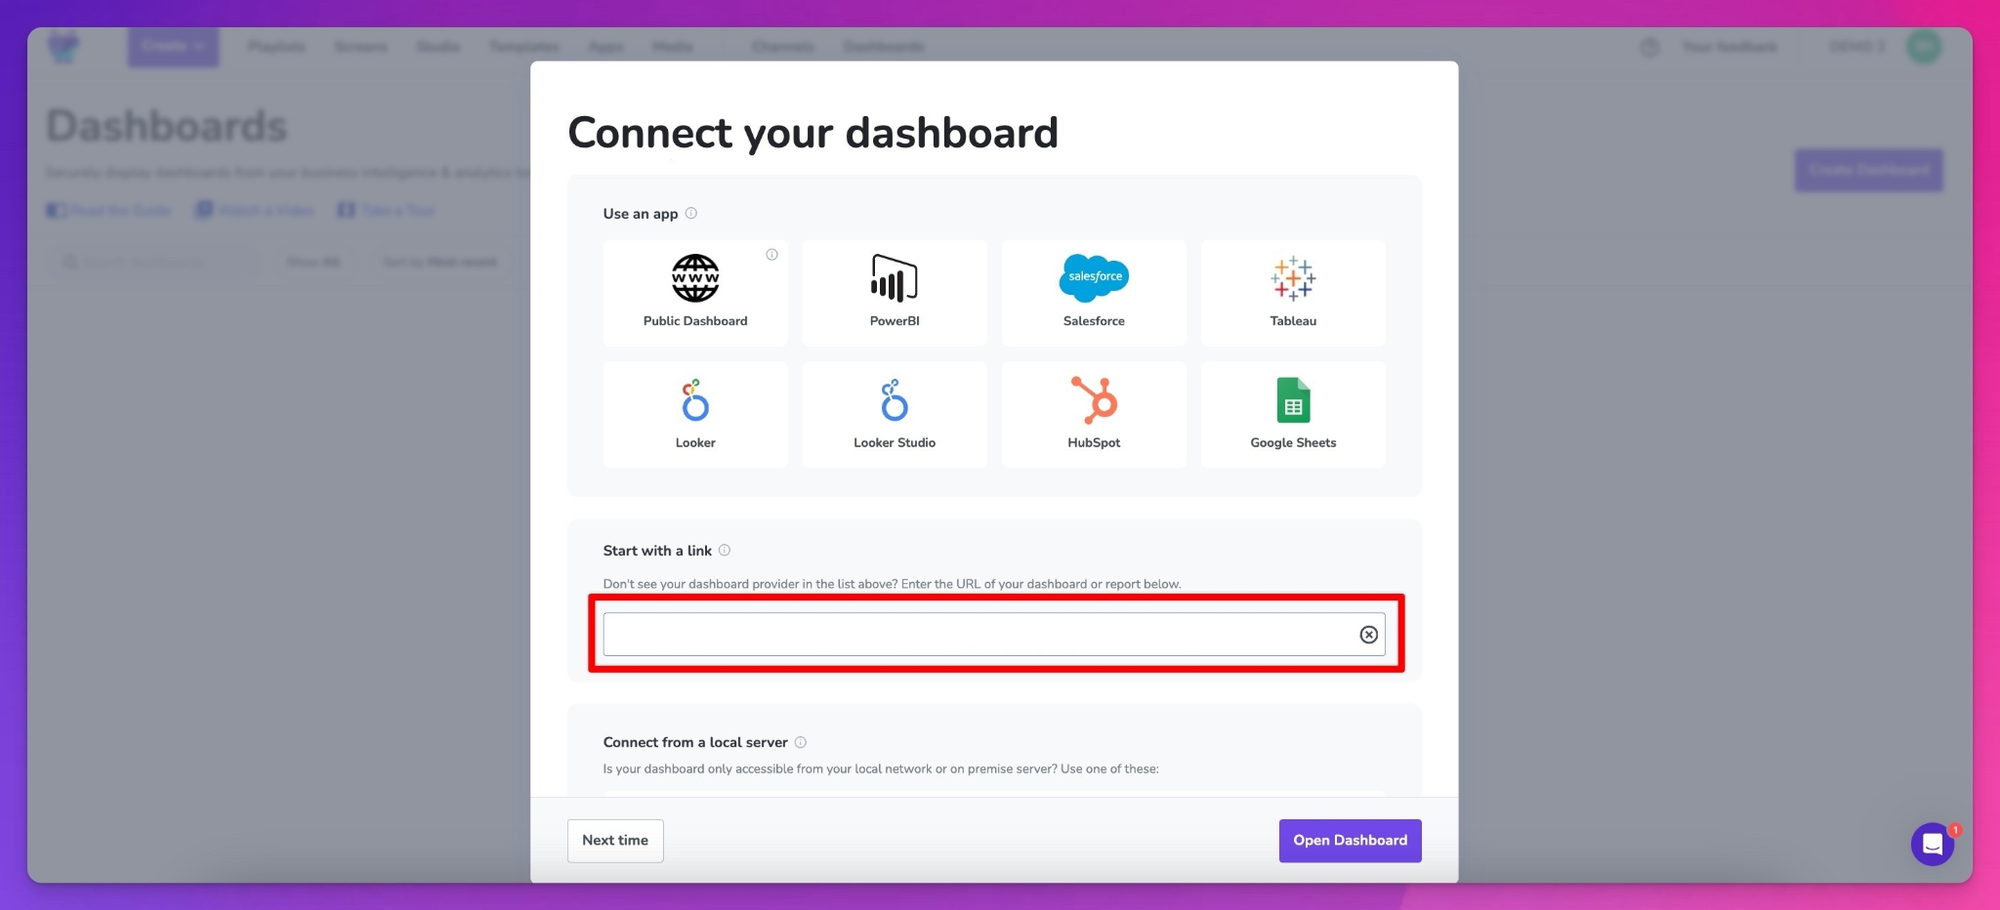
4. Configure your Chrome browser to let the Fugo recorder extension to run in incognito mode
You’ll be prompted to download the Fugo Dashboard Recorder Chrome Extension. If the extension page doesn’t open automatically, you can click the link to install it yourself.
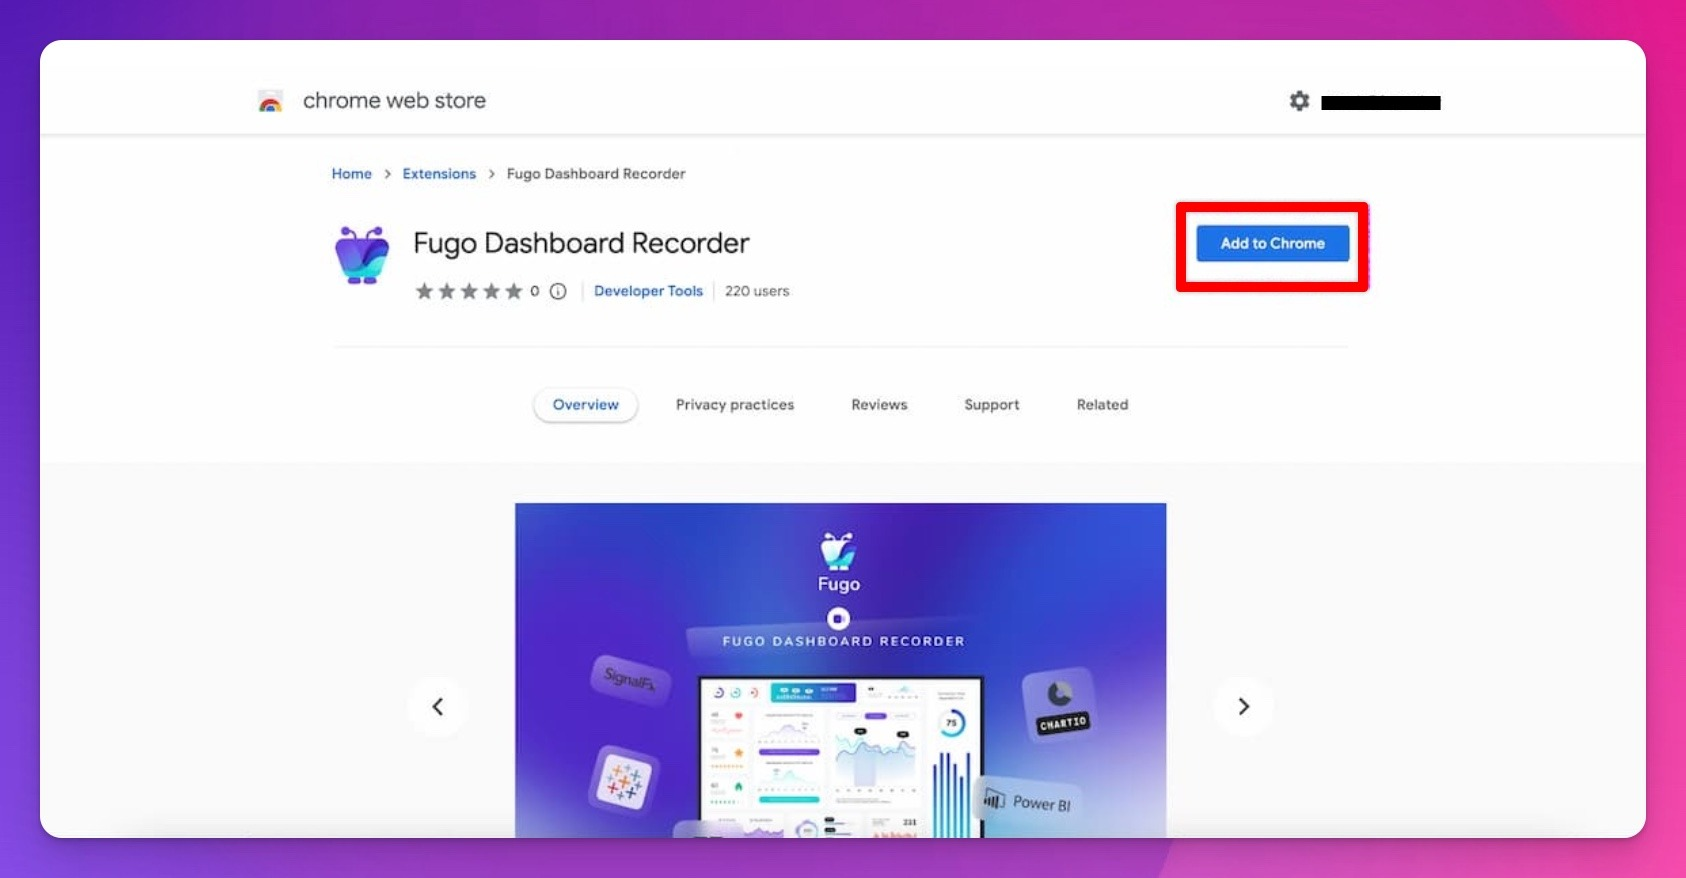
Once you’ve added it to Chrome, you should see a little blue checkmark in your Fugo window indicating that our software detects it.
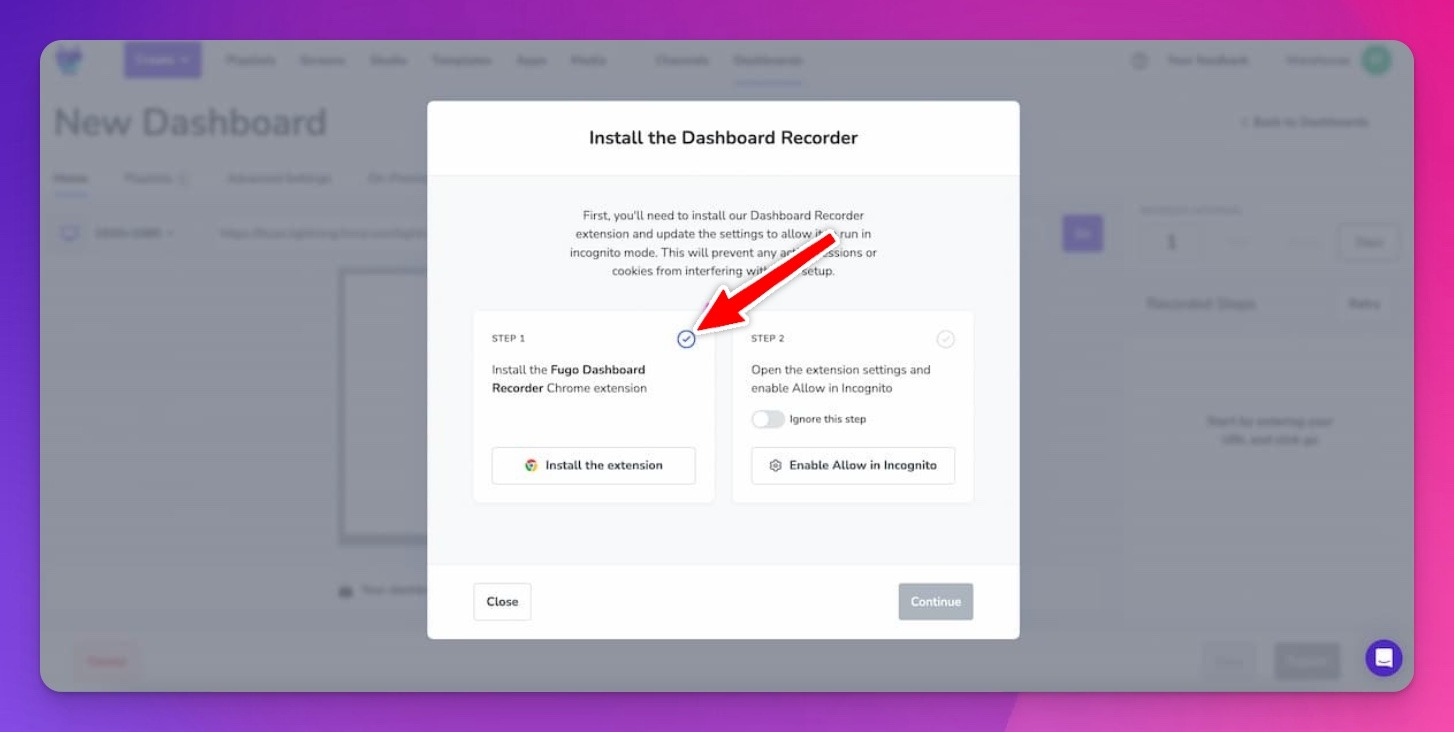
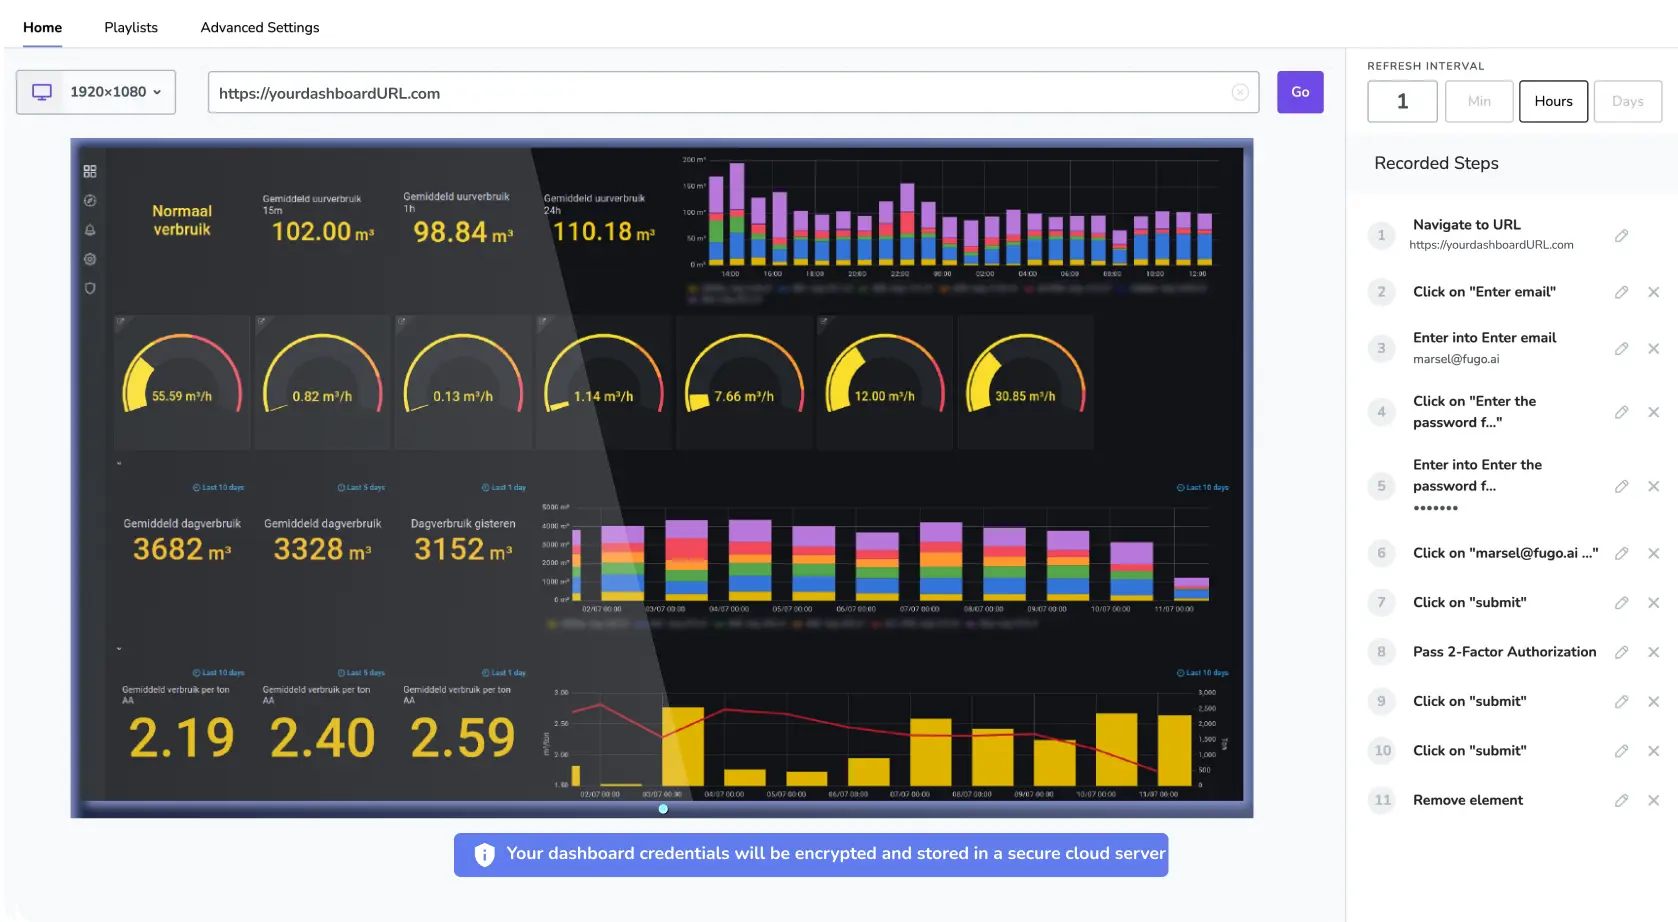
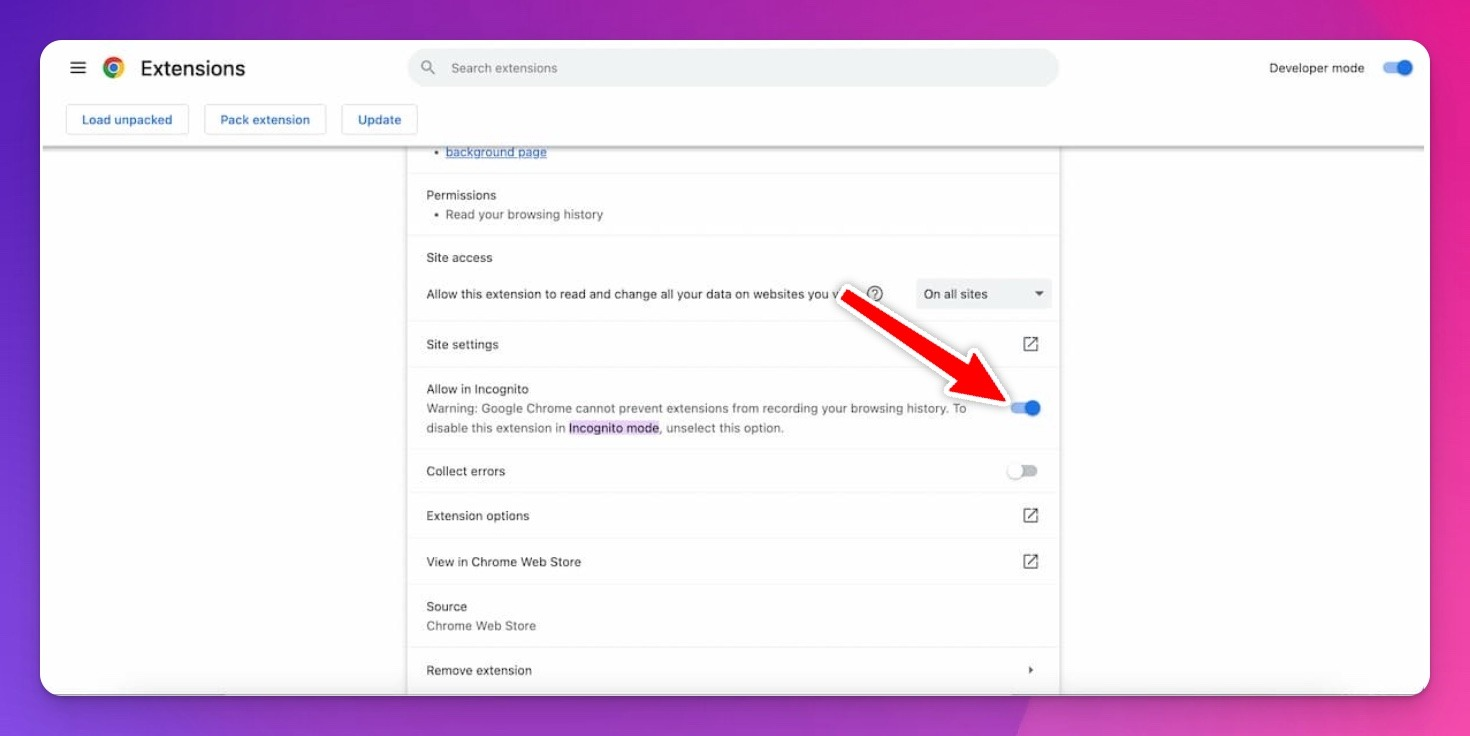
Next, enable Allow in Incognito for your extension so you can stream data dashboards without a user license. It should look something like this:
5. Log in to your data dashboard
In Fugo, you’ll see a pop-up window with the dashboard recorder that prompts you to log in to your dashboard.
Just enter your login credentials and input your 2FA/SSO key.
Now we’re ready to start designing your dashboard. Which brings us to our next point…
6. Select the data you want to include
You’ve got a few options depending on what you’re looking for.
First, use the dashboard Capture tool to highlight any information you want included in your digital display. Like this:
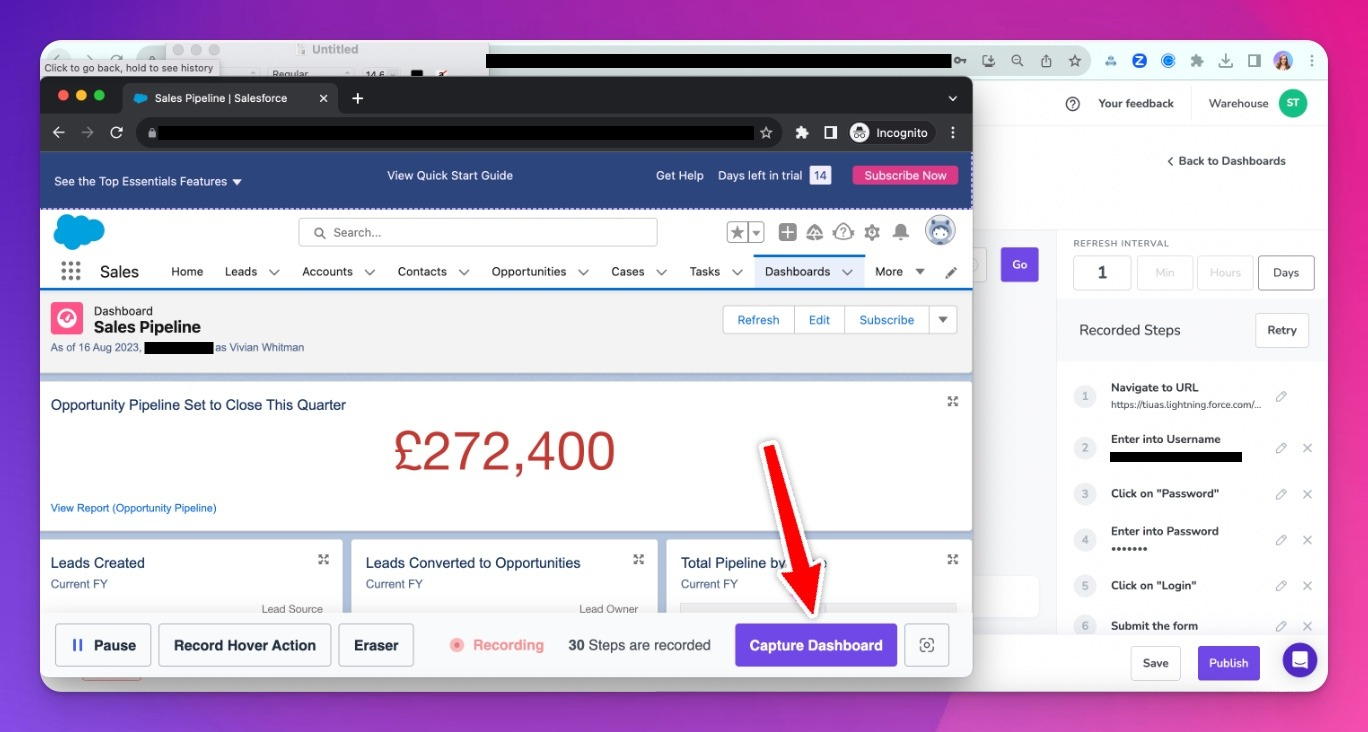
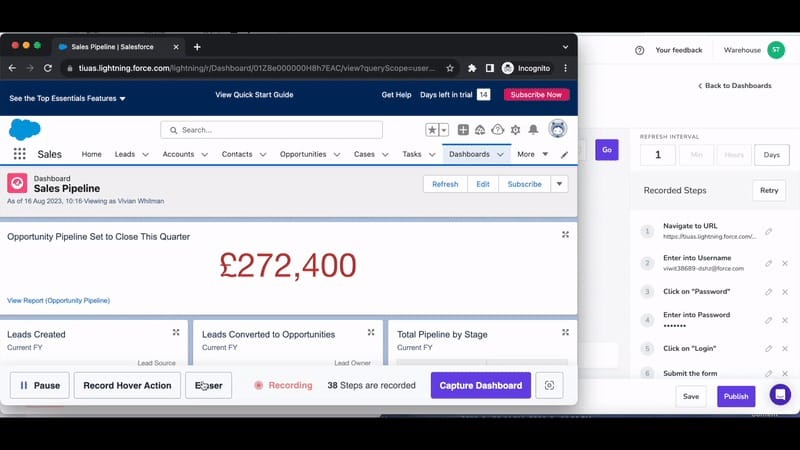
Is there an element you don’t want included? Use the Eraser tool to eliminate it.
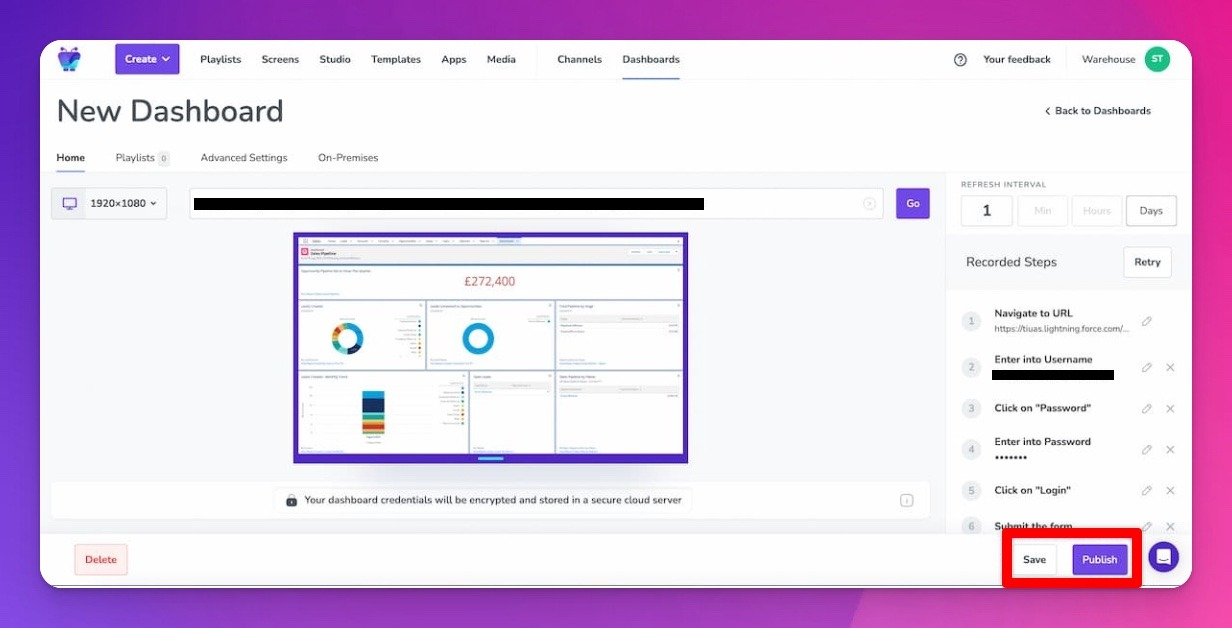
7. Check your dashboard preview
Once you’ve selected what data you want to include (and what data you want to exclude), look over your dashboard and ensure everything seems to be in order. If you want to make changes, you can go back and do some tinkering. Otherwise, you’re clear to proceed by tapping Publish.
8. Design your data dashboard
Now comes the fun part: dressing up the data!
You have a number of options inside the Fugo Design Studio.
Once you add your dashboard to a Design Studio canvas, you might try:
- Cropping, cutting, or otherwise displaying information across multiple slides or playlists
- Adding your company logo to each slide, or denoting which of your business teams needs said data (like marketing versus sales)
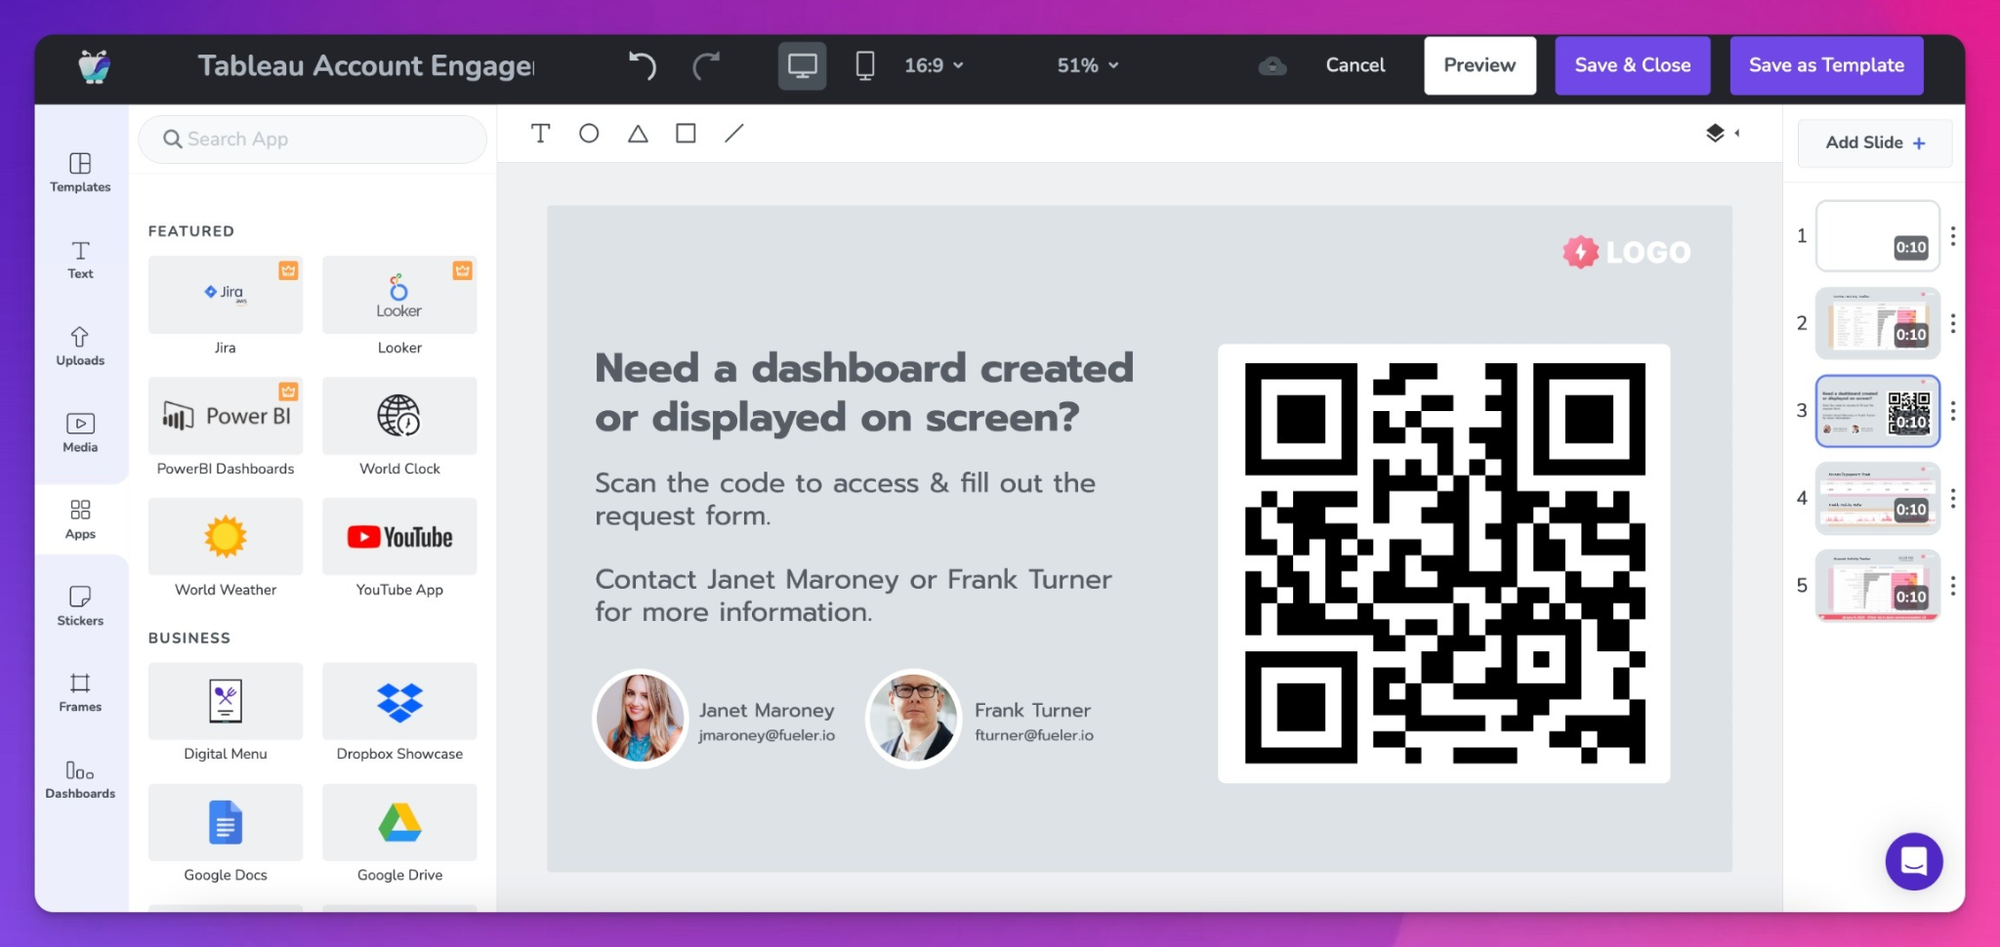
- Hooking up other digital signage integrations, like the CNN app or the World Clock app, to monitor things like market changes
- Adding QR codes so team members can access real-time dashboards in their respective apps
- Incorporating text boxes with reminders, messages, or requests, or denoting which data goes where (like, “this is our current user engagement rate,” or “this was last month’s customer satisfaction score”)
The world is your oyster!
And voila! You’re done!
You have successfully set up your first dashboard integration with digital signage.
But don’t think for a minute that this is the end of the line. The sky’s the limit depending on what your business.
With Fugo, you can:
- Connect multiple databases from various sources and add them to the same signage screen. Or, if you’re just looking to get organized, you can separate each database source into its own playlist.
- Continuously improve on your existing data integration to support performance optimization with your team
Ready to get started with a dashboard integration of your very own?
Get more value from the tools you already use by signing up for a 14-day free trial of Fugo.

