

Loading dashboard information...
Loading dashboard information...
Explore comprehensive insights into real estate trends, property values, and market dynamics with Tableau Real Estate Dashboards for strategic decision-making.
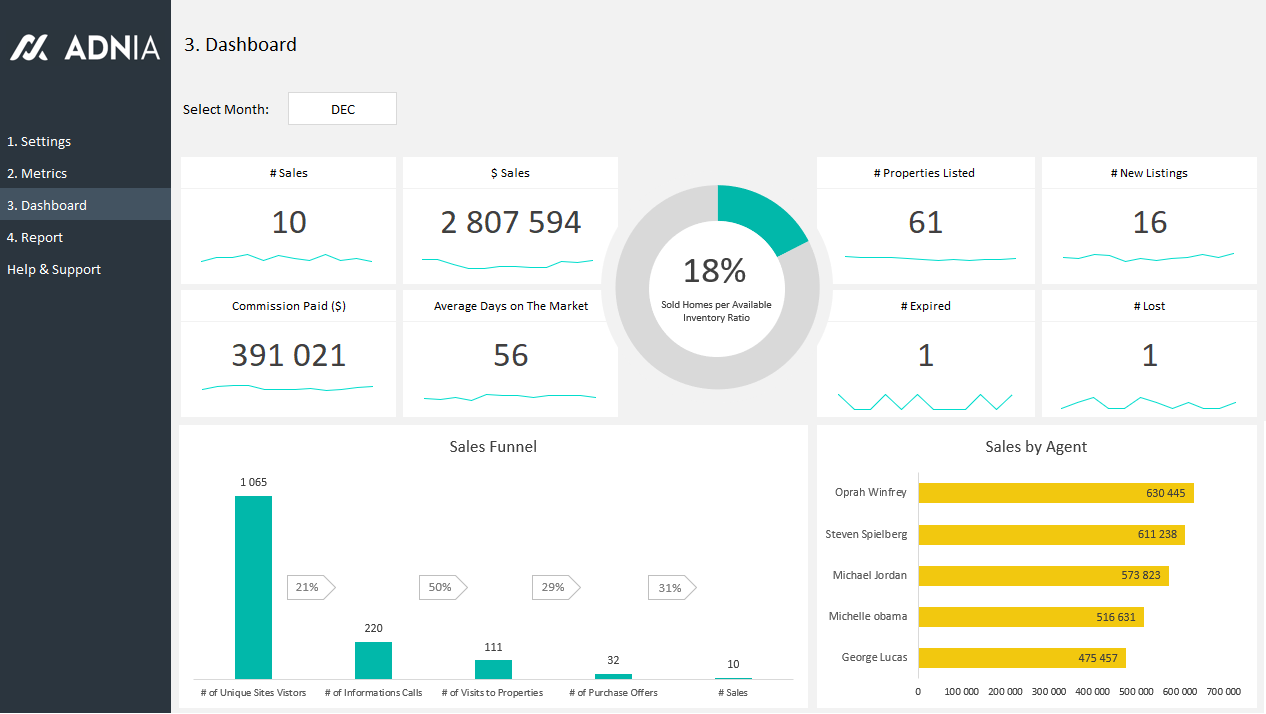
The Tableau Real Estate Dashboards provide an in-depth analysis of market trends, enabling users to visualize data on property values, sales volumes, and demographic shifts. This section of the dashboard allows real estate professionals to identify emerging trends, compare historical data, and forecast future market conditions. By leveraging interactive charts and graphs, users can gain a nuanced understanding of the factors driving the real estate market, facilitating informed investment decisions.

This dashboard is designed for real estate professionals, including agents, brokers, and investors, who need to stay ahead in a competitive market. It is also valuable for analysts and researchers who require detailed insights into market dynamics. Whether you are making investment decisions, advising clients, or conducting market research, the Tableau Real Estate Dashboards provide the tools necessary to understand and navigate the complexities of the real estate industry.
Other dashboard tools that work with Fugo

Rentlytics provides real-time insights and analytics for property managers to optimize rental operations and enhance tenant satisfaction.

Explore Reonomy's comprehensive dashboard for real estate insights, offering data-driven analytics and property intelligence in a user-friendly interface.

VTS Analytics provides real-time insights into property performance, tenant engagement, and market trends, enhancing decision-making for real estate professionals.