

Loading dashboard information...
Loading dashboard information...
Visualize and analyze your data effortlessly with the Qlik Sense dashboard, offering interactive insights and real-time analytics for informed decision-making.
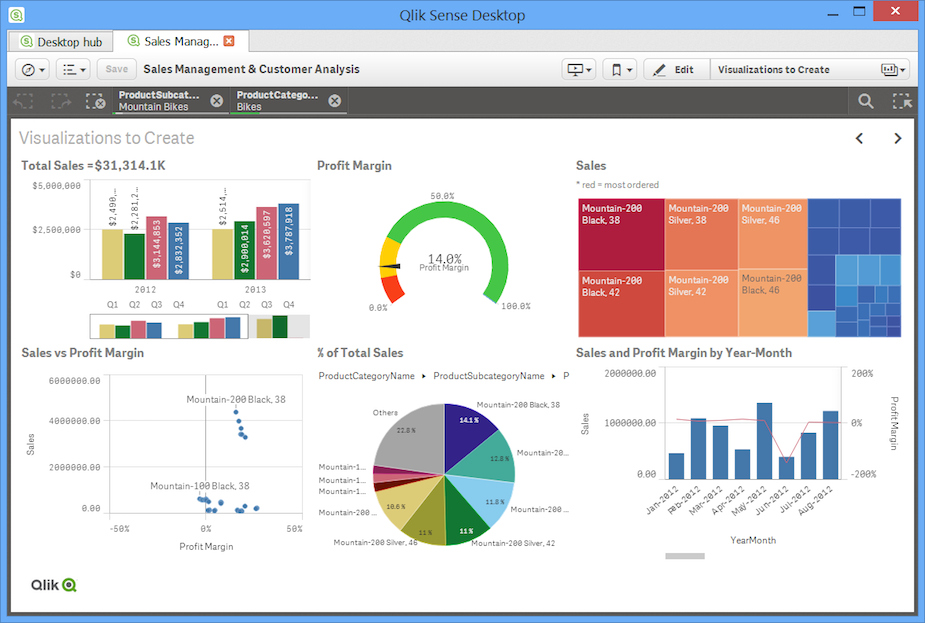
The Qlik Sense dashboard provides a dynamic platform for visualizing complex datasets. With its intuitive drag-and-drop interface, users can create interactive charts, graphs, and maps that bring data to life. The dashboard's responsive design ensures that visualizations are accessible on any device, allowing for seamless analysis and collaboration. Users can explore data relationships and trends in real-time, making it easier to derive actionable insights and make data-driven decisions.

The Qlik Sense dashboard is designed for business analysts, data scientists, and decision-makers who need to transform raw data into meaningful insights. It's ideal for organizations of all sizes looking to enhance their data analytics capabilities without requiring extensive IT support. Whether you're in finance, healthcare, retail, or any other industry, Qlik Sense provides the tools necessary to visualize data effectively and make informed strategic decisions.
Other dashboard tools that work with Fugo

Phocas dashboard offers intuitive data visualization and analysis tools, empowering businesses to make informed decisions with real-time insights.

Gain insights into sales performance, customer trends, and financial metrics with this interactive Power BI dashboard for data-driven decision-making.

Gain insights and visualize data effortlessly with the Redash dashboard, designed for intuitive data exploration and seamless collaboration.