

Loading dashboard information...
Loading dashboard information...
Monitor and visualize metrics efficiently with the Prometheus dashboard, offering real-time insights and alerting for system performance and reliability.
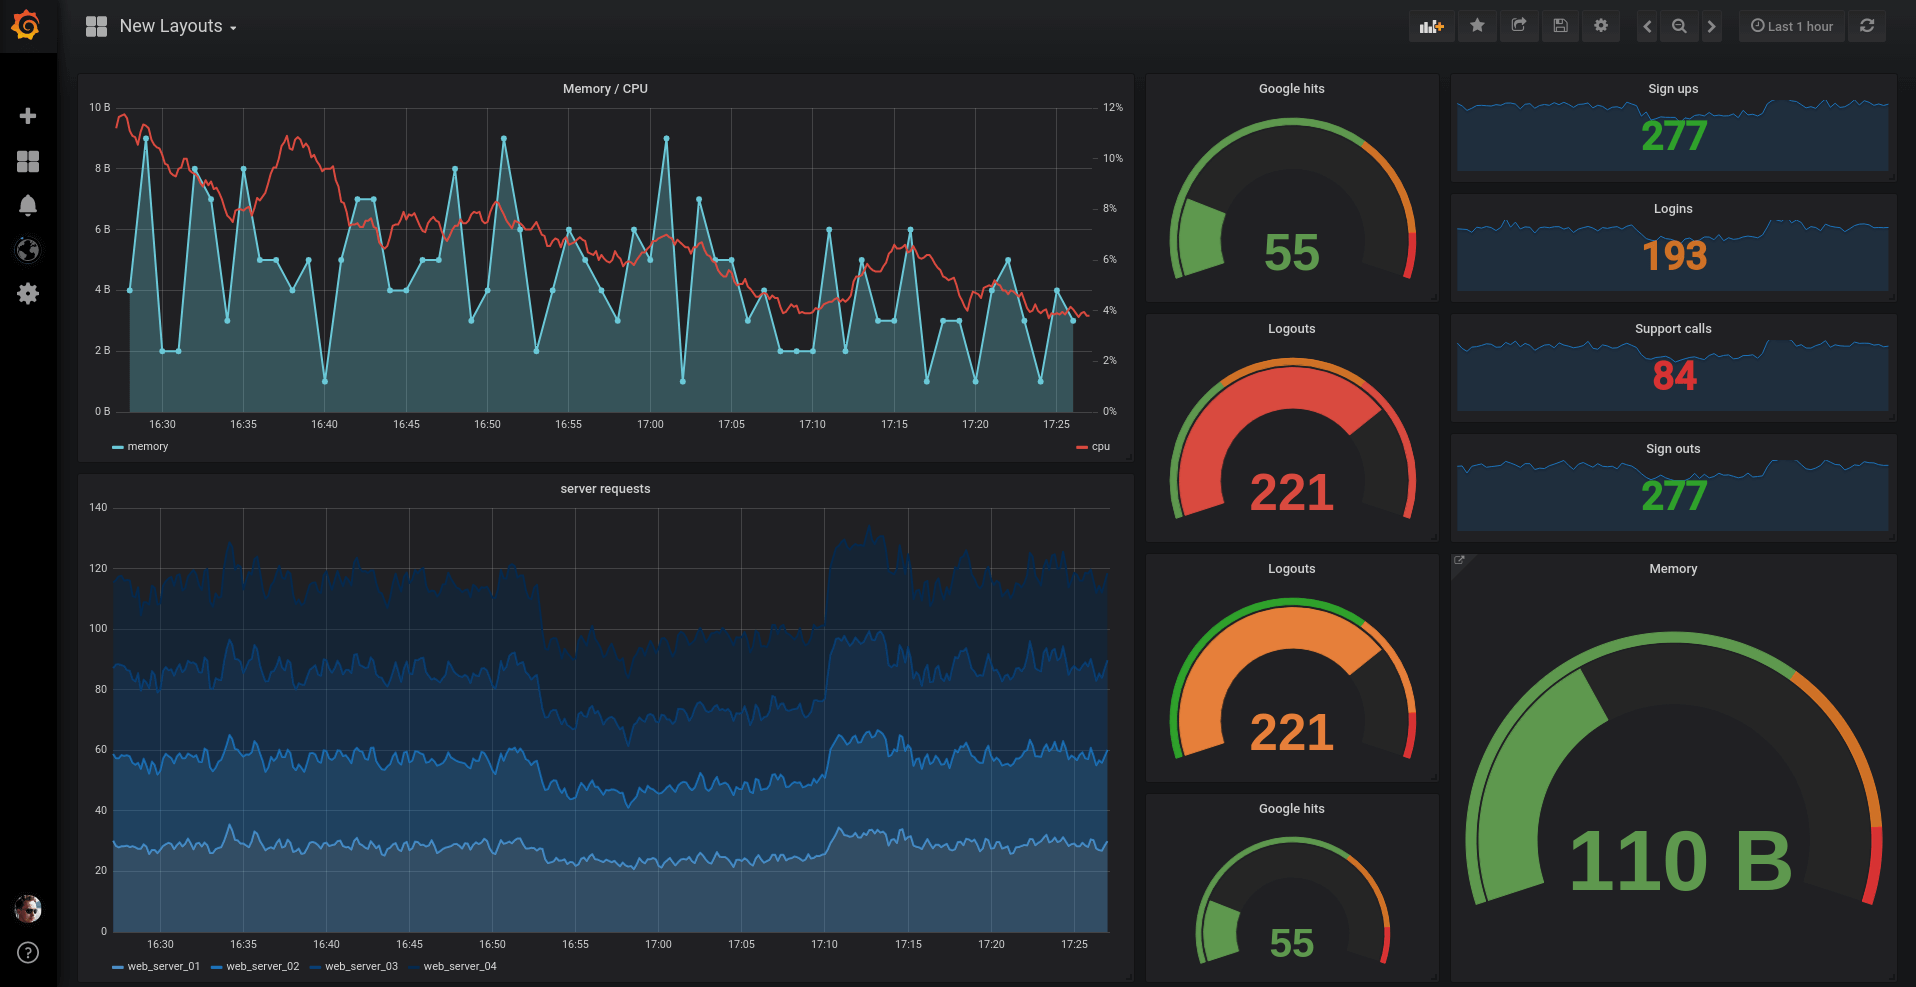
The Prometheus dashboard provides a robust platform for monitoring a wide range of metrics across your infrastructure. It collects data from various sources, allowing you to visualize trends, identify anomalies, and gain insights into system performance. With its powerful querying language, PromQL, you can create custom queries to extract specific metrics and display them in an intuitive format. This makes it easier to keep track of resource usage, application performance, and overall system health.

The Prometheus dashboard is ideal for DevOps teams, system administrators, and IT professionals who need to monitor and manage the performance of their infrastructure. It's also beneficial for developers looking to gain insights into application performance and resource usage. Organizations of all sizes, from startups to large enterprises, can leverage this tool to ensure their systems are running optimally and to quickly address any issues that arise.
Other dashboard tools that work with Fugo

Monitor and manage incidents effectively with the PagerDuty dashboard, offering real-time alerts, analytics, and seamless integration for optimal response.
Leverage Pentaho's dashboard for comprehensive data integration, analytics, and visualization to drive informed business decisions efficiently.

Monitor and manage your IT infrastructure efficiently with the SolarWinds dashboard, offering real-time insights and comprehensive performance metrics.