Once upon a time, building dashboards was painful. You added data to a dashboard tool, then built said dashboard, then had a few minutes left in your day to actually analyze the data.
But we have much better ways of dealing with dashboards these days — starting with the magic of AI dashboard generators.
AI-generated dashboards make data management 1,000 times easier, along with many other benefits like one-click analysis and instant visualizations. No need to be a data analyst to create charts and graphs anymore — so long as you pick the right tools.
This guide explains what an AI dashboard generator is, how it works, why you need one, and most importantly, how to choose the best option. It also explains how to make the most of your AI platform so you can reap even more benefits from your AI investment.
What is an AI dashboard generator?
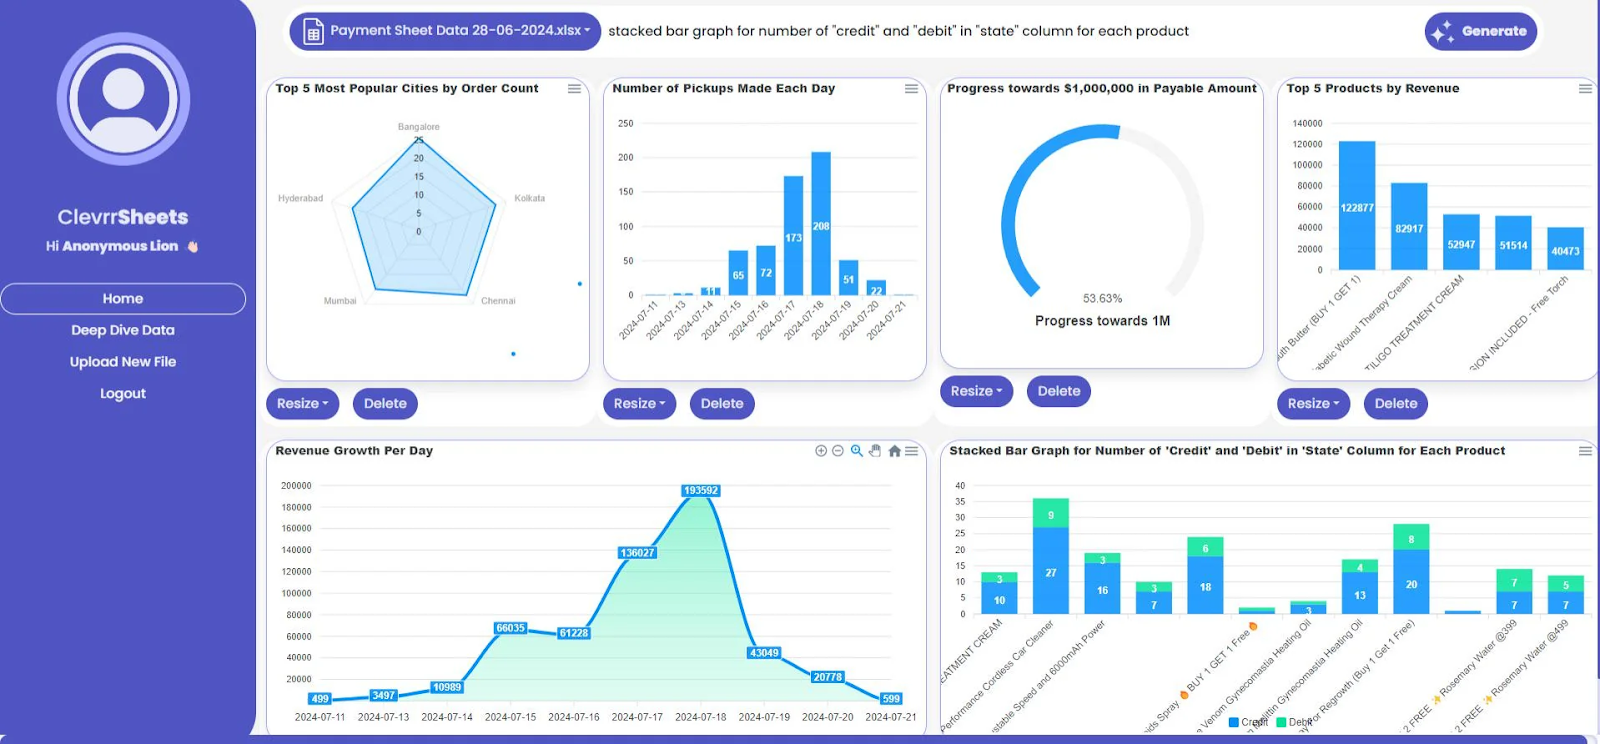
AI dashboard generators can help you create, edit, and export dashboards all in a single click. All you need to do is connect the generator to your data sources, and it will build dashboard components like charts, visualizations, and interactive graphs.
I should mention that AI dashboard generators are not the same as tools like Geckoboard, Plecto, and Excel. At least, not yet.
Sure, Geckoboard and Plecto can help you build interactive dashboards, but they can’t automatically do it for you. And Excel or Google Sheets can help you make ‘dashboards’ for real-time collaboration work, but again, this doesn’t happen automatically.
The difference is that an AI dashboard generator automatically creates data visualizations when you ask it. That way, you spend less time building dashboards or learning technical skills, and more time pulling out valuable insights from your charts, tables, and datasets.
How AI dashboard generators work
This mostly depends on the AI dashboard generator in question. But for now, let’s look at the general process.
Step 1: Connect your data
The first step in this process is uploading your dataset. Depending on your business, this might be:
- Excel tables
- Google Sheets
- CSV files
You can also connect data sources from third-party tools, like Zendesk, Salesforce, HubSpot, or Grafana. This makes it easier to consolidate information without worrying about paywalls or expensive view-only licenses.
Step 2: Prompt-based dashboard creation

Now it’s time to create your dashboard using the data you’ve connected to the software.
One option is to start with a pre-set template, which can help the AI populate visualizations in a pre-set layout. However, you can always customize your dashboard from the ground-up by giving the AI a detailed prompt.
Now, keep in mind A doesn’t always get it right on the first round. You might need to correct it multiple times and give it very specific feedback to get the right customizations, even with a pre-fab template.
But keep at it long enough, and you’ll get pretty close.
Plus, most AI dashboard generators have manual editing tools so you can easily make adjustments as necessary.
And speaking of adjustments…
Step 3: Get actionable insights

So your AI just generated a whole bunch of charts. Now you’re ready to tuck into that data!
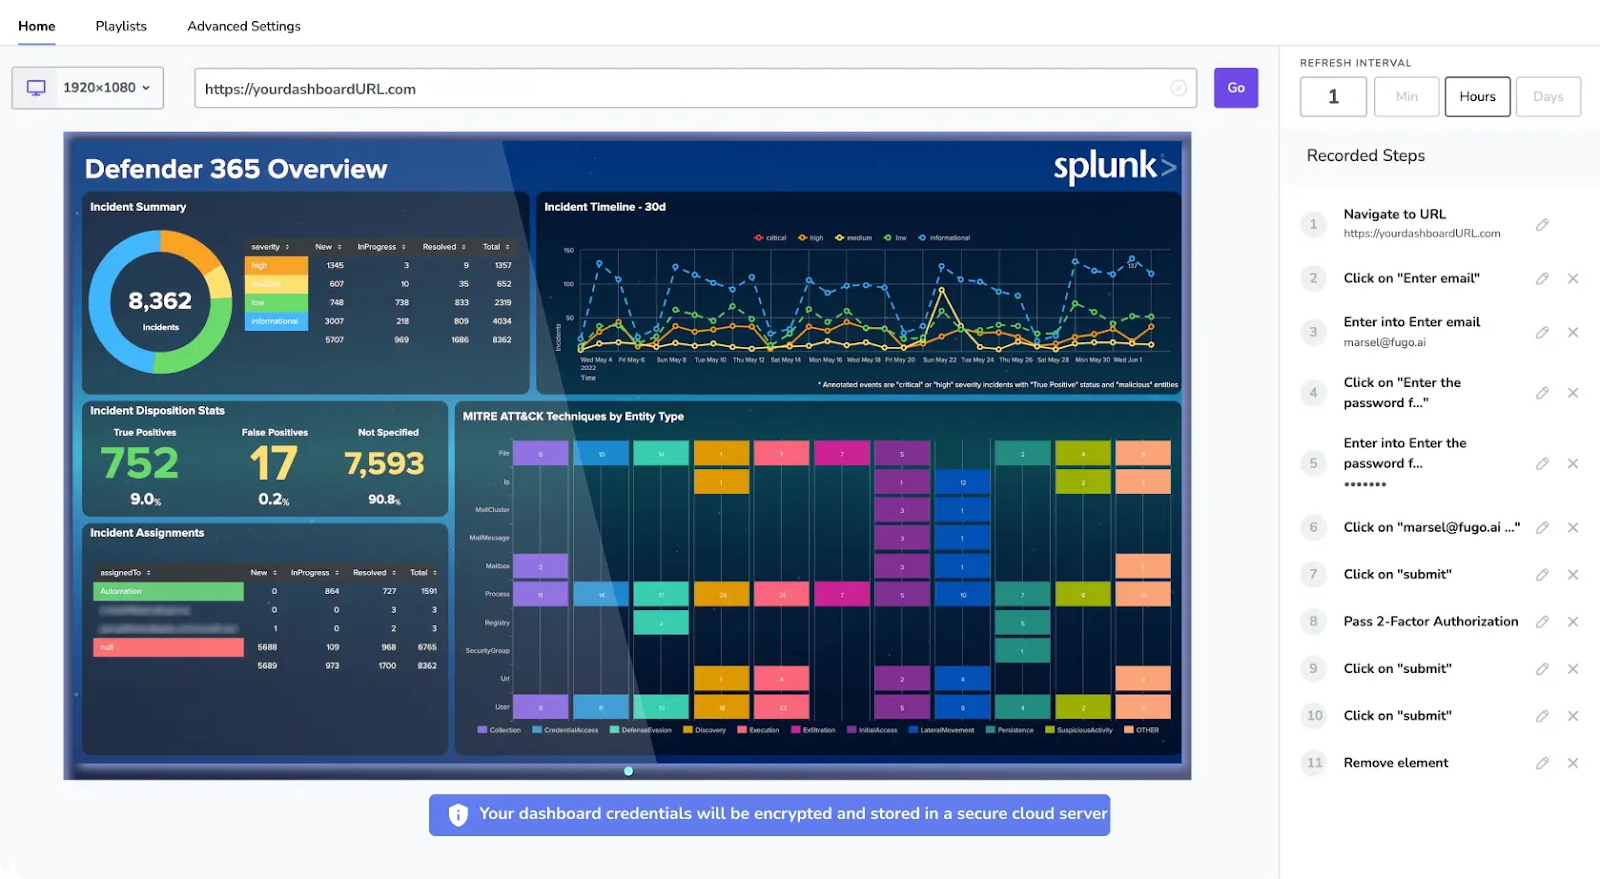
You can pour through the data and share visualizations with your team by sharing dashboards on TV, embedding them in company intranets like Notion, or creating a secure company TV channel (aka, a browser link that connects them directly to your dashboard).
But let’s say your data’s a bit more complicated than that. How do you interpret what’s on the screen?
With AI dashboard generators, you might have access to analysis tools. You just ask natural language questions and let AI agents pull out the important insights.
For example, you might ask:
- “What’s our conversion rate from product demo to customer?”
- “What was our customer churn rate last year?”
- “How close are we to our Q4 revenue goals?”
💡Related: What’s the Best Way to Put Power BI on a TV? Comparing PowerPoint vs. Digital Signage Software
What else can you do with AI tools in dashboards?
Making an AI dashboard is cool enough, but what if I said there was more you could do?
Some AI dashboard generators offer extra bells and whistles like:
- Voice-activated natural language prompts: You can tell the dashboard generator exactly what you want, and it will generate it for you (either through text or speech). This replaces traditional drag-and-drop interfaces. It’s not just no-code — it’s quite literally zero code.
- AI suggestions for relevant KPIs: Not sure which metrics to include on your KPI dashboard? Just ask your AI agent and let it give you some ideas.
- The ability to ask probing questions: You may also have access to an AI assistant that answers questions about your dashboard so you can get insights faster. For example, you might ask, “how many tickets went to customer support last week?” or, “what does the data say about our profitability this year?”
Why your business needs an AI dashboard generator
You can probably see by now just how beneficial AI dashboard generators can be. But for the sake of investigating everything these tools have to offer, let’s take a closer look.
For one thing, AI dashboard generators are much faster than traditional dashboard-building methods. As in, literal seconds compared to multiple days or weeks.
This speed of setup can also help you make fewer mistakes, or at least correct mistakes much faster by comparison. You might spot issues with your dataset, for example, or want to tinker with your visualizations a bit. Either way, AI dashboard generators take suggestions and feedback so you can upgrade your display without hour-long do-overs.
Another reason to make the switch: you can consolidate data more quickly. No need to wait on developers or data analysts — which frankly, could take years if you’re a small and growing business.
Now, you can funnel multiple data sources directly into a single dashboard. This also makes your data more accessible to non-technical teams!

Polymer reports that 65% of businesses are overwhelmed by the complexity of data collection and insight generation. So thank goodness AI dashboards can help finish up data collection so you can spend more time identifying patterns and finding hidden insights.
And speaking of hidden insights, AI dashboards can help you bring data to everyone in your business; meaning you don’t need to worry about expensive view-only licenses. Love ‘em or hate ‘em, tools like Power BI and Tableau require you to purchase view licenses so other users can access the details.
TL;DR, AI dashboard generators make data easier to share and iterate on, for less.
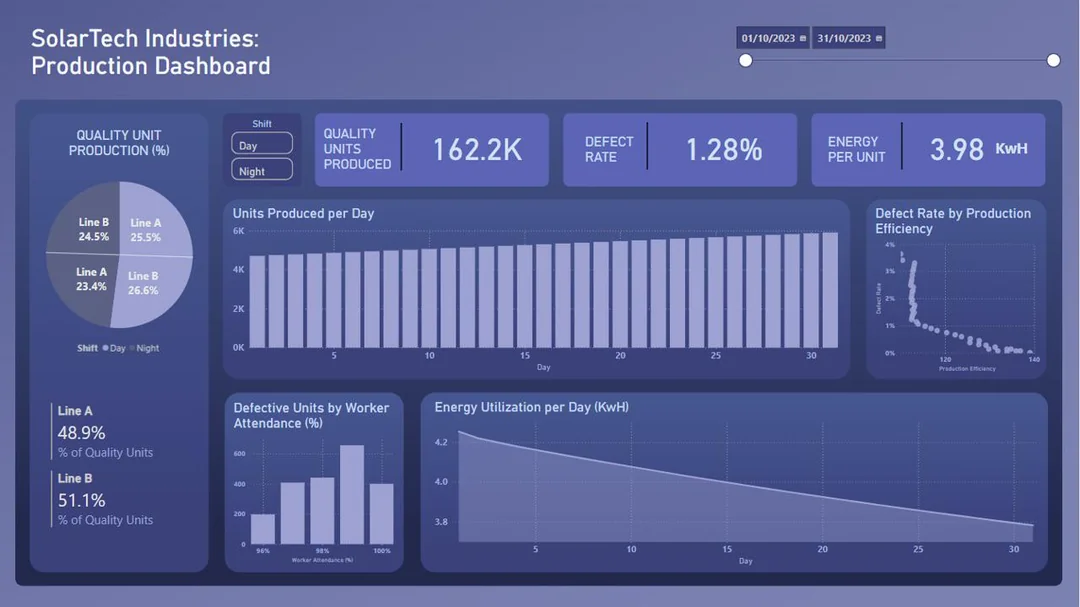
How to choose an AI dashboard tool
There aren’t many AI dashboard tools on the market (yet), but you should still know how to sort the better from the best. That way, you can choose the best possible platform for your business.
So here are a few key features to keep in mind:
- Integrations: Does the dashboard tool connect to your existing data platforms without headaches? Like Google Sheets, Slack, CRMs, and other BI tools?
- User experience (UX): Dashboards are only useful if people actually use them. So keep an eye out for tools with clean interfaces and minimal setup processes.
- Customizations: Can you change up visualizations, filters, and layouts to fit your unique aesthetic? Or are you locked into a rigid template? And if so, is that acceptable?
- Explainability: How clear are the visualizations made? Are there AI assistants available to help pull details for your team?
You’ll also want to evaluate features like pricing, but that mostly depends on the tool in question. Some dashboard generators are for general purpose use, while others are more specialized and offer extra features to help your business grow.
That’s what we’ve been up to over here at Fugo. 😉 Our upcoming dashboard builder tool will let you create dashboards from prompts, then push data to any TV screen to keep your teams in the know and on the same page. 📑
And while it’s not out yet, you can trial the Fugo platform at any time.
Try us free for 14 days and set up TV dashboards in a matter of minutes.

Making the most of AI dashboard generators
AI dashboards are quickly becoming a must-have tool for modern teams. Whether you’re in marketing, sales, finance, operations, or HR, you’ll spend less time formatting data and more time finding insights and trends that genuinely matter to your business.
It helps that the use cases keep expanding, too, from tracking campaign performance to forecasting revenue or analyzing employee engagement. That’s why Fugo’s AI dashboards are designed to give every department a smarter, faster way to keep an eye on metrics. 🔍
Now, keep in mind our AI dashboard tool isn’t quite out yet, but rest assured we’re working hard to bring updates to you soon.
And in the meantime, you’re invited to join our AI Beta Program for updates and new access as new features are released. ✨
P.S., ready to dive deeper into AI dashboard generators? These resources may be what you’re looking for:
- What to Include in an SEO Dashboard: Examples, KPIs, and Reporting Tips
- Why Every Business Needs an AI Dashboard
- AI Dashboard Builders are Coming for Your Spreadsheets
Frequently asked questions about AI dashboard generators
Q: Which AI can generate dashboards?
Here are some AI tools that can help generate dashboards:
- Fugo: Our AI dashboard generation tool is in the works, but on the way!
- Tableau: Its AI feature uses natural language queries to surface insights.
- Power BI with Copilot: Microsoft’s AI assistant can help build dashboards faster.
- Zoho Analytics: Access AI-driven reporting and visual recommendations.
- MonkeyLearn: Turns unstructured data into charts and dashboards.
Q: Can ChatGPT make dashboards?
Yes, you can use ChatGPT to make HTML dashboards, or interactive charts for tools like Microsoft Excel or Google Sheets.
But you can’t use ChatGPT to create dynamic data visualizations or interactive elements. Plus, not all data visualizations will look particularly refined, since the AI can’t necessarily check your preferences before generating material.
Q: What is the best AI chart generator?
The “best” AI chart builder depends on your needs:
- For business users, Power BI Copilot or Tableau AI might work.
- For browser-based work, tools like ChartGPT or Google Looker Studio can help.
- For coders, libraries like Plotly (Python) or D3.js (JavaScript) offer AI integrations so you can auto-generate charts.
Fugo is also building an AI dashboard generator behind the scenes. You can sign up for our AI Beta Program to stay in the know.
Q: Does Microsoft have a dashboard builder?
Yes, Power BI is Microsoft’s flagship dashboard builder. With the recent addition of Microsoft Copilot, you can now create dashboards and reports using natural language prompts.
Power BI makes it easier to generate charts, spot trends, and share visualizations without manually setting up each element. However, you should know it can’t push your dashboards to a TV screen — you’ll need digital signage technology for that.
Q: How do I edit an AI dashboard?
The best AI dashboard generators give you manual tools so you can easily make edits and just your output.
You can also make edits and customize your dashboard simply by telling the AI what to do. For example, you might type, “turn this pie chart into an interactive dashboard,” or, “add a video tag to that visualization.”
