


You’ve got a dashboard or report your team should see - not once, but all the time. Maybe it’s sales performance, call center metrics, or warehouse fulfillment data. You want it visible on the office TV so it stays top-of-mind without needing someone to open a laptop or pull it up on demand.
That’s usually when someone suggests the fastest fix: “Let’s just stick it in a PowerPoint.”
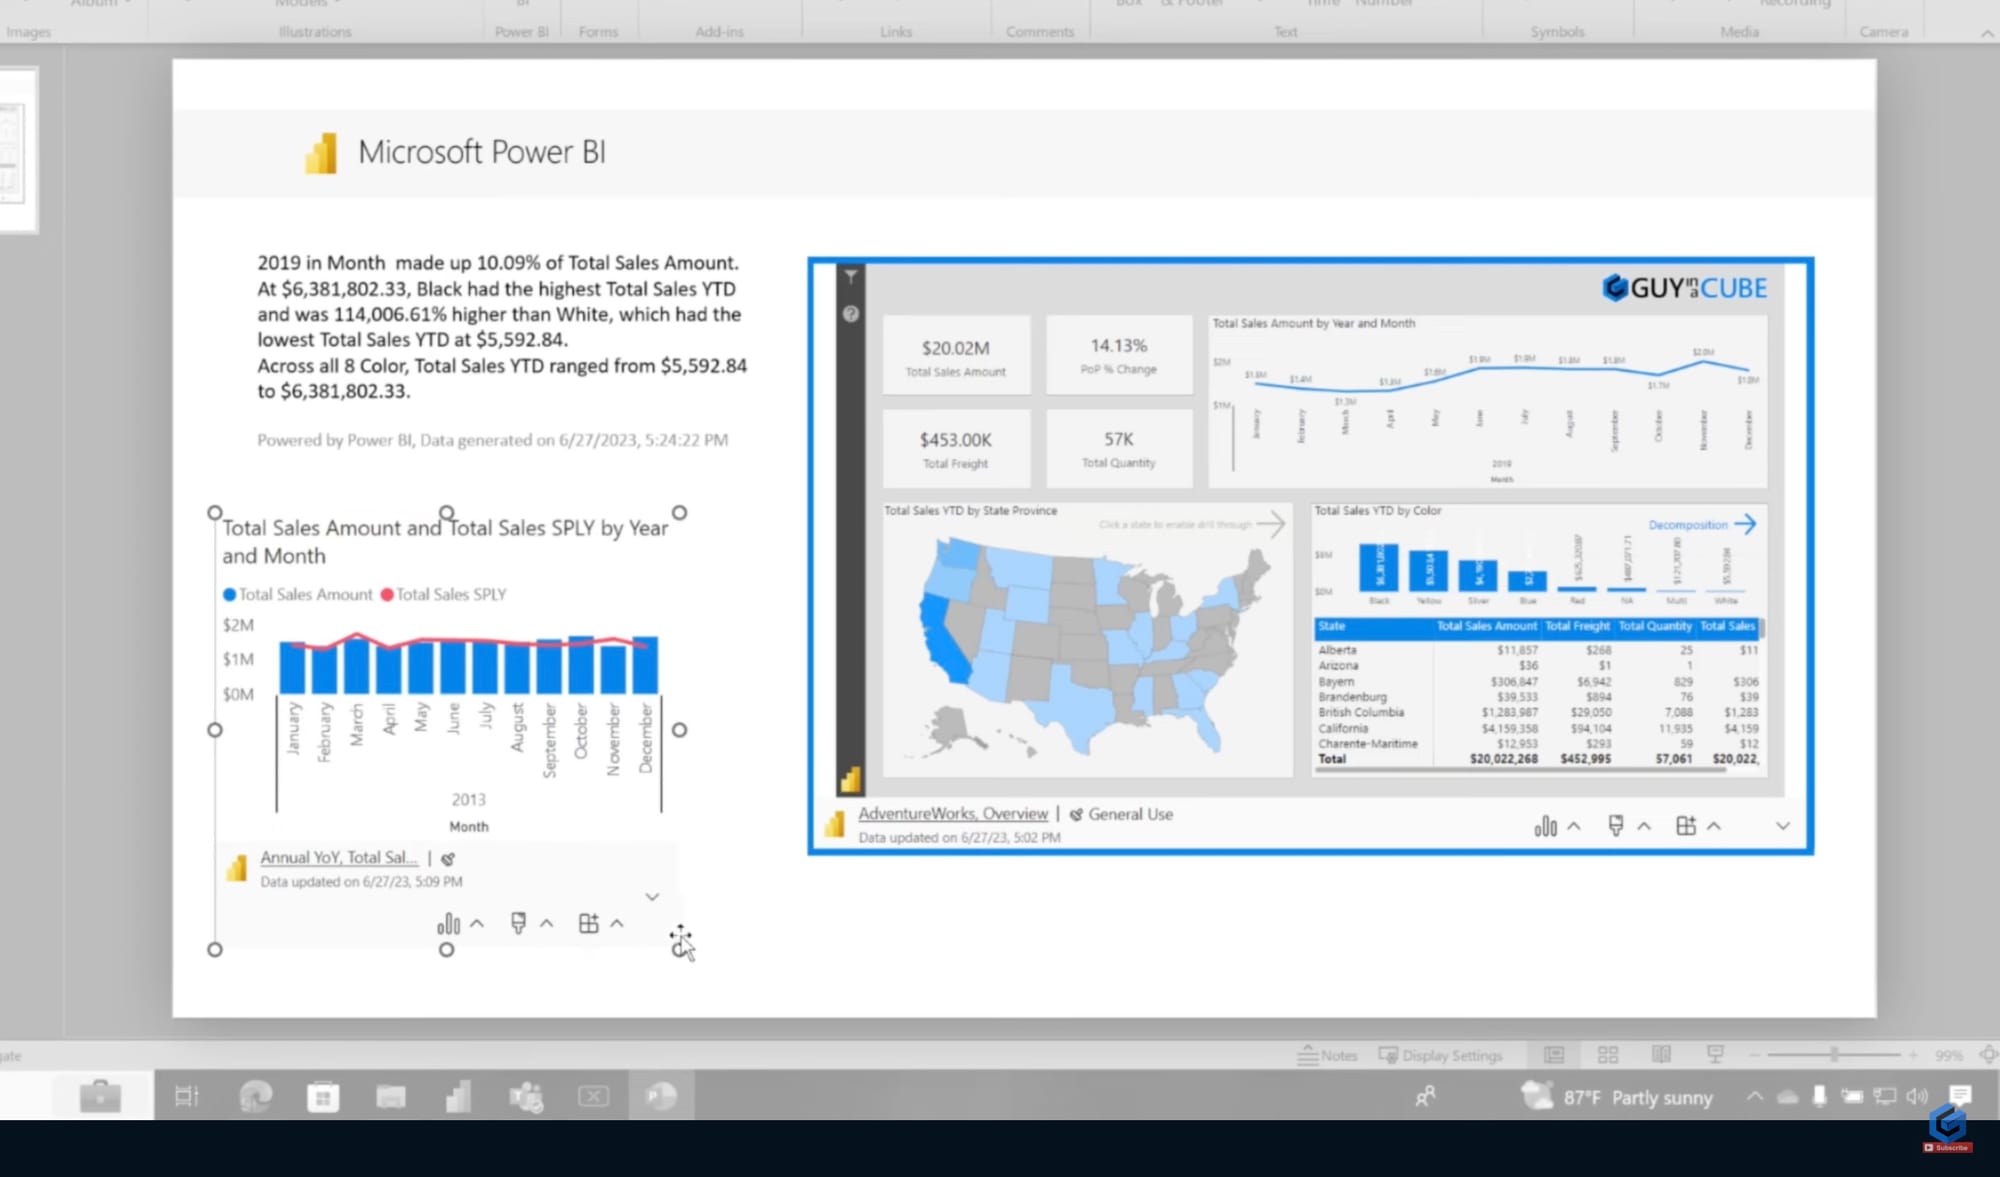
And it works! You embed your Power BI report in a slide, start the presentation, and hook up the TV with an HDMI cable or cast to the screen.
But what feels like a clever shortcut quickly turns into a hassle when you try to make it work longer term: manual restarts, fiddly screen inputs, and a dashboard that disappears if the session crashes.
In this article, we’ll walk you through how the Power BI PowerPoint add-in works, where it starts to break down, and how digital signage software like Fugo can step in when your setup needs to be more resilient and a whole lot less hands-on.
How teams usually start: the PowerPoint method
You’ve got a dashboard in Power BI and a TV on the wall. What’s the fastest way to connect the two?
For many teams, it’s embedding that dashboard into PowerPoint using Microsoft’s Power BI add-in. You open the deck, plug in a laptop, and cast or cable it to the TV.
It works. But only as long as you’re standing in front of it.
Here’s how it typically looks:
- You embed the Power BI report into a PowerPoint presentation
- You connect a laptop to the screen (via HDMI or casting)
- You open the presentation and start the slideshow
- You leave the laptop open and active all day
- If the connection drops, you go back in and restart the slideshow

If you’re sharing data in a meeting room or showing a dashboard for a few hours, this setup does the job. But it’s not built to run unattended, and it definitely doesn’t scale.
Where PowerPoint starts to fall short
The PowerPoint approach is fine - until you try to use it like a display solution.
Here’s what starts to go wrong:
No automation means more manual effort
The Power BI PowerPoint method requires someone to open the presentation, cast or connect it to the screen, and keep an eye on it throughout the day. If the file closes, the laptop sleeps, or the connection drops, someone has to notice and fix it.
That might be fine for a meeting or demo, but for anything you want continuously visible, this manual upkeep quickly becomes a burden.
No remote visibility if something goes wrong
If the screen goes black, freezes, or stops showing the dashboard, you won’t know unless someone is physically there to check. There’s no remote monitoring tool to alert you if the presentation has stopped running.
For teams managing multiple locations, this lack of visibility creates real friction, especially when Power BI is meant to keep everyone aligned.
It’s only as reliable as the laptop running it
Your entire display setup hinges on one device: the laptop. If that machine restarts, runs updates, or gets unplugged, your dashboard disappears. You’ve now got a single point of failure sitting in front of the screen, often relying on someone to babysit the connection which defeats the purpose of hands-off data visibility.
Add-in blocked? You may not be allowed to use this method
The Power BI PowerPoint add-in is part of Microsoft’s Office Store ecosystem but many organizations block access to it by default for security or compliance reasons.
If your IT team has restricted third-party add-ins, you won’t be able to embed Power BI in PowerPoint at all. And even if it’s allowed, you might need admin approval to get started.
Auto-refresh isn't always what it seems
PowerPoint now supports timed refresh intervals when you present slides containing embedded Power BI reports, meaning visuals can update automatically every 5, 15, or 30 seconds during a slideshow. This makes it possible to loop a live dashboard on screen without manual reloads.
But this doesn’t mean your data is instantly live or always up-to-date. Behind the scenes, your Power BI reports still update based on their configured refresh schedules (from Power BI Service or your data source). The PowerPoint add-in doesn’t override those settings or force a new query - it just reloads the currently available report state at the chosen interval.
For teams with fast-moving metrics (like live sales, logistics, or production stats), this distinction matters. You may still experience data lag if the Power BI report itself hasn’t refreshed, even if your PowerPoint deck is set to update frequently.
What digital signage software does differently
Digital signage tools are built for persistent, unattended display. Not presentations.
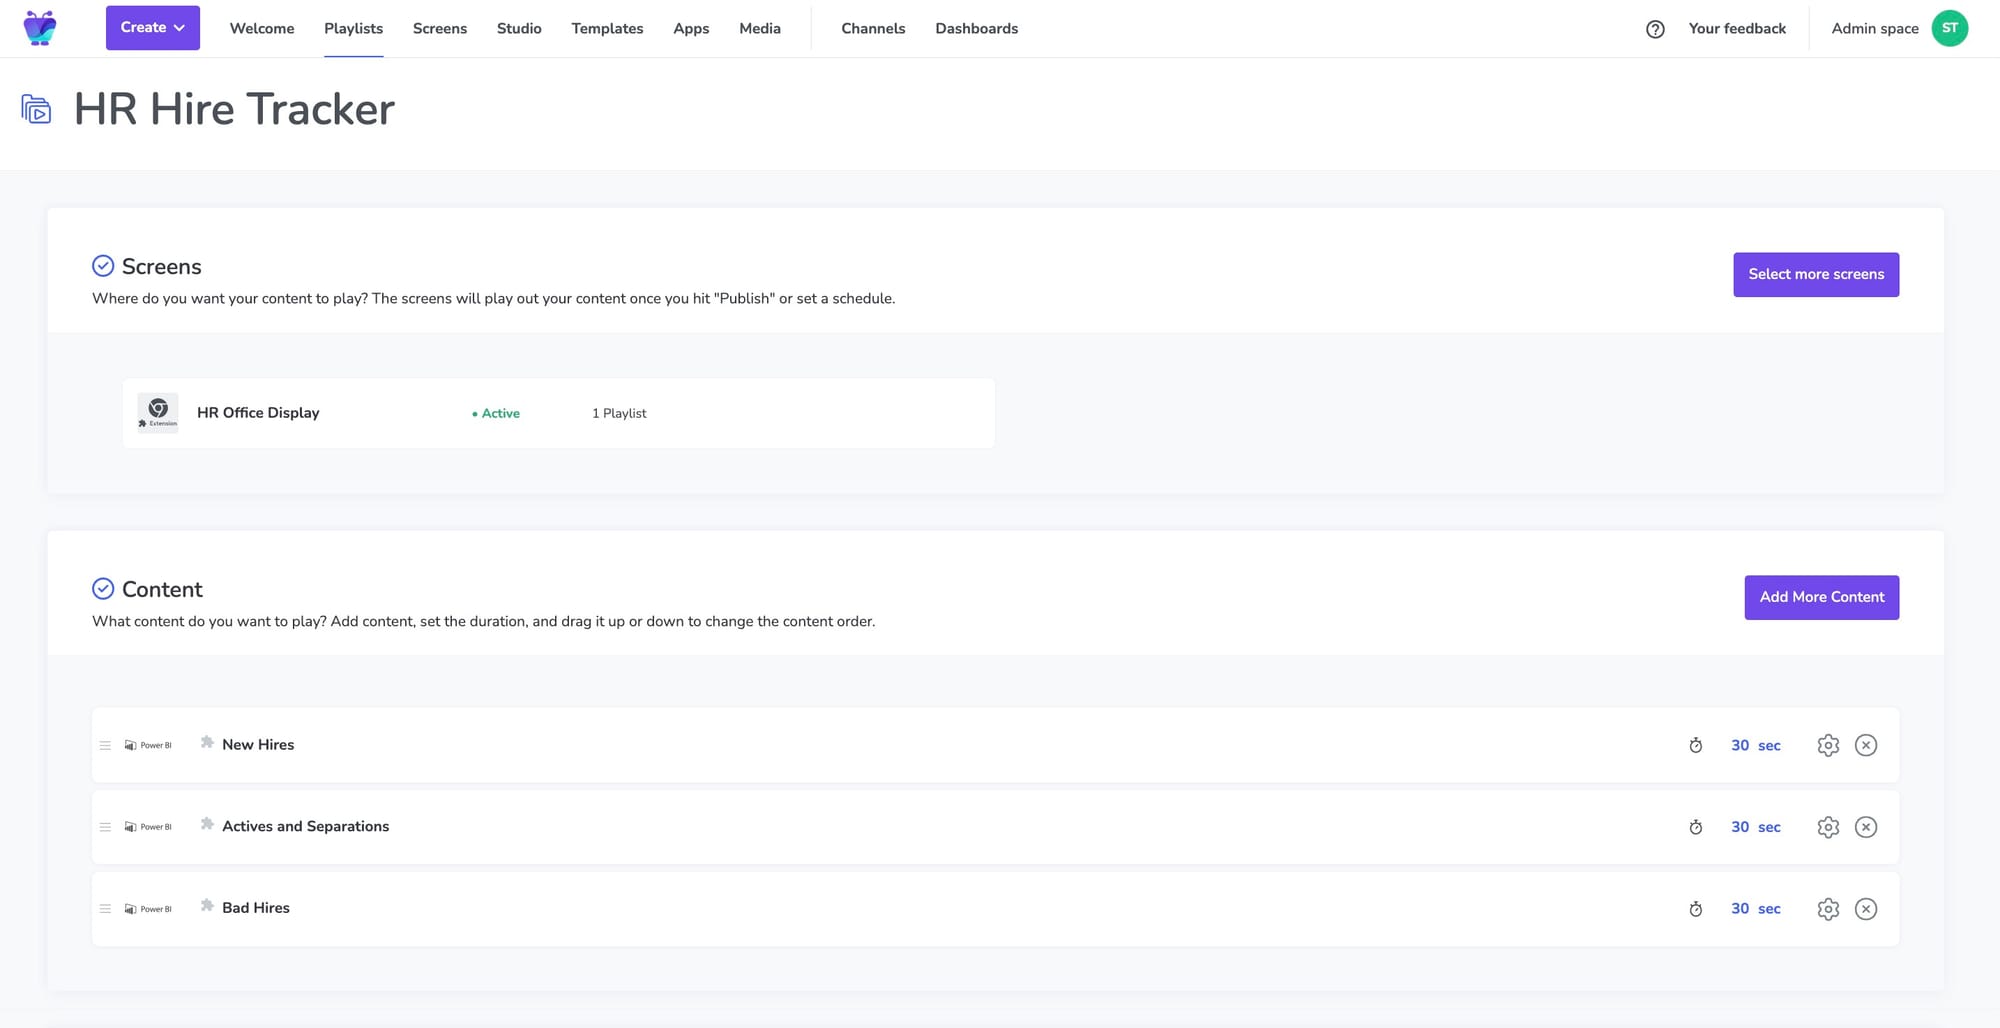
Fugo is one of them. It’s designed to take dashboards, reports, announcements, and more - and keep them up on screen without constant tinkering.
When it comes to Power BI, that means:
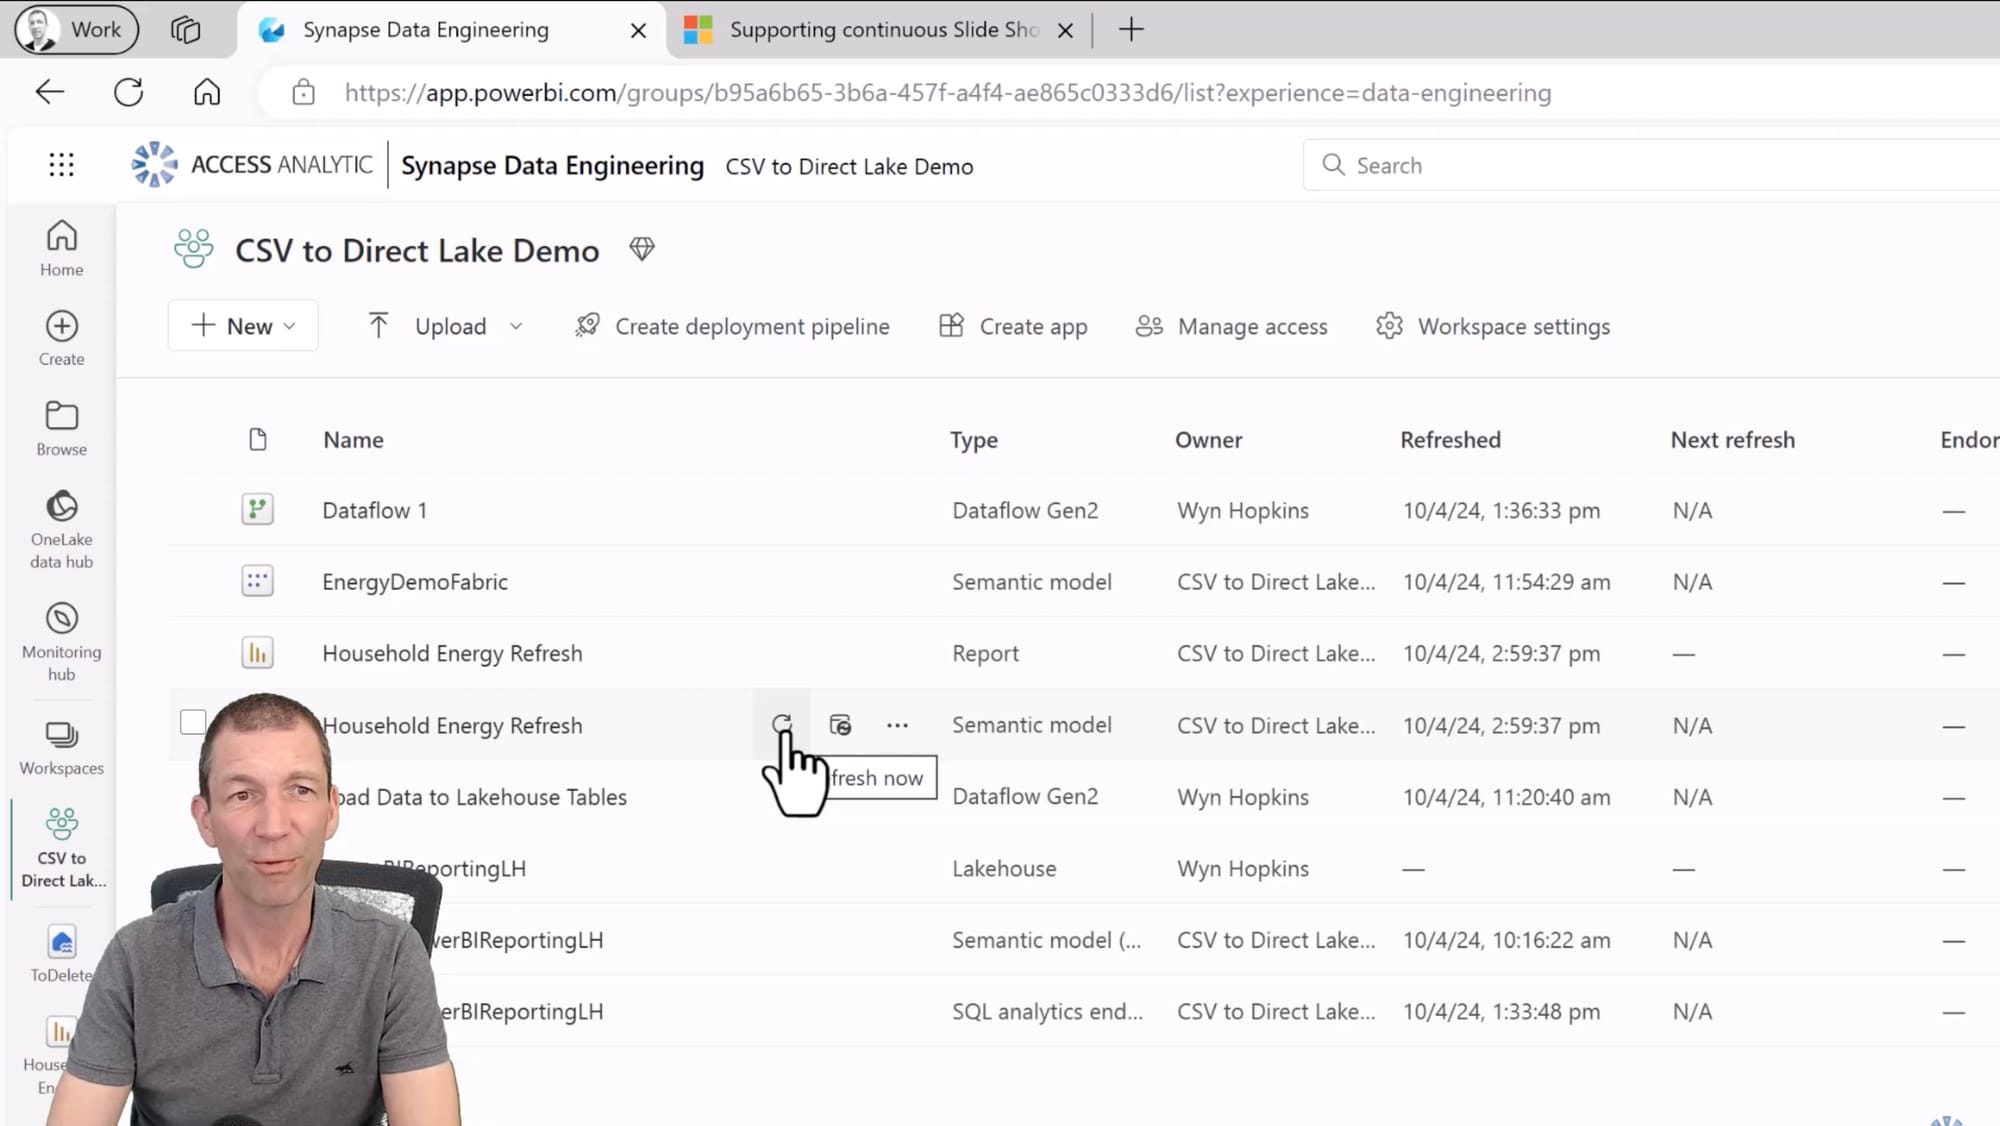
- You log into your Power BI account once through the Fugo interface
- You choose the dashboard or report you want to display
- You assign it to a screen (or many screens)
- It stays up, refreshes automatically, and works even if no one’s watching
There’s no laptop to manage. No HDMI cables to juggle. No worries about whether the Power BI add-in is approved or blocked. And no guessing what each screen is actually showing.
Plus, it works on hardware that can’t run Power BI natively - like older signage players or budget-friendly smart TVs. Fugo can render the report remotely and send it to the screen as an image, so even low-powered devices stay in the loop.
Feature comparison break down between PowerPoint & Fugo
Here's a quick overview of the pros & cons of both platforms:
| Feature | Power BI add in for PPT | Fugo Power BI app |
|---|---|---|
| Live data display | ✅ Live data embedded in slides via add-in | ✅ Live dashboards streamed to screens |
| Interactive visuals | ✅ Slicers, drill-through, bookmarks supported | ➖ Not interactive on-screen (read-only display) |
| Single visual embedding | ✅ Can embed individual charts/tables | ➖ Each instance reflects full report/page |
| Auto-refresh | ✅ Refreshes during slideshow (interval-based) | ✅ Background refresh every 5 min (default); customizable in screenshot mode |
| Looping dashboards | ✅ Possible via slide transitions | ✅ Native support via playlists |
| Real-time filtering per screen | ➖ Not supported | ✅ Per-screen slicer control & filtered views |
| Multi-screen support | ➖ Requires manual duplication | ✅ Centralized management for many screens |
| Remote management | ➖ Must update deck & re-cast | ✅ Update dashboards/playlists from anywhere |
| Offline fallback | ➖ No fallback if session breaks | ✅ Displays cached dashboard if offline |
| Admin approval required | ✅ Often needed in enterprise tenants | ✅ Same Power BI permissions model applies |
| Hardware compatibility | ⚠️ Needs modern browser; no support on most signage players | ✅ Screenshot mode supports smart TVs, sticks, & low-powered devices |
| Ease of setup | ✅ Add-in from ribbon; paste link or select report | ✅ Login once; select reports directly from Power BI account |
| Authentication handling | ⚠️ May need frequent re-login if session expires | ✅ Automatic token refresh in background |
| Microsoft-native integration | ✅ Full suite synergy (Power BI + PowerPoint) | ➖ External app with Microsoft-approved integration |
| Pricing model | Included with Microsoft 365; governed by Power BI licensing | Requires Fugo Core/Enterprise + Power BI license |
Now let's get a bit nerdy and look at the feature sets on offer!
PowerPoint Power BI add in features
If you’re already using PowerPoint across your organization, the Power BI add-in offers a flexible way to bring live data into your slide decks - especially for meetings, screen sharing, or temporary displays.
Since it’s built by Microsoft, it inherits tight integration with the Power BI service and the broader M365 ecosystem.
Here’s a breakdown of what you get:
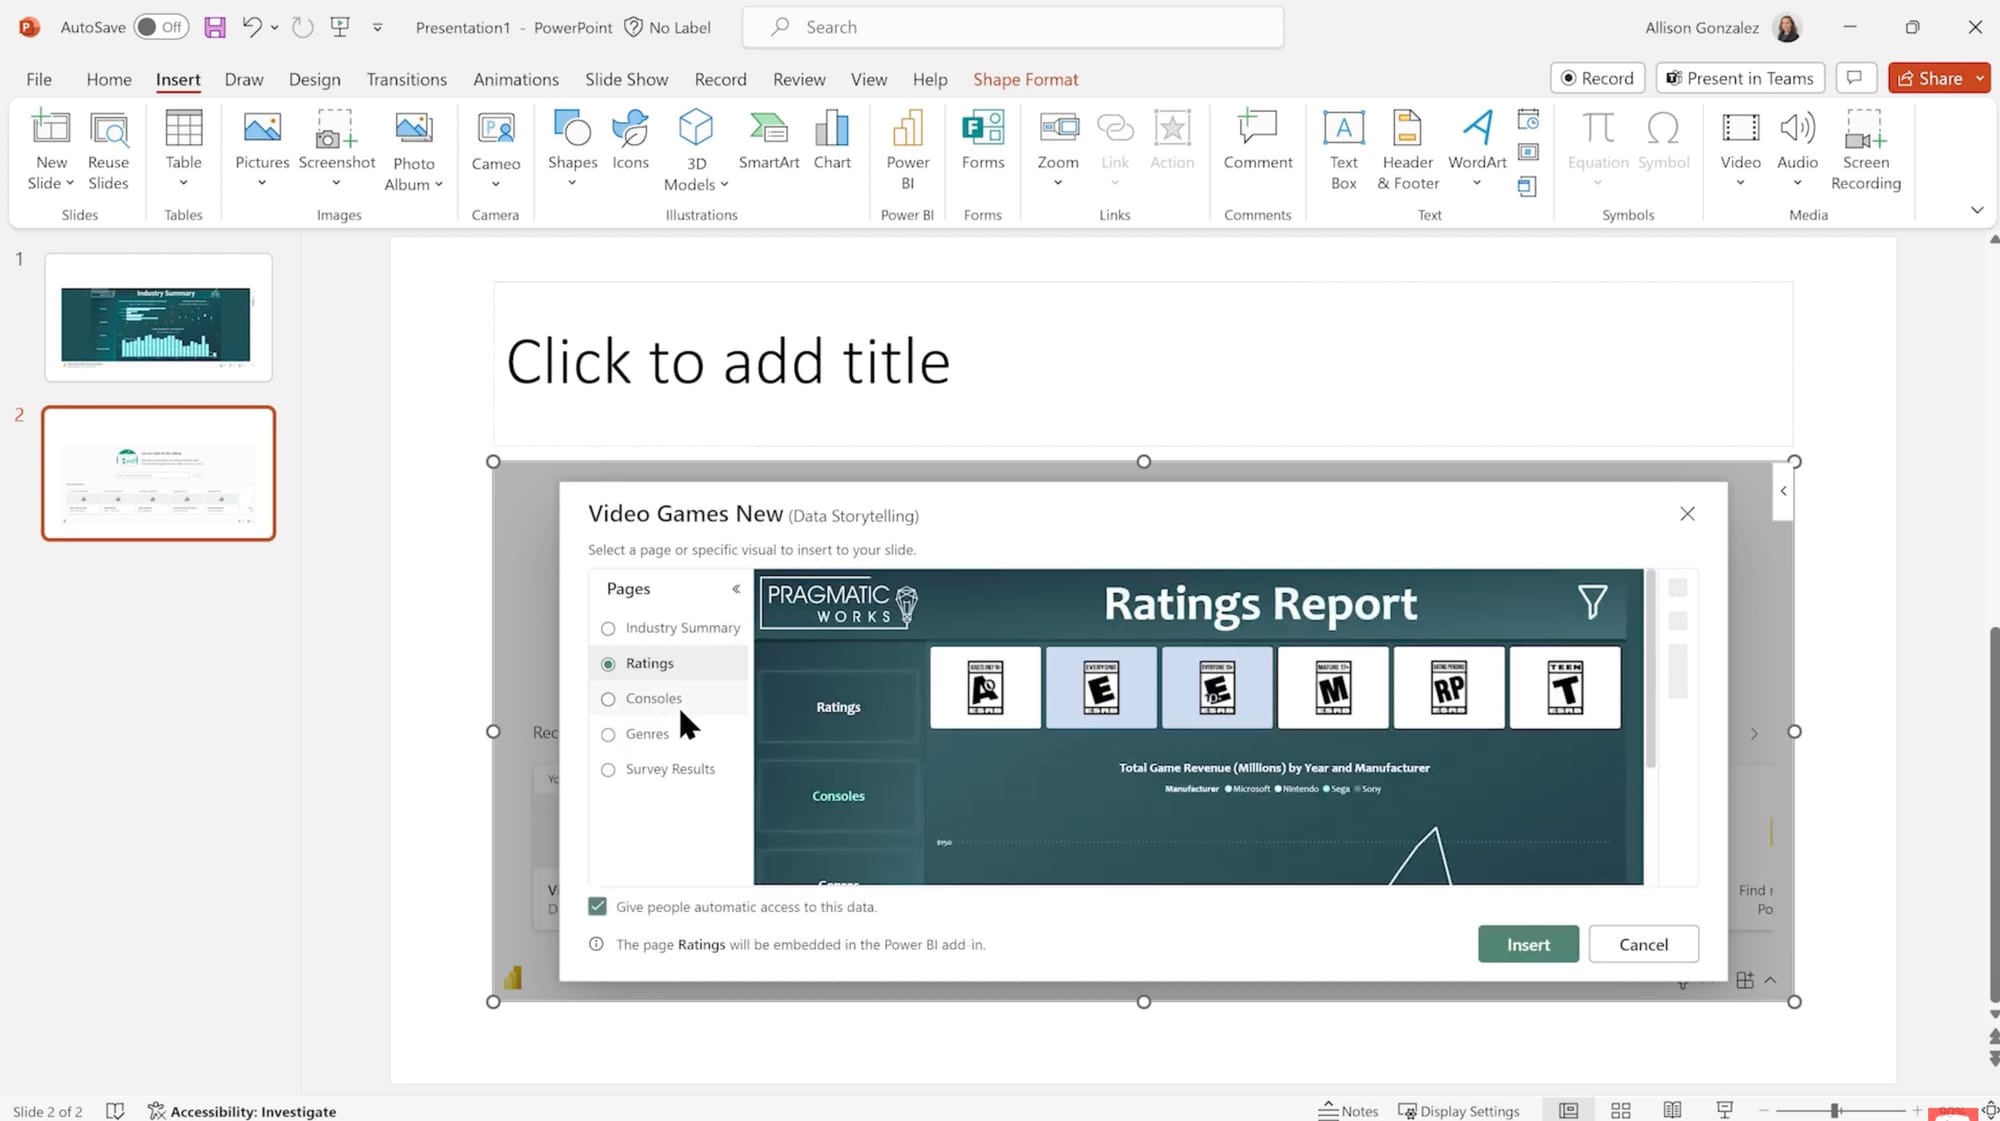
1) Live report embedding
You can embed full Power BI report pages directly into your slides, preserving interactivity.
- Visuals stay connected to the Power BI Service - they’re live, not static images.
- Slicers, filters, drill-through links, and bookmarks all remain usable during playback.
2) Single visual embedding
Need more control over layout or pacing? You can embed individual visuals instead of full reports.
- Great for building slide-by-slide stories with specific KPIs or charts.
- Even visuals from organizational apps (not just workspace reports) are supported, depending on access.
3) Auto-refresh during slideshow playback
PowerPoint now supports timed auto-refresh intervals during a slideshow.
- You can configure dashboards to update every few minutes (or other set intervals).
- Combine with slide timings and transitions to build a looping dashboard carousel.
4) Integrated report picker inside PowerPoint
Once the add-in is installed, you can insert reports directly from the ribbon menu.
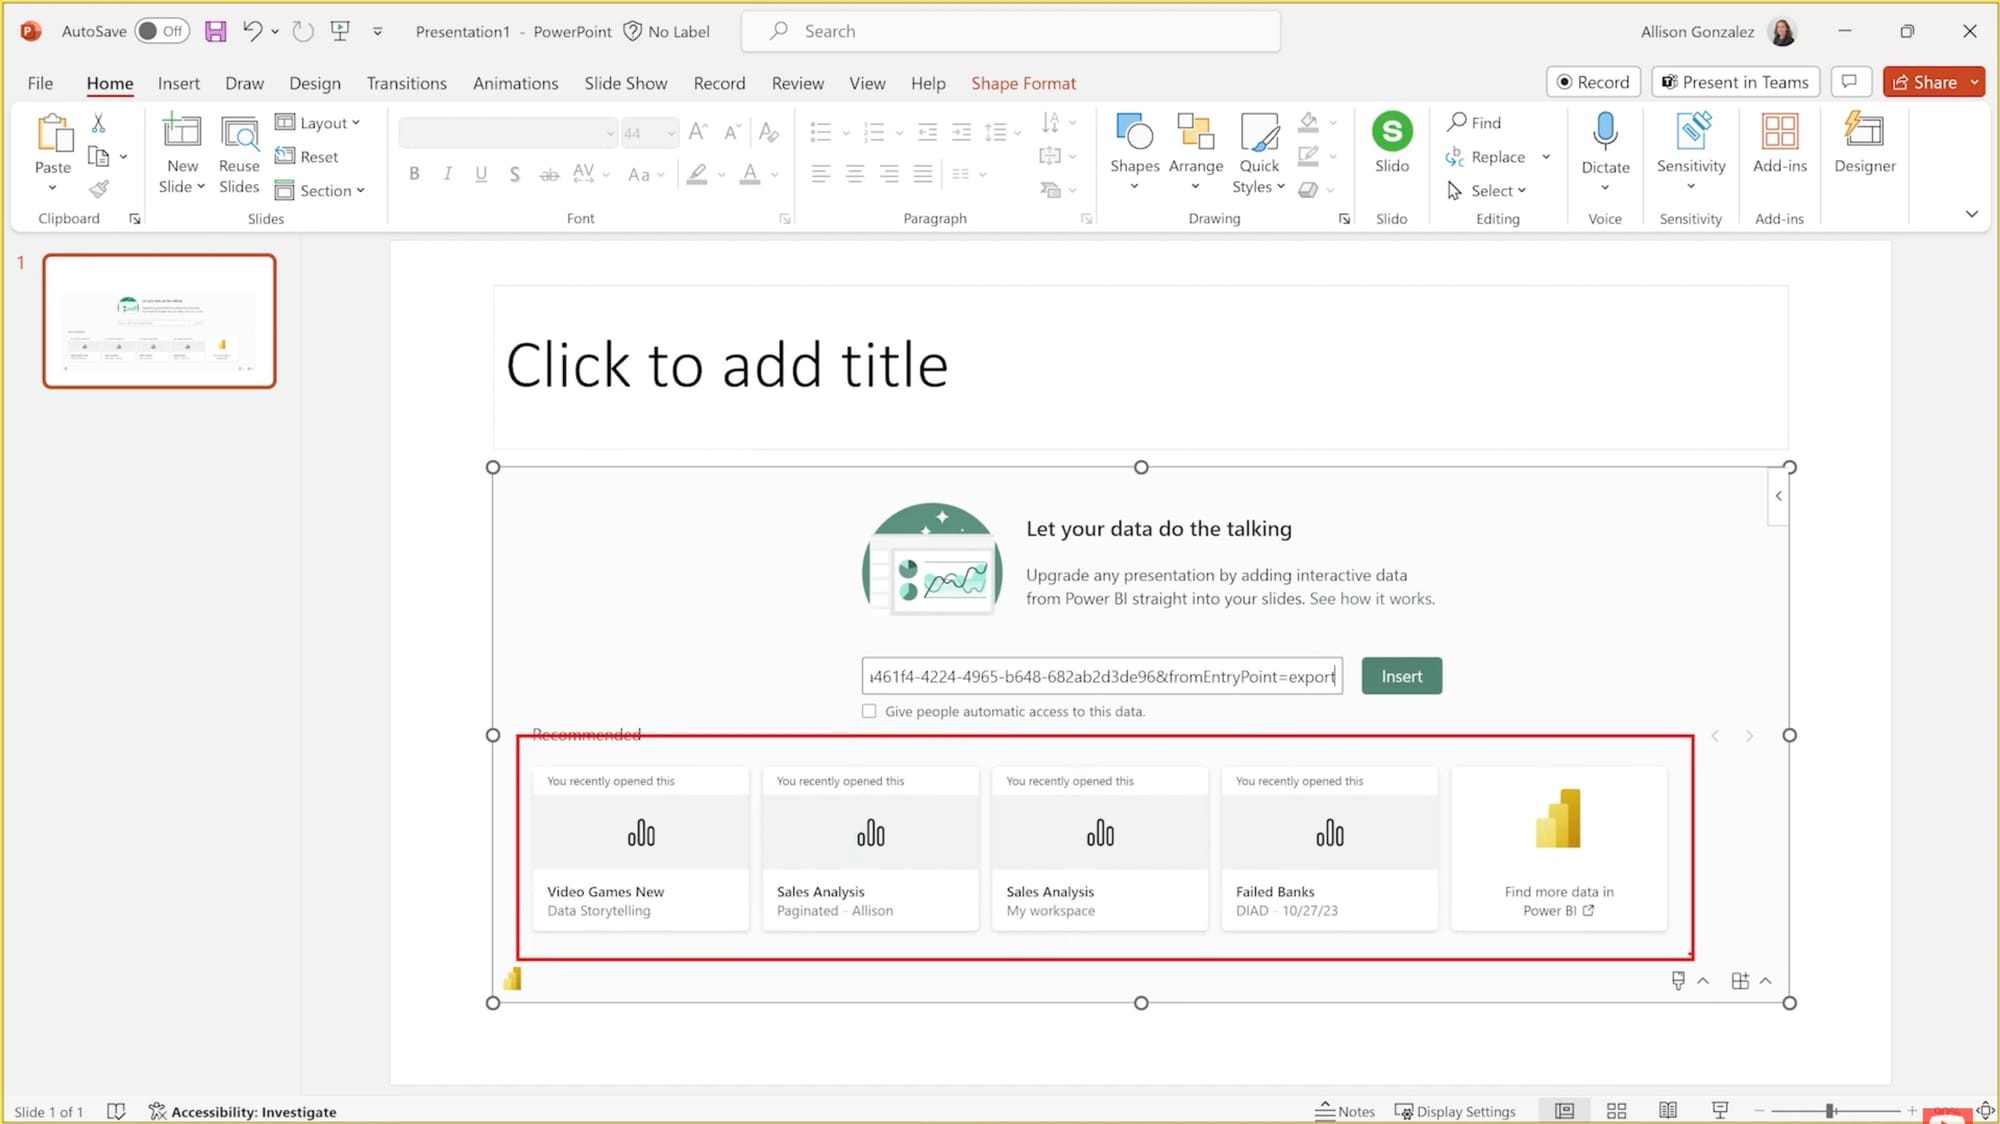
- Paste a URL, pick from your recent reports, or browse report pages/visuals within the selector.
- No need to leave PowerPoint to locate the right report.
5) Real-time interaction during presentations
All embedded visuals remain clickable and filterable.
- You can change slicers, interact with charts, or use bookmarks to guide the story.
- Ideal for Q&A-driven meetings where flexibility matters.
6) Built-in smart narrative support
Power BI’s AI-generated summaries can be used to automatically describe visuals.
- You can copy smart narrative text into PowerPoint to explain trends or anomalies.
- Saves time compared to manually writing commentary on each chart.
7) Secure, permission-aware sharing
All data access is governed by Power BI permissions and RLS (row-level security).
- Embedding doesn’t export data - it’s streamed securely via your authenticated login.
- You can also restrict others from interacting with the data after the deck is shared.
8) Choose which report pages to include
Rather than defaulting to page one, you can select the exact pages you want when embedding.
9) Flexible design layout
Embedded visuals behave like native PowerPoint objects.
- Resize, position, or style them using PowerPoint’s design tools.
- Layer them alongside other text, media, or graphic elements.
10) Export options from Power BI
You can export Power BI content to PowerPoint directly via the web interface.
- Choose between static images or live embedded reports.
- Microsoft also offers a storytelling button that creates a ready-to-edit PowerPoint deck from a report.
System & license notes
- Requires Microsoft 365 (Office version 2312 or later) and WebView2 installed.
- Power BI Free licenses can view reports hosted in Premium/Fabric capacity.
- Otherwise, a Power BI Pro license is needed to view non-Premium content.
- Add-in installation may require admin approval in enterprise environments.
Strategic benefit: First-party synergy
Many of the strengths listed above come down to the fact that Power BI and PowerPoint are first-party tools within the Microsoft 365 ecosystem. That native relationship brings real advantages:
- Seamless authentication through Azure AD
- Shared licensing across M365 tools
- Built-in governance and policy support for enterprise admins
- Consistent user experience across the suite
For teams already operating inside Microsoft’s environment, this makes embedding live data into presentations feel natural with minimal friction, minimal setup, and minimal risk of compatibility issues. It’s a strong, stable solution for Power BI storytelling when the context is a meeting, a deck, or a shared screen session.
Fugo features
If the Power BI PowerPoint add-in is best for meetings, Fugo is best for ambient visibility. That is, putting your live dashboards on the workplace screens that teams walk past, gather around, or rely on to spot trends.
It’s designed to remove manual steps and give IT, managers, and data owners full control over where and how Power BI content appears across a network of screens.
Here’s what you get with Fugo:
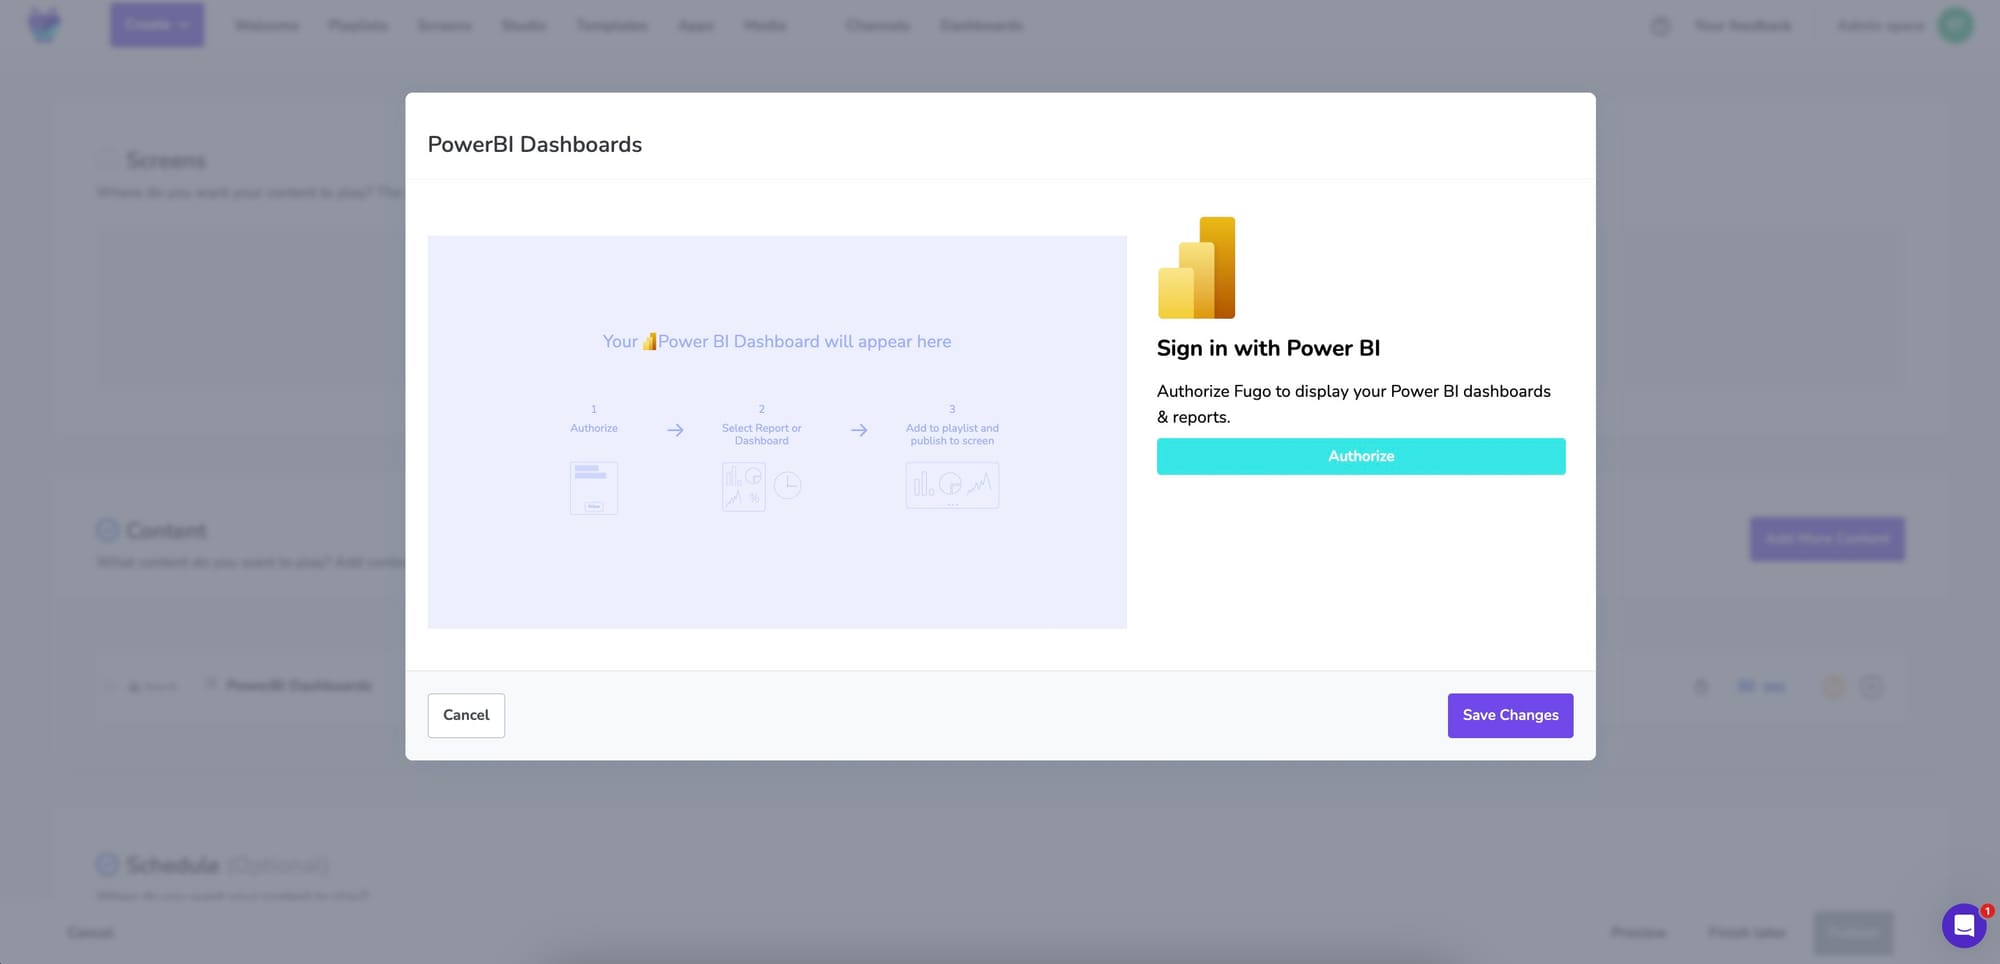
1) Native Power BI authentication
Fugo connects to Power BI using secure OAuth login. You sign in once with your Microsoft 365 account (no embed codes or shared logins.) The app respects your existing permissions and only shows reports you’re authorized to access.
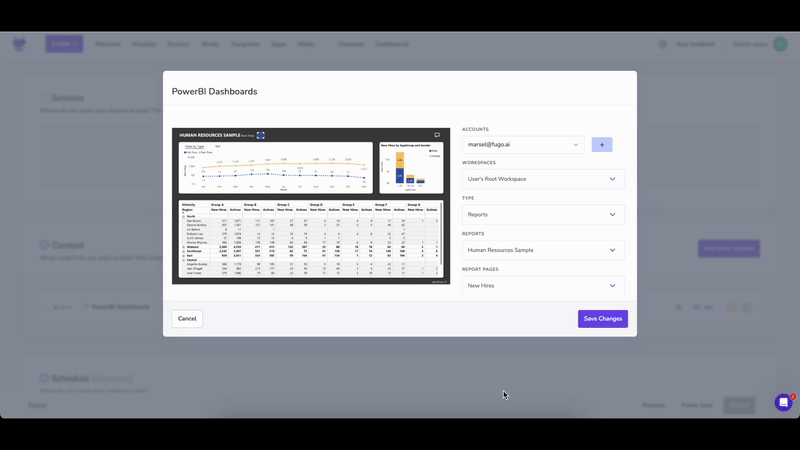
2) Create multiple instances from a single report
Each report page or filtered view is set up as a separate “instance” within Fugo. You can create as many as you like - for different teams, regions, or KPIs - and organize them in playlists to control what appears on screen.
3) Slicer-based filtering per screen
Want to show the same dashboard, filtered differently on each screen?
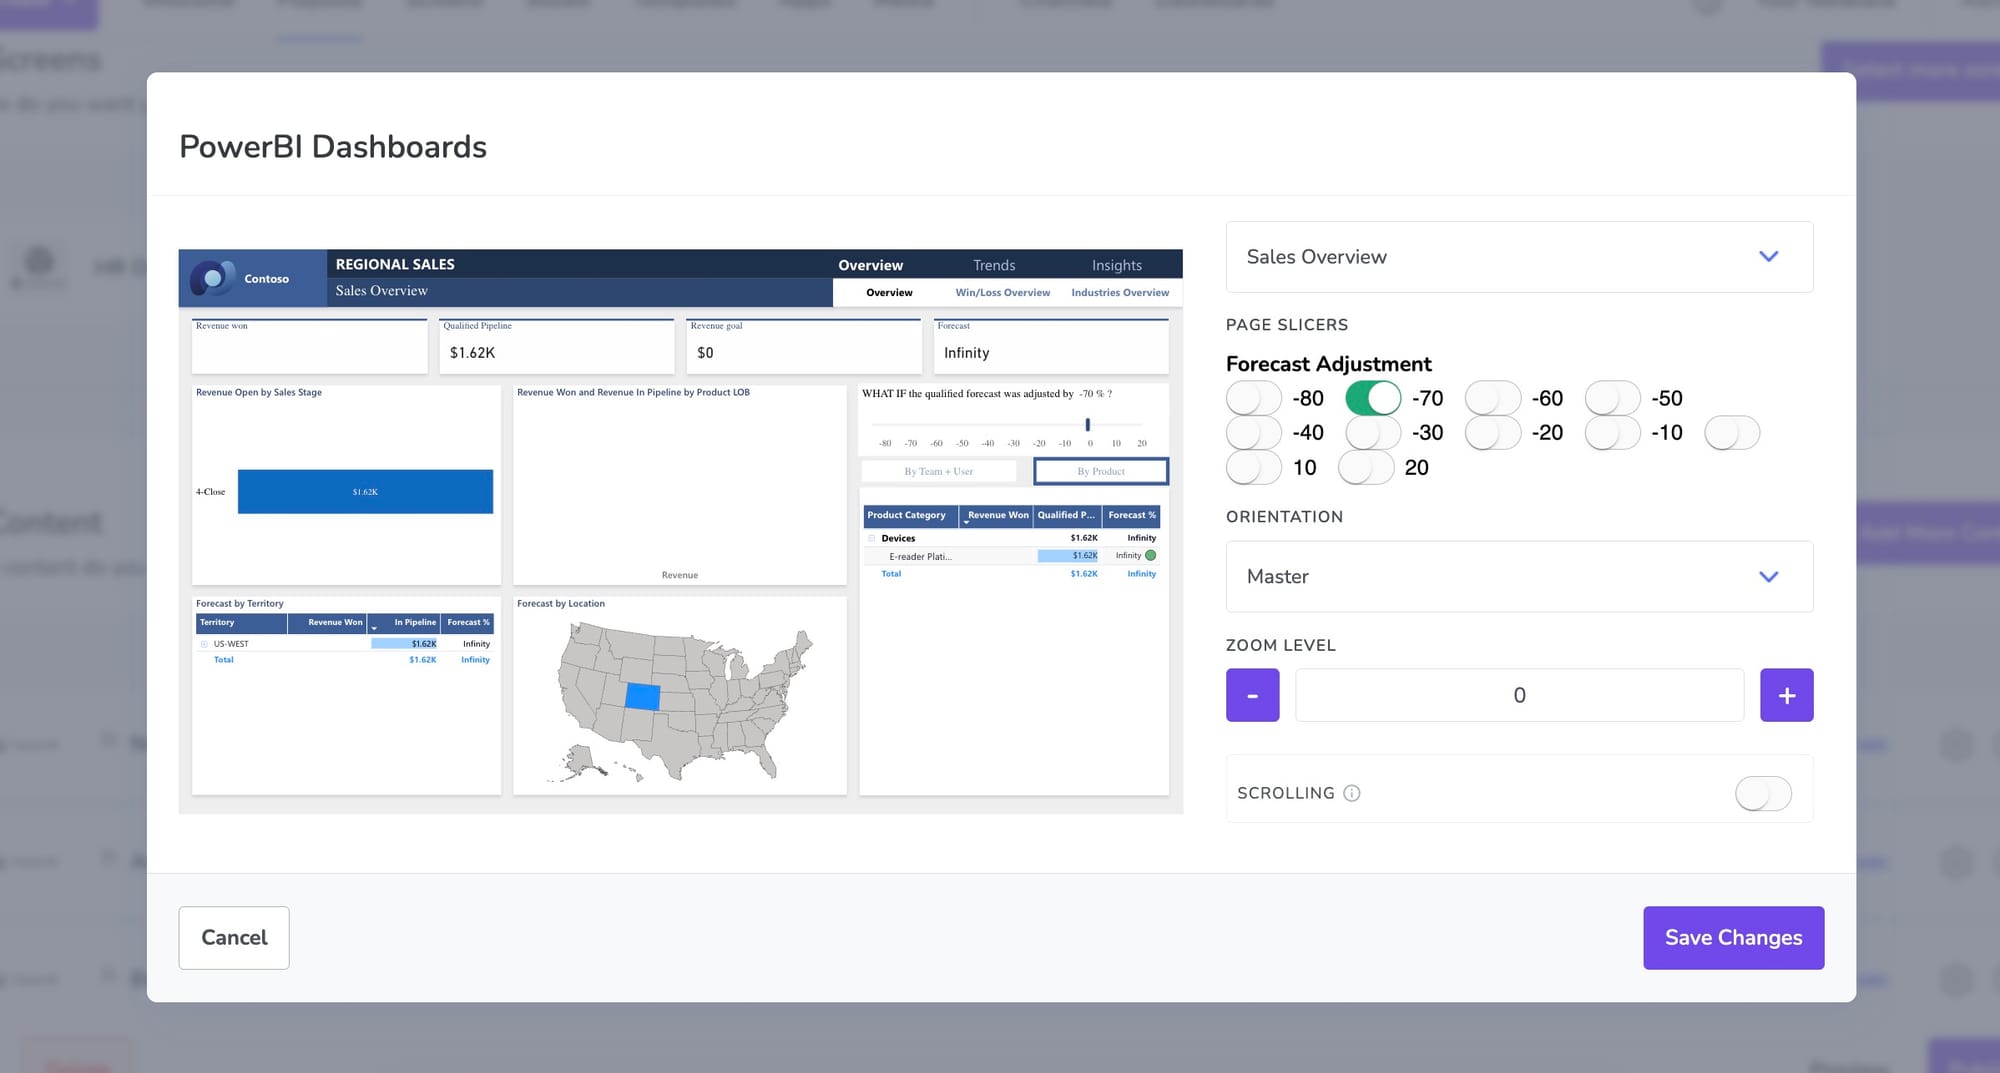
Fugo supports slicer parameters, so you can assign region-specific or team-specific views without duplicating your Power BI reports.
4) Dynamic screen assignment via playlists
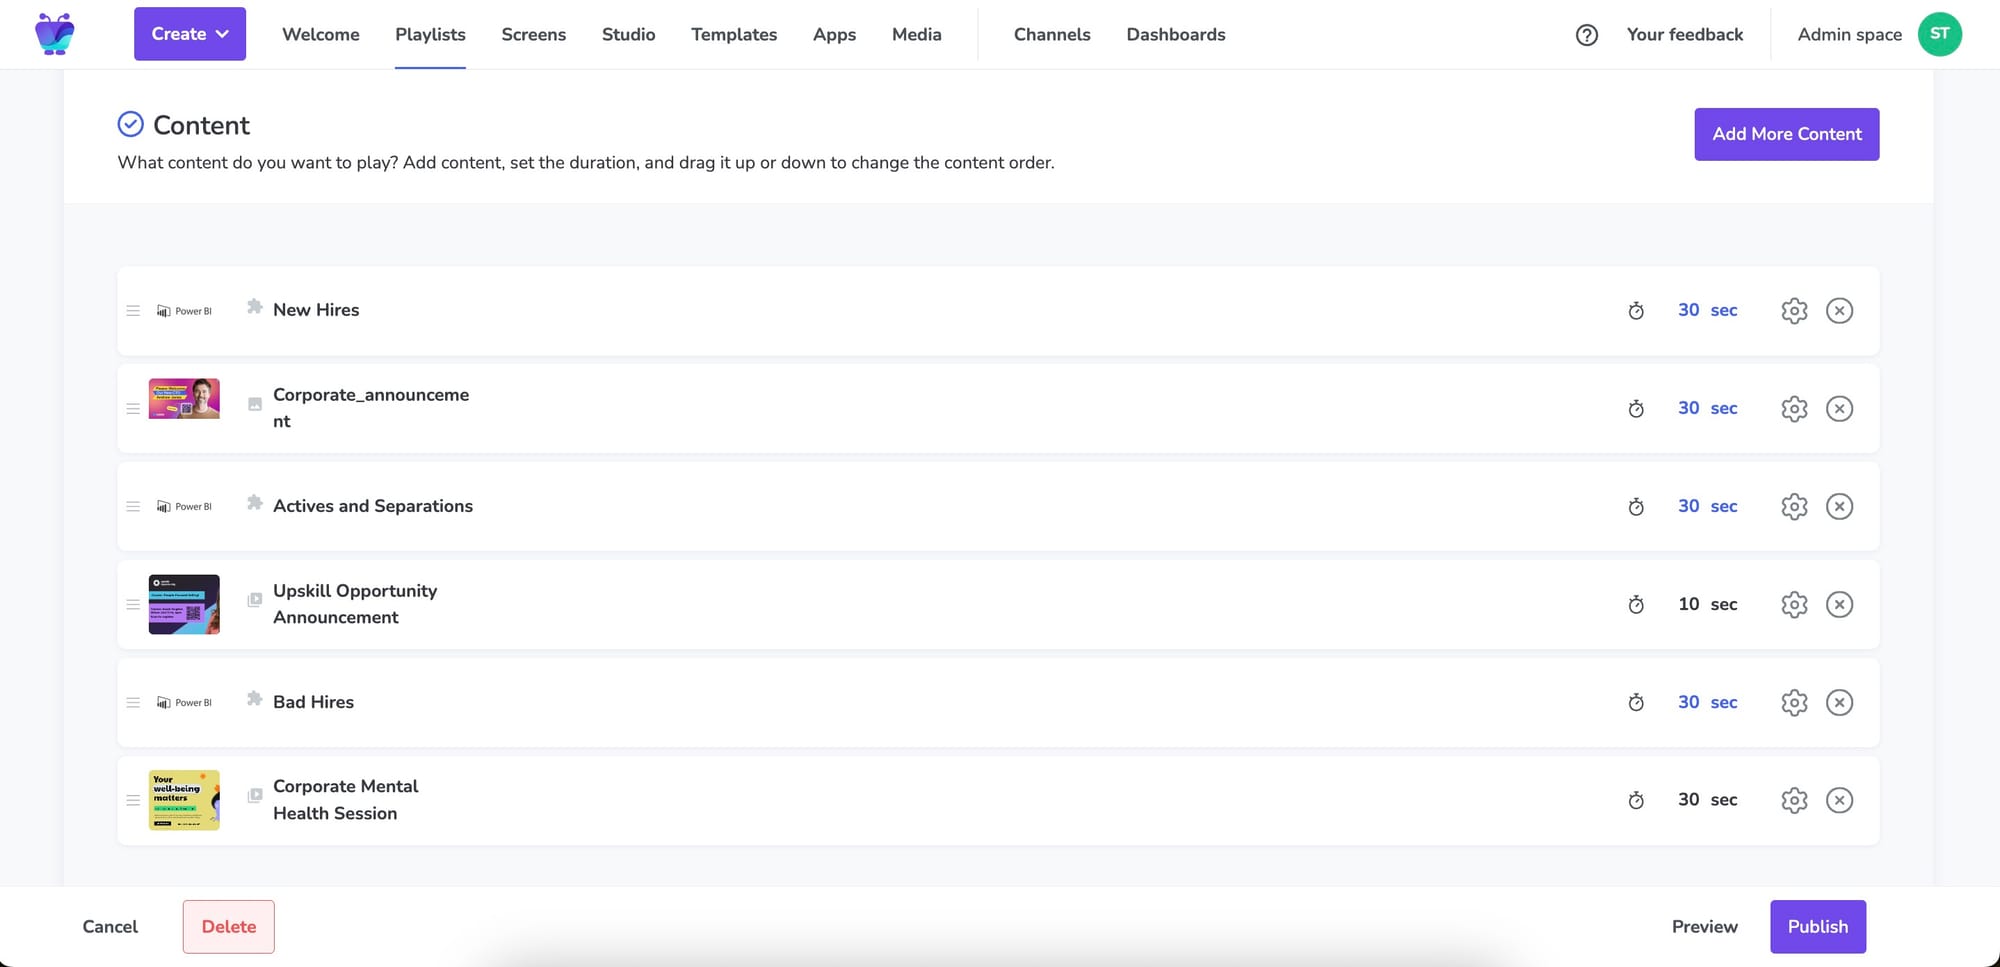
Dashboards or reports are added to playlists, which are then assigned to screens.
Playlists can contain multiple dashboards, rotate through them in sequence, and even combine dashboards with other content like videos or announcements.
5) Screenshot mode for low-powered devices
Some devices (e.g. smart TVs or Android sticks) can’t run the modern browser required for Power BI.
Fugo’s screenshot mode renders the dashboard in the cloud, captures it, and sends an image to your screen, preserving visual fidelity and performance.
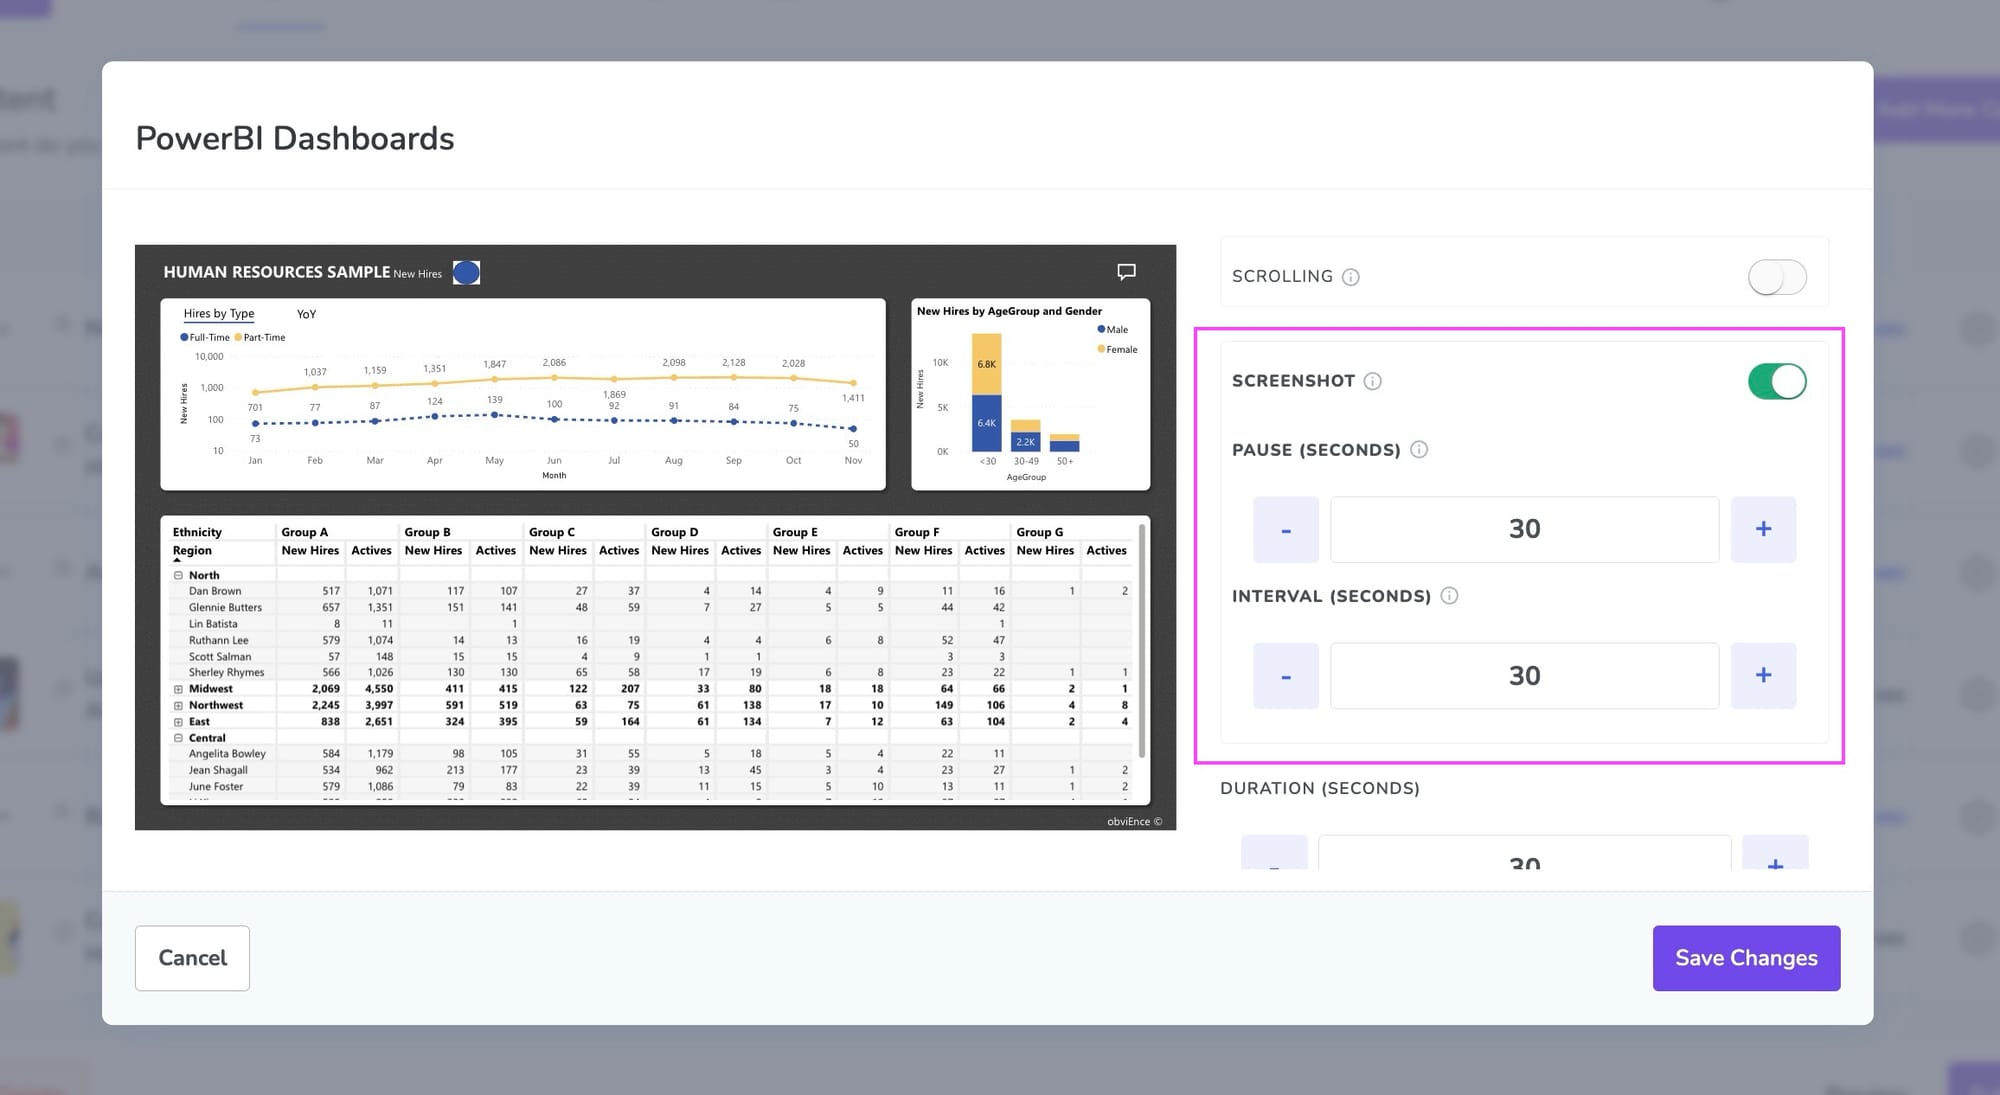
6) Customizable refresh intervals
When using screenshot mode, you control how often the dashboard is re-captured — e.g. every 2, 5, or 15 minutes. This is especially useful for near-real-time dashboards that update frequently.
7) Token refresh handled automatically
Fugo manages your Power BI login tokens in the background, ensuring that sessions stay live without manual re-authentication. If your session expires, Fugo silently refreshes it with no impact on the screen content.
8) Offline fallback caching
If your screen loses connectivity or Power BI becomes temporarily unreachable, Fugo continues to display the most recent cached version of the dashboard or report - preventing screens from going blank.
9) Remote screen & content management
All screen content - including Power BI - is managed from Fugo’s cloud dashboard.
You can monitor playback, update playlists, swap reports, or adjust refresh settings without visiting the device in person.
10) Compliance with Power BI permission model
Fugo never bypasses Power BI’s native security model. Row-level security (RLS) is enforced, and only authorized users can configure the integration. This ensures that sensitive data doesn’t appear where it shouldn’t.
System & license requirements
Fugo’s Power BI integration is available on Core and Enterprise plans. Each screen requires its own Fugo license, but there’s no limit on how many dashboards or instances you create.
When to stick with PowerPoint and when to move on
If you’re sharing a Power BI report in a live presentation setting - say, in a meeting room with a single screen, where someone will be interacting with the dashboard in real time, then the PowerPoint method is a great fit. It’s built for that kind of use case: one screen, short duration, hands-on control.

But if you’re trying to make Power BI part of your team’s daily rhythm - where it’s always on, always refreshed, and reliably visible - you’ll likely want something more purpose-built.
Go with digital signage software for large-scale, long-term visibility.
Digital signage software solves for:
- The friction of setup and restarts
- The lack of visibility into what’s live
- The limits of device compatibility
- The complexity of managing access and refreshes at scale
In short, it’s a long-term solution, not a stopgap.
Want to try it for yourself?
If you’re ready to move past workarounds, Fugo’s Power BI app is a good place to start. You can get dashboards or reports on screen in minutes and finally retire that HDMI cable.

