


For teams just starting to get their Power BI dashboards onto a screen, PowerPoint is usually the fastest path.
You’re already using PowerPoint. You’ve got your data visualized in Power BI. Now there’s a screen in the office, and someone says: “Can we show this up there?”
So you do what’s intuitive: embed the report in a slide, plug a laptop into the screen, and let it run.
And it works for a while.
This guide walks through how to embed Power BI reports into PowerPoint (step by step), and what to do when the setup needs to last longer than a meeting.
We used tutorial resources created by Pragmatic Works to create this guide. If you want to follow along to a video, check out this one by their team that does a great walk-through of the PowerPoint Power BI add in.
Step-by-step: How to embed Power BI in PowerPoint
Here's what you'll need before you start
Make sure your setup meets the following requirements:
- A Microsoft 365 account with access to both Power BI and PowerPoint
- A Power BI Pro license, unless the report is stored in a Premium or Fabric F64+ capacity workspace
- PowerPoint version 2312 (Build 17126 or later)
- WebView2 runtime installed on your machine (required for add-in functionality)
- Access to the Office Add-in Store, or the Power BI add-in must be deployed by your IT administrator
- Viewer access to the Power BI report, with any relevant row-level security (RLS) permissions configured
Important notes:
- In national or regional cloud environments (e.g., government tenants), the Office Add-in Store is not available. In these cases, your IT team must deploy the Power BI add-in as an admin-managed add-in.
- If autolicensing is enabled, users without a Power BI account will automatically be signed up when they open a presentation that contains an embedded report or visual. This may impact license usage and allocation in your organization.
- If autolicensing is disabled, users without existing Power BI accounts will be prompted to sign up before they can view embedded content.
Are you a Fabric admin? We recommend you check out Microsoft Ignite's instructions for the full rundown on requirements, licensing, and how to make the add in available to your organization.
Option 1: Add live data to an existing PowerPoint presentation
1. Install the Power BI add-in for PowerPoint
- Open your PowerPoint presentation or start a new one.
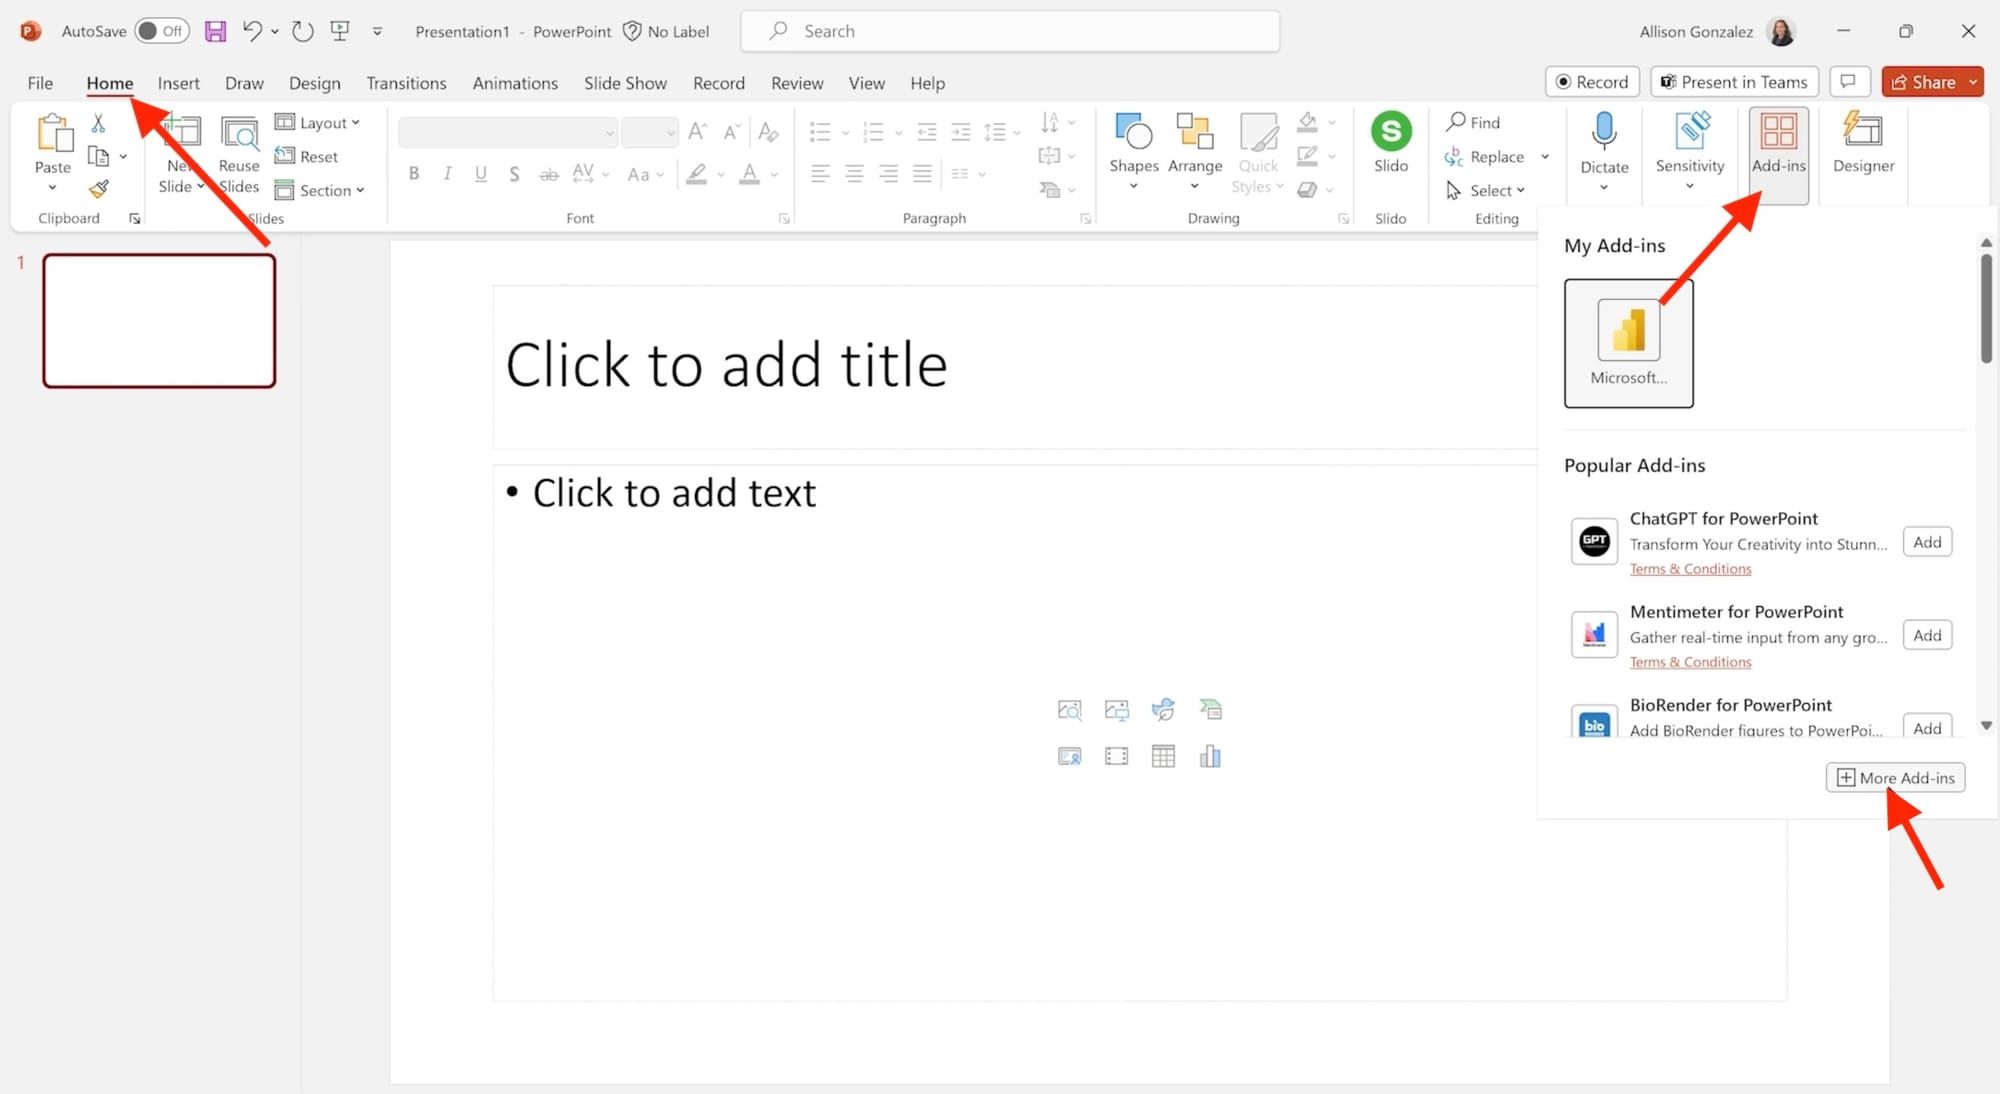
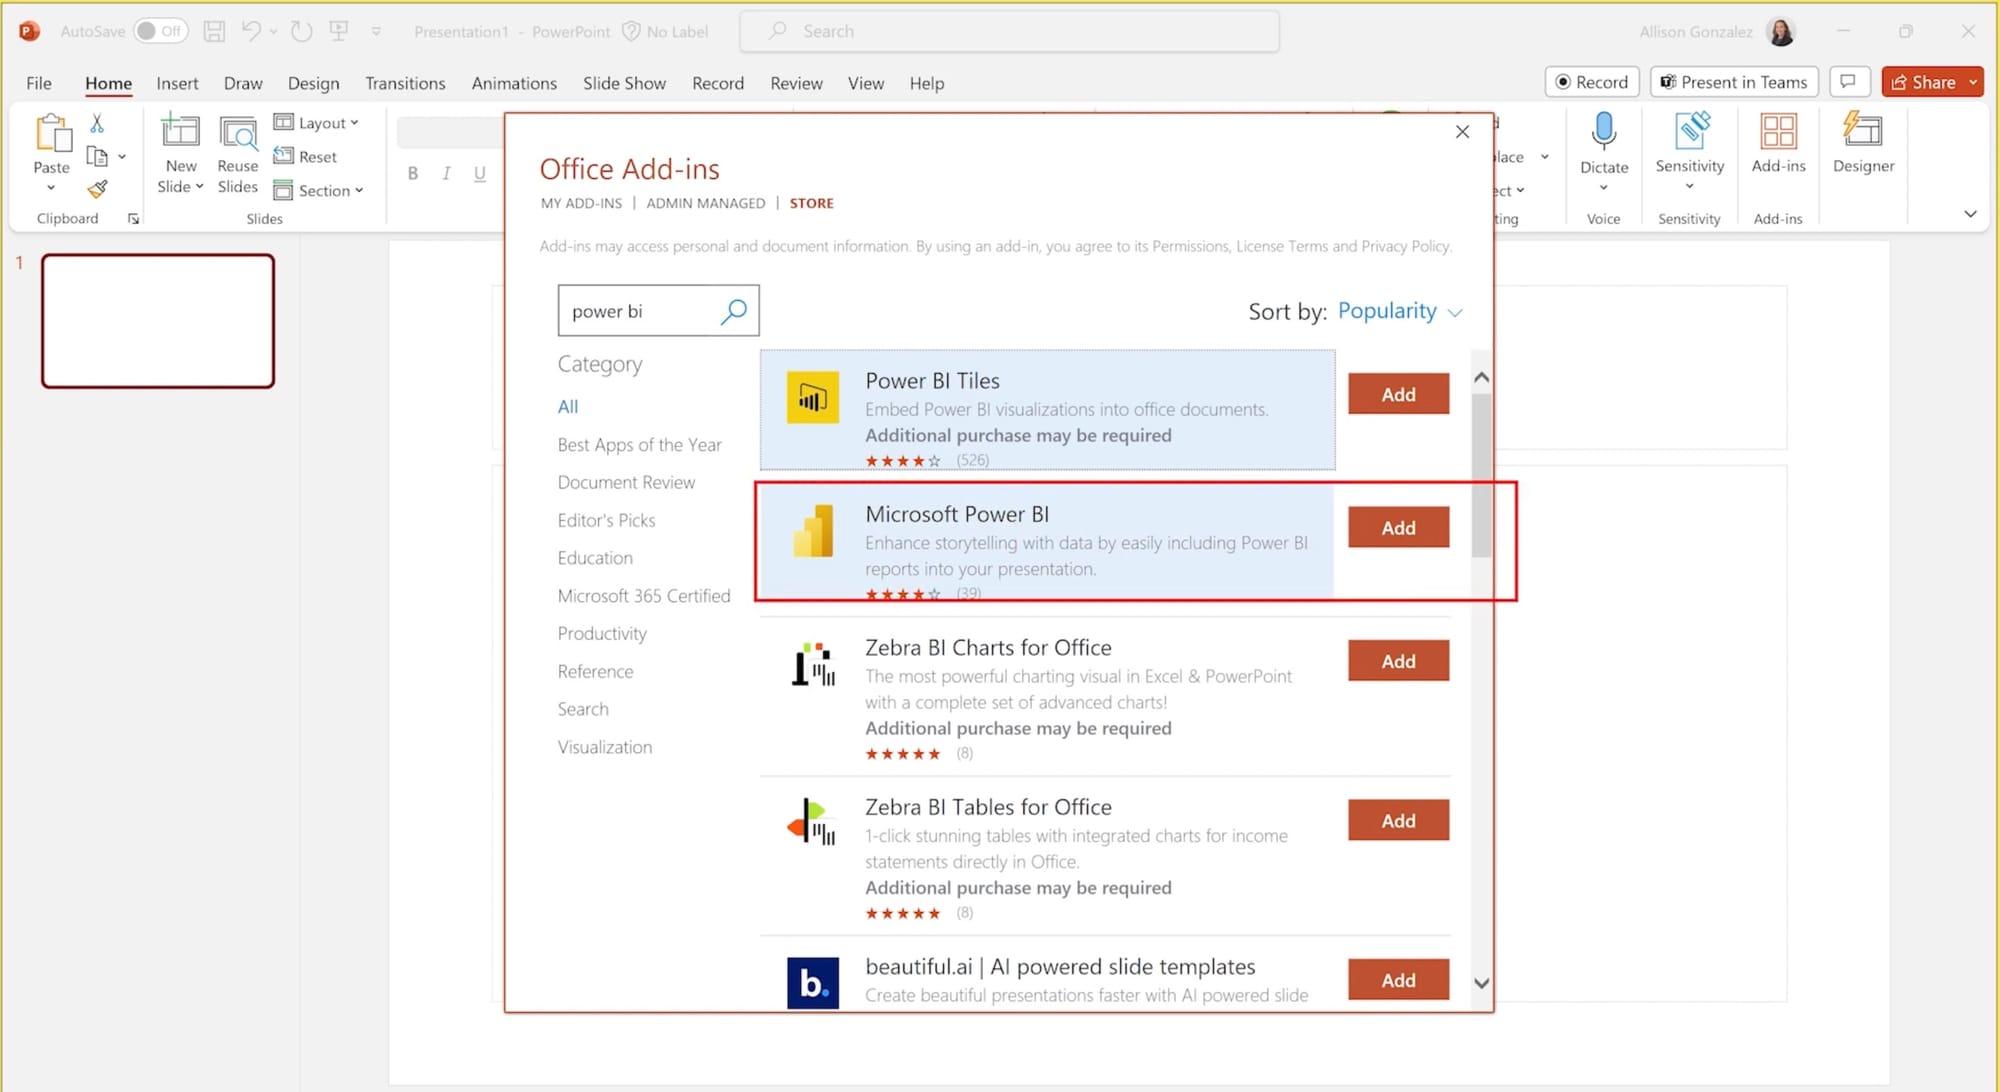
- Go to Home → Add-ins. Click More Add-ins.
- Find the Microsoft Power BI add in and install it.
2. Launch the add-in
If you just installed the add-in, it will load on your slide.
If you've already installed the add-in, it may be in your Insert ribbon. Click Insert > Power BI on any slide.
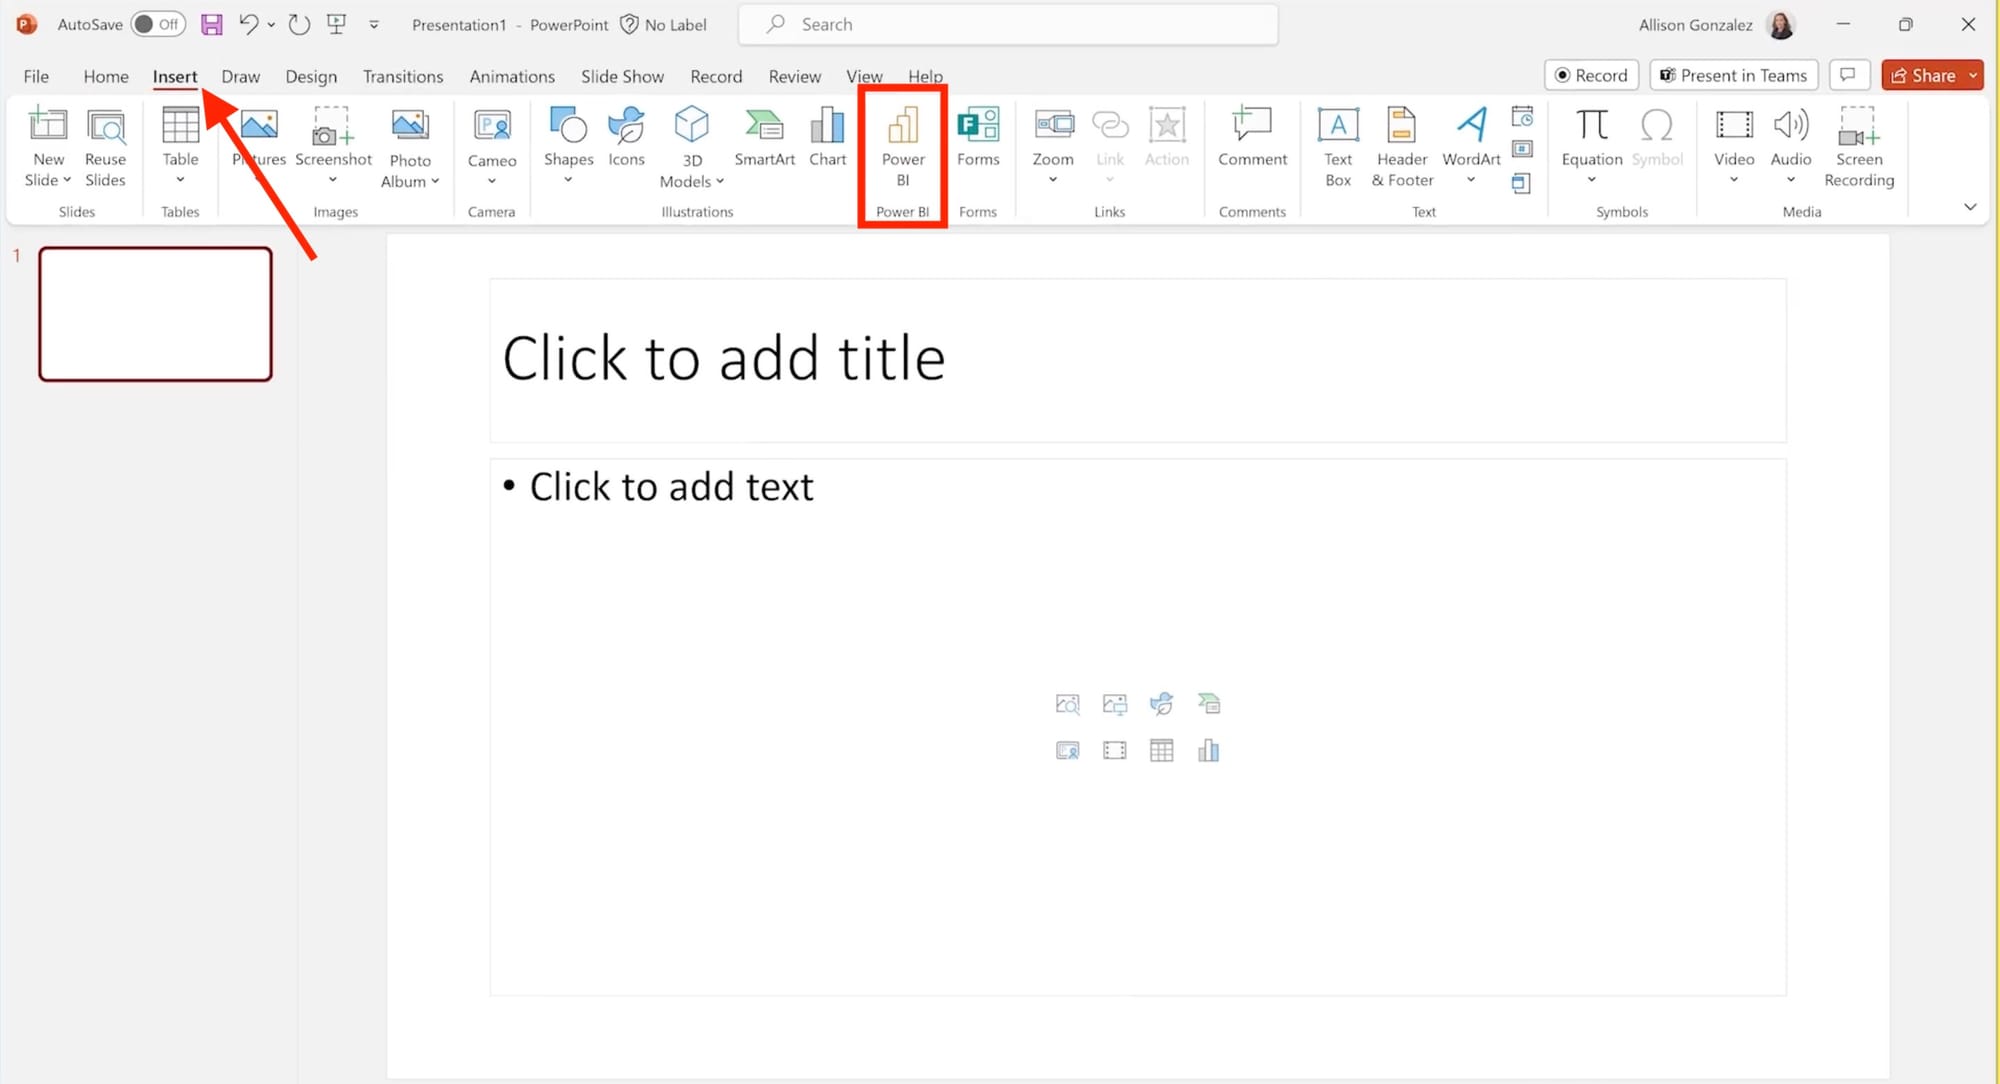
(If it's not in your ribbon, then click Home > Add ins > and find the Power BI add in.)
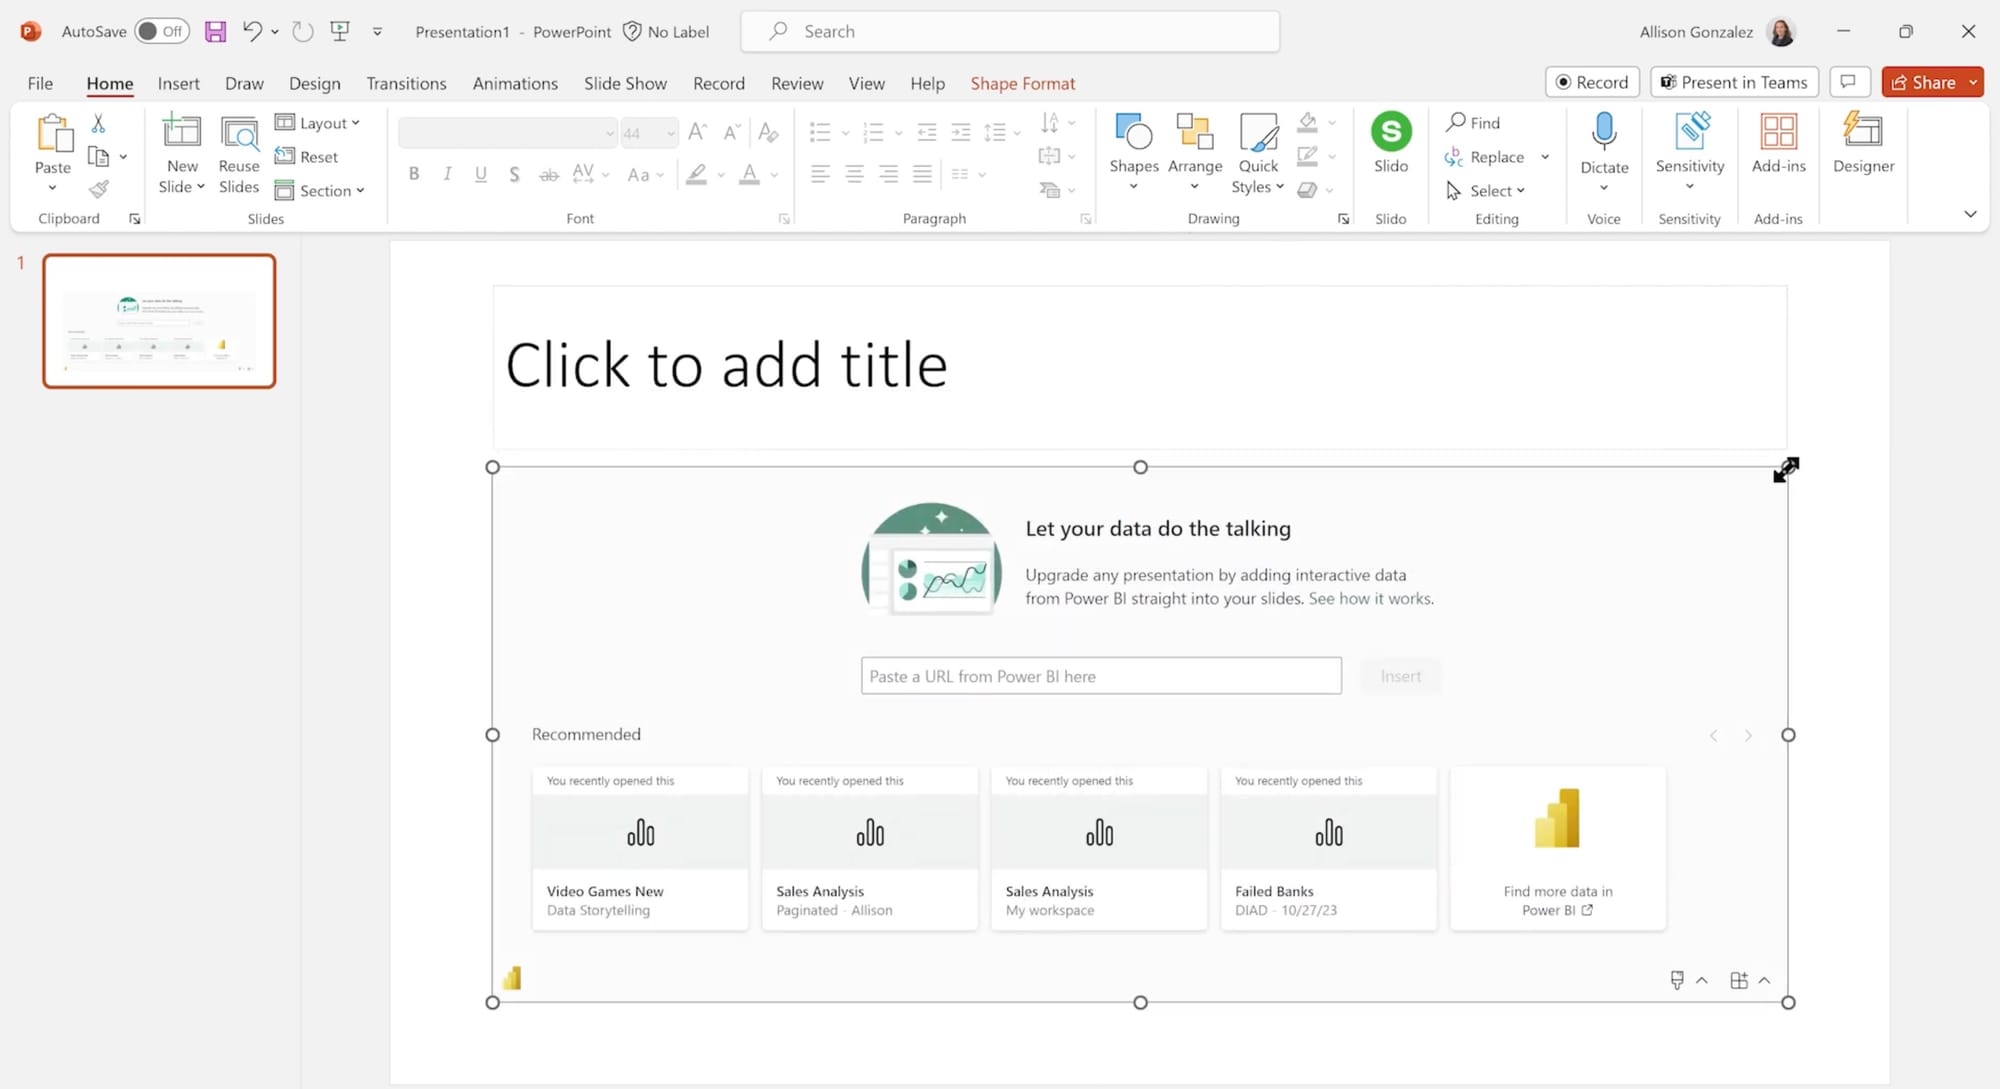
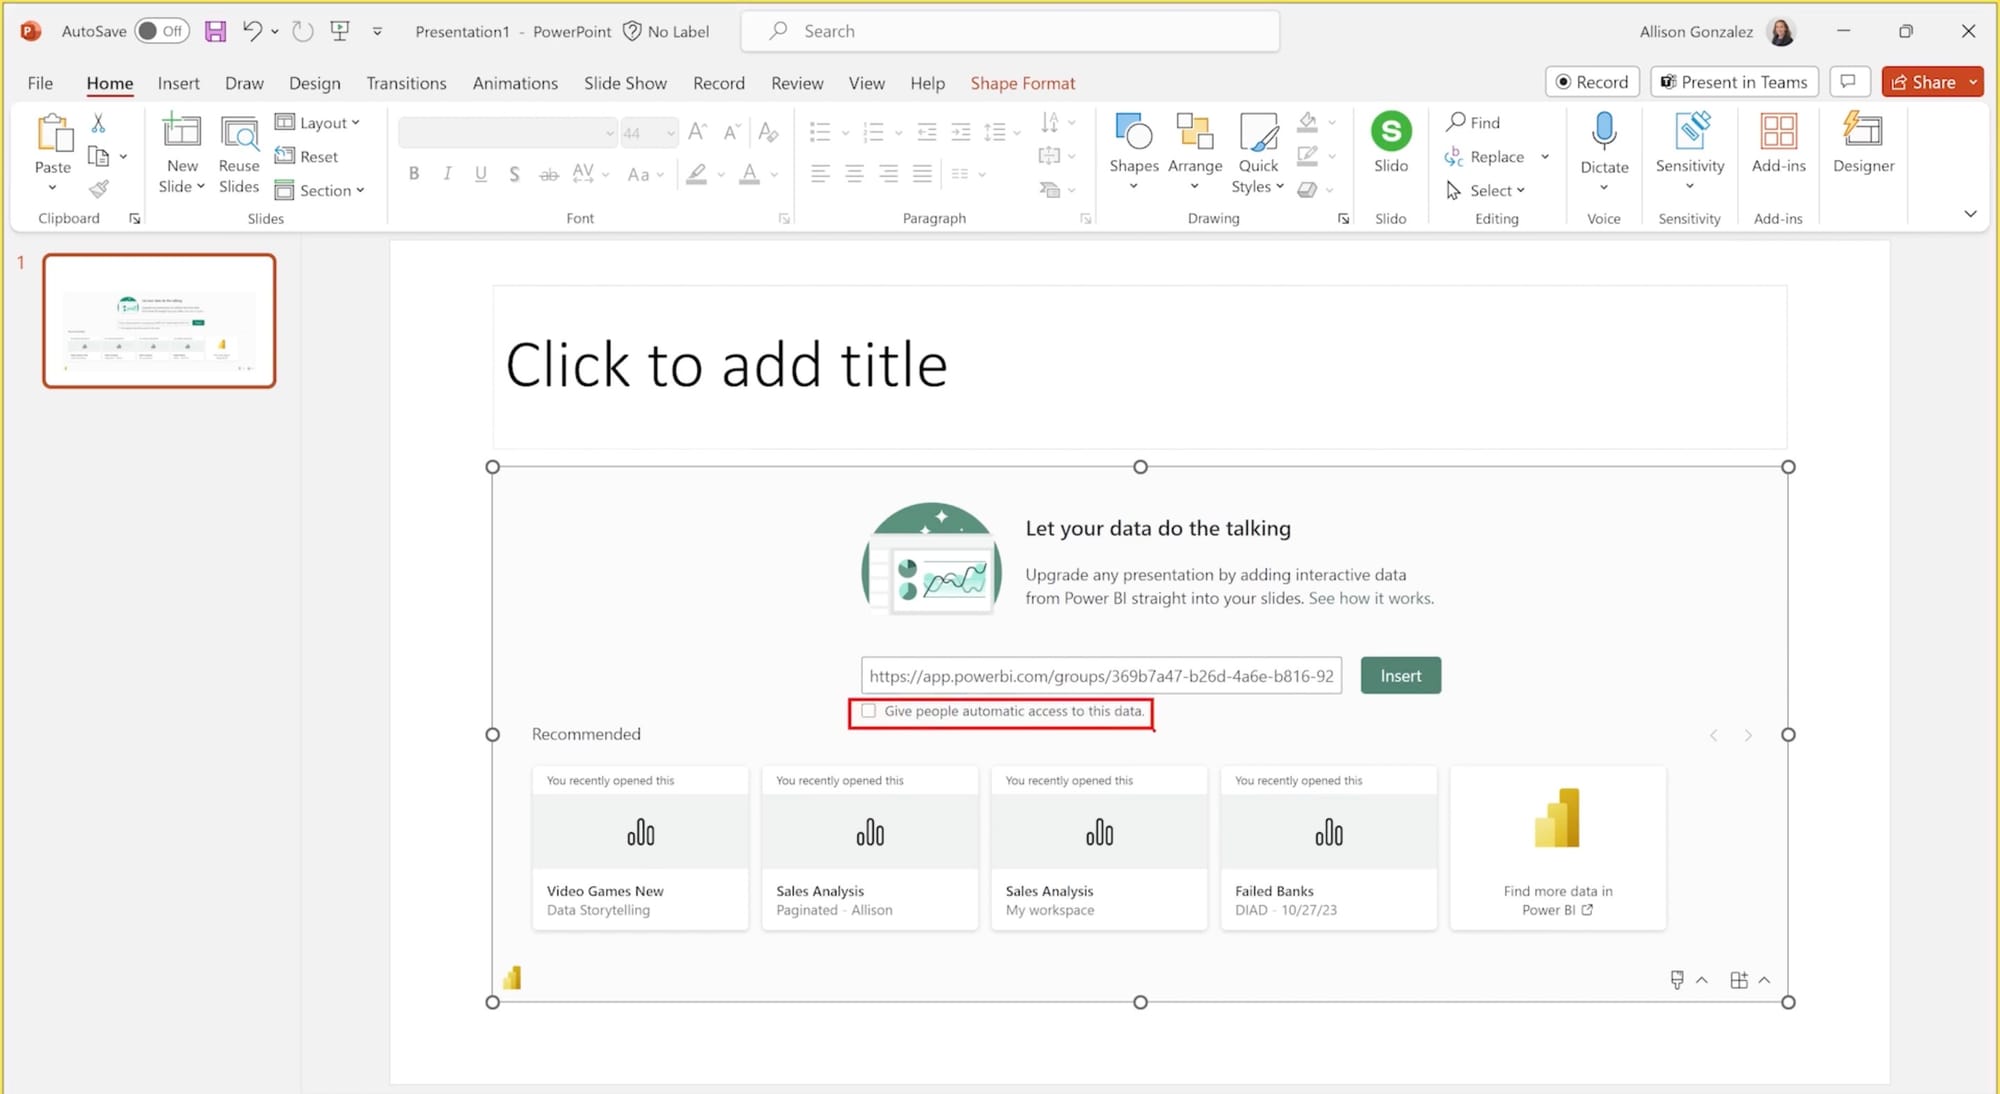
When the the add-in loads, it will show:
- An address bar to input a report URL
- Reports you’ve recently accessed
- Reports that match the slide’s title (if you've entered one)
- Recommended content from Power BI
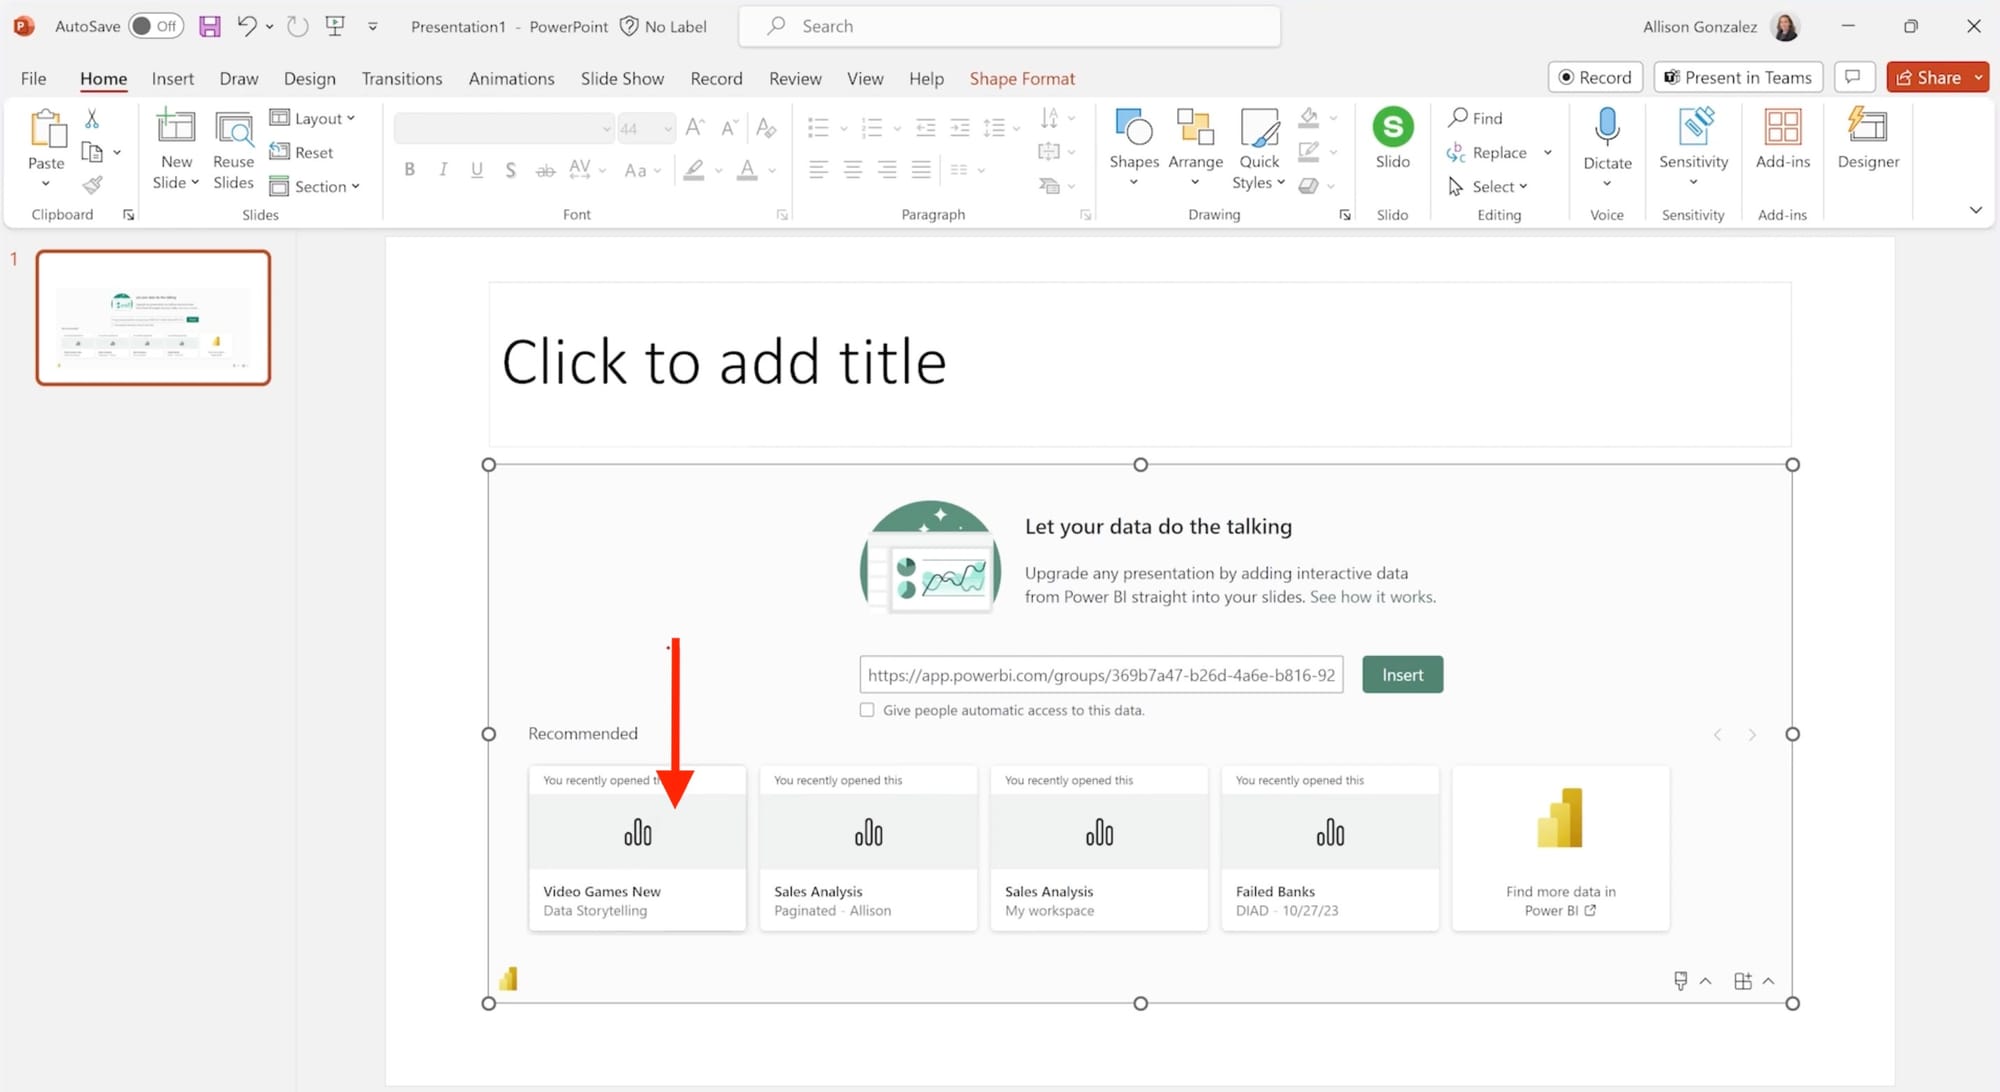
3. Select a report or paste a direct link
You can:
- Select a full report page or a single visual from the generated "Recommended" list:
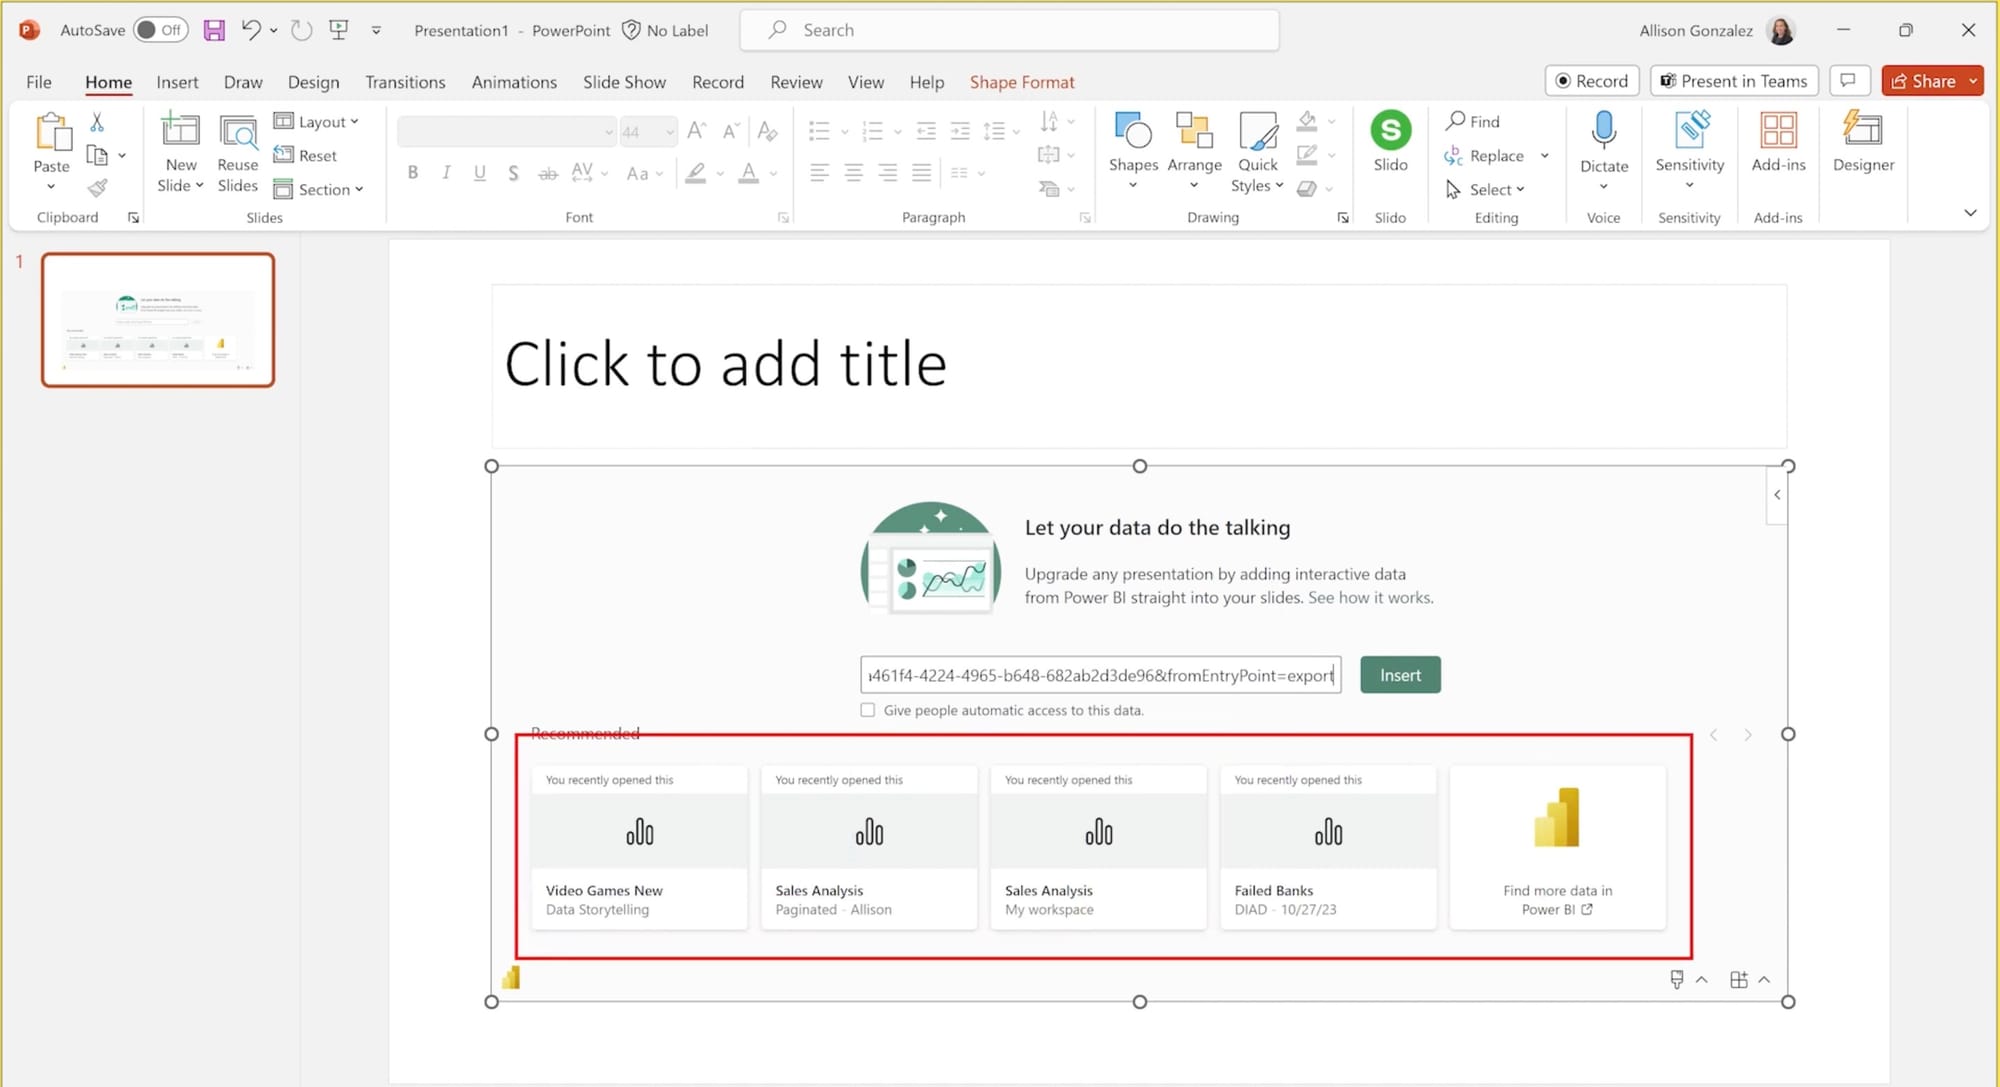
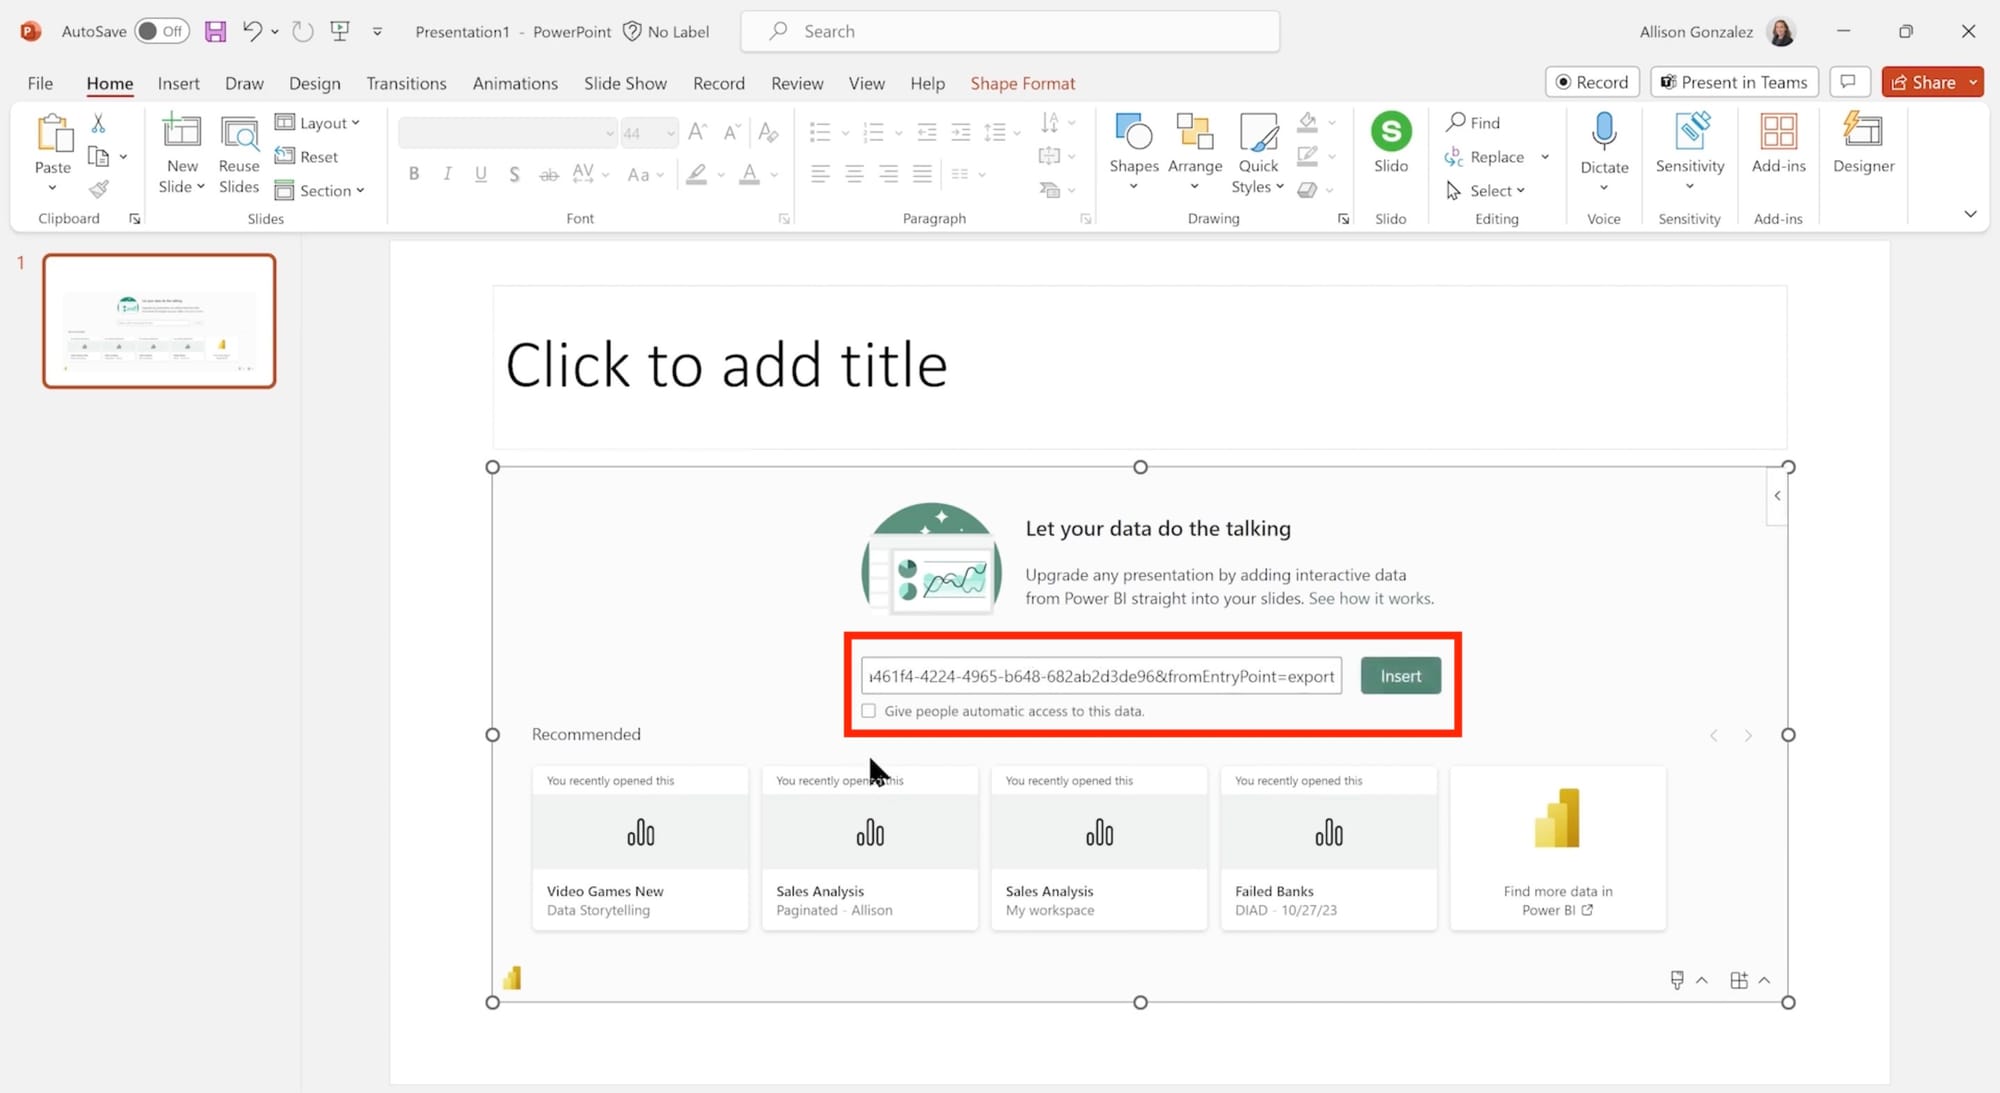
- Paste a direct URL from Power BI if you’ve copied it from:
- The browser address bar
- The Share menu in Power BI
- The visual’s “More options (...)” menu → Link to this visual
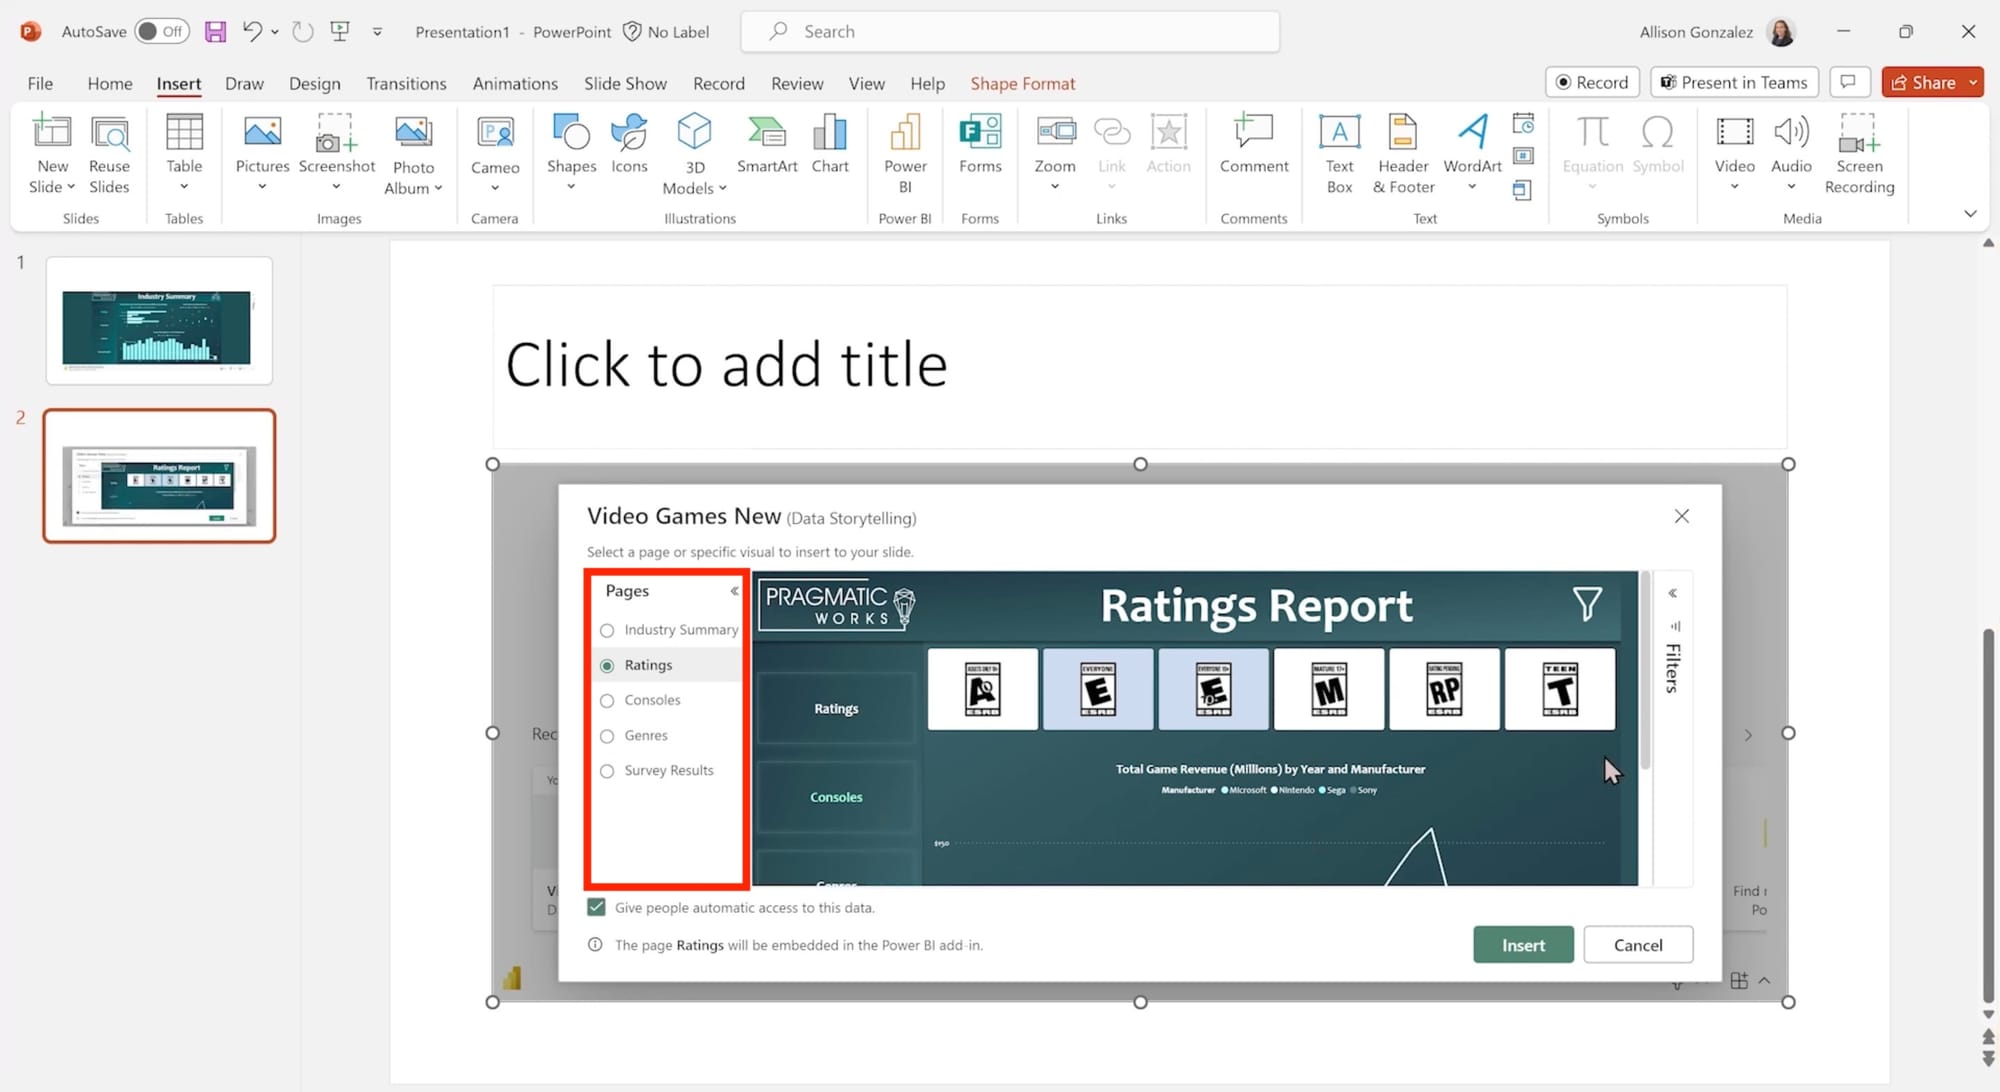
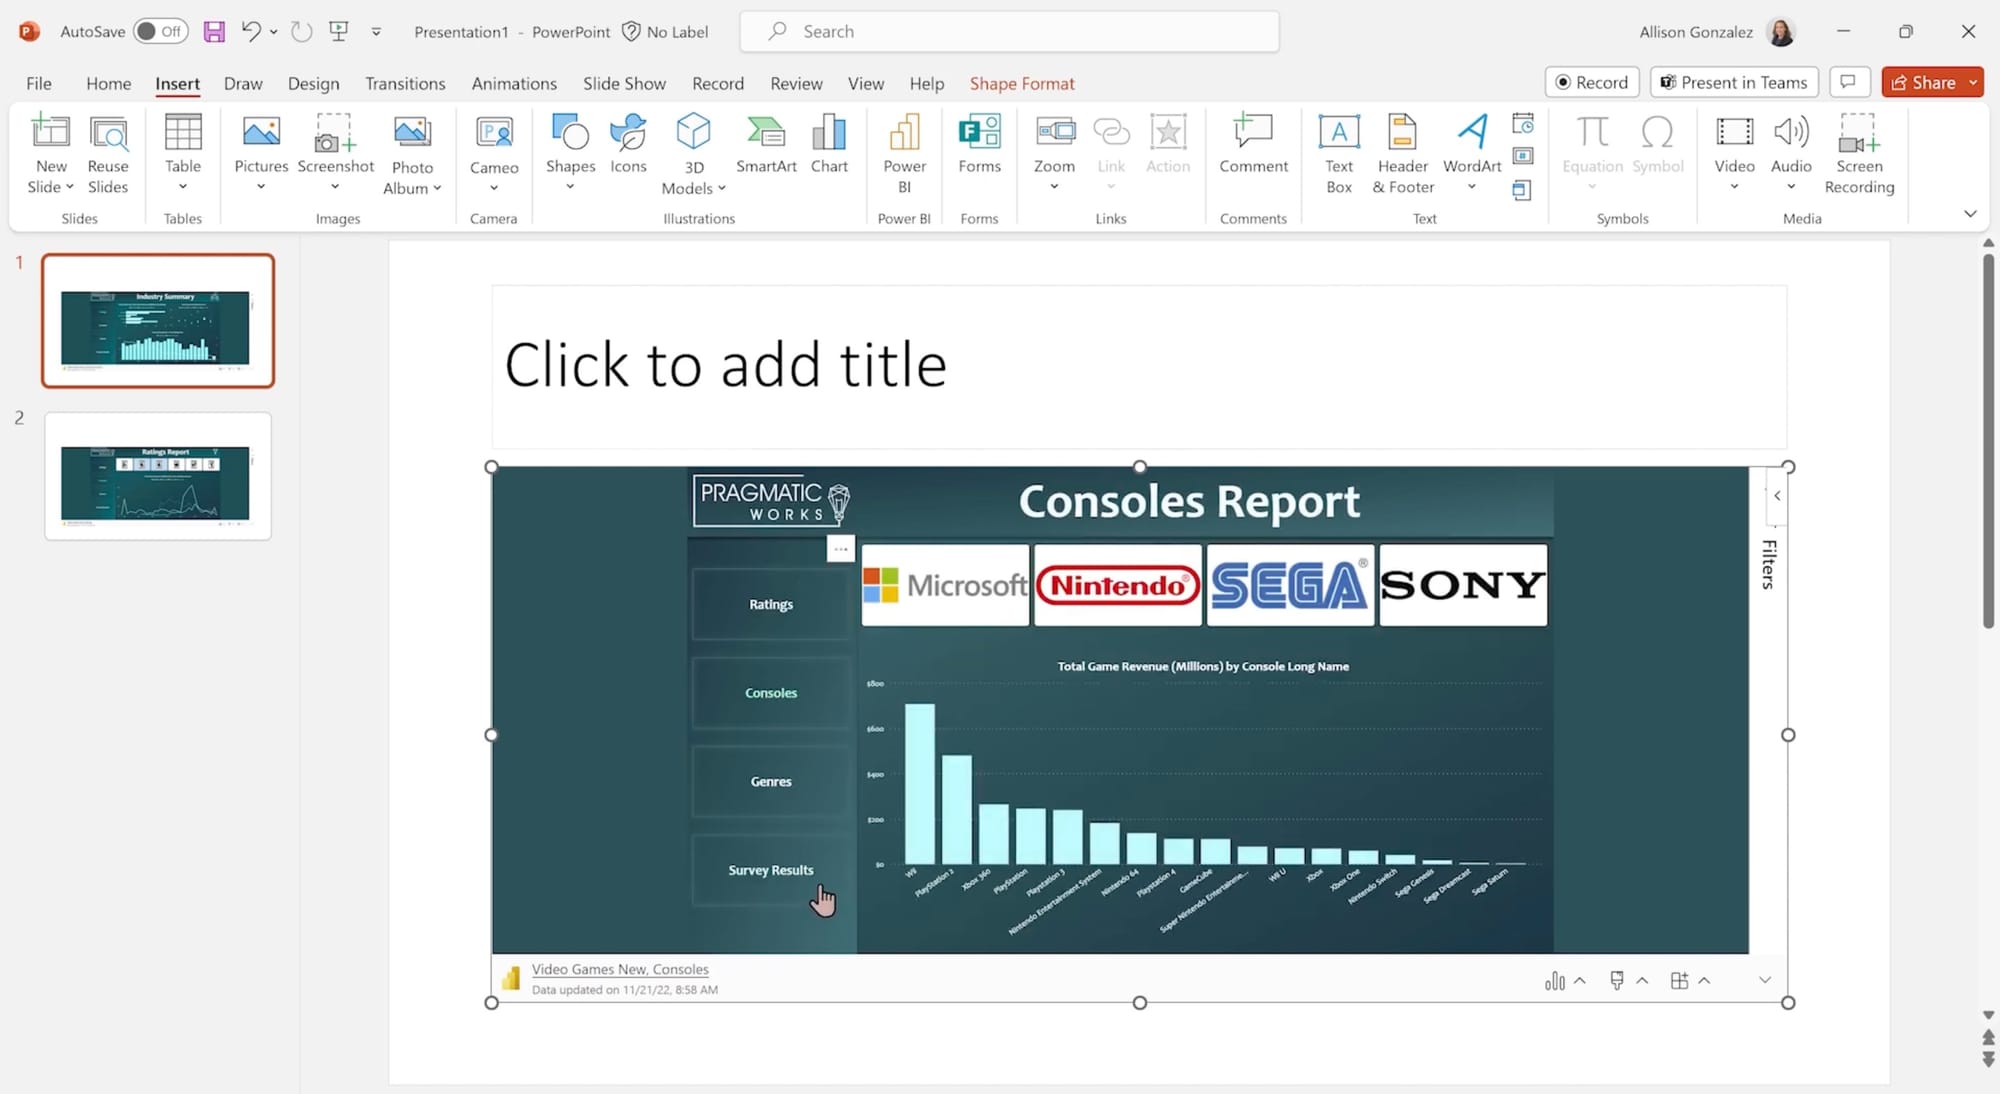
4. Embed the report or visual
When you have the report open on your slide, you can select a specific page or visual to insert. You can also update filters or slicers before you insert it on the page.
5. Format and position the embed
With the report loaded on your slide, you can:
- Resize, move, and layer the Power BI object like any PowerPoint shape.
- Combine with images, charts, audio, titles, animations, or annotations.
Note that your embedded report is completely interactive - filtering works, links and bookmarks work, navigation between pages works... You have a fully live report in your hands.
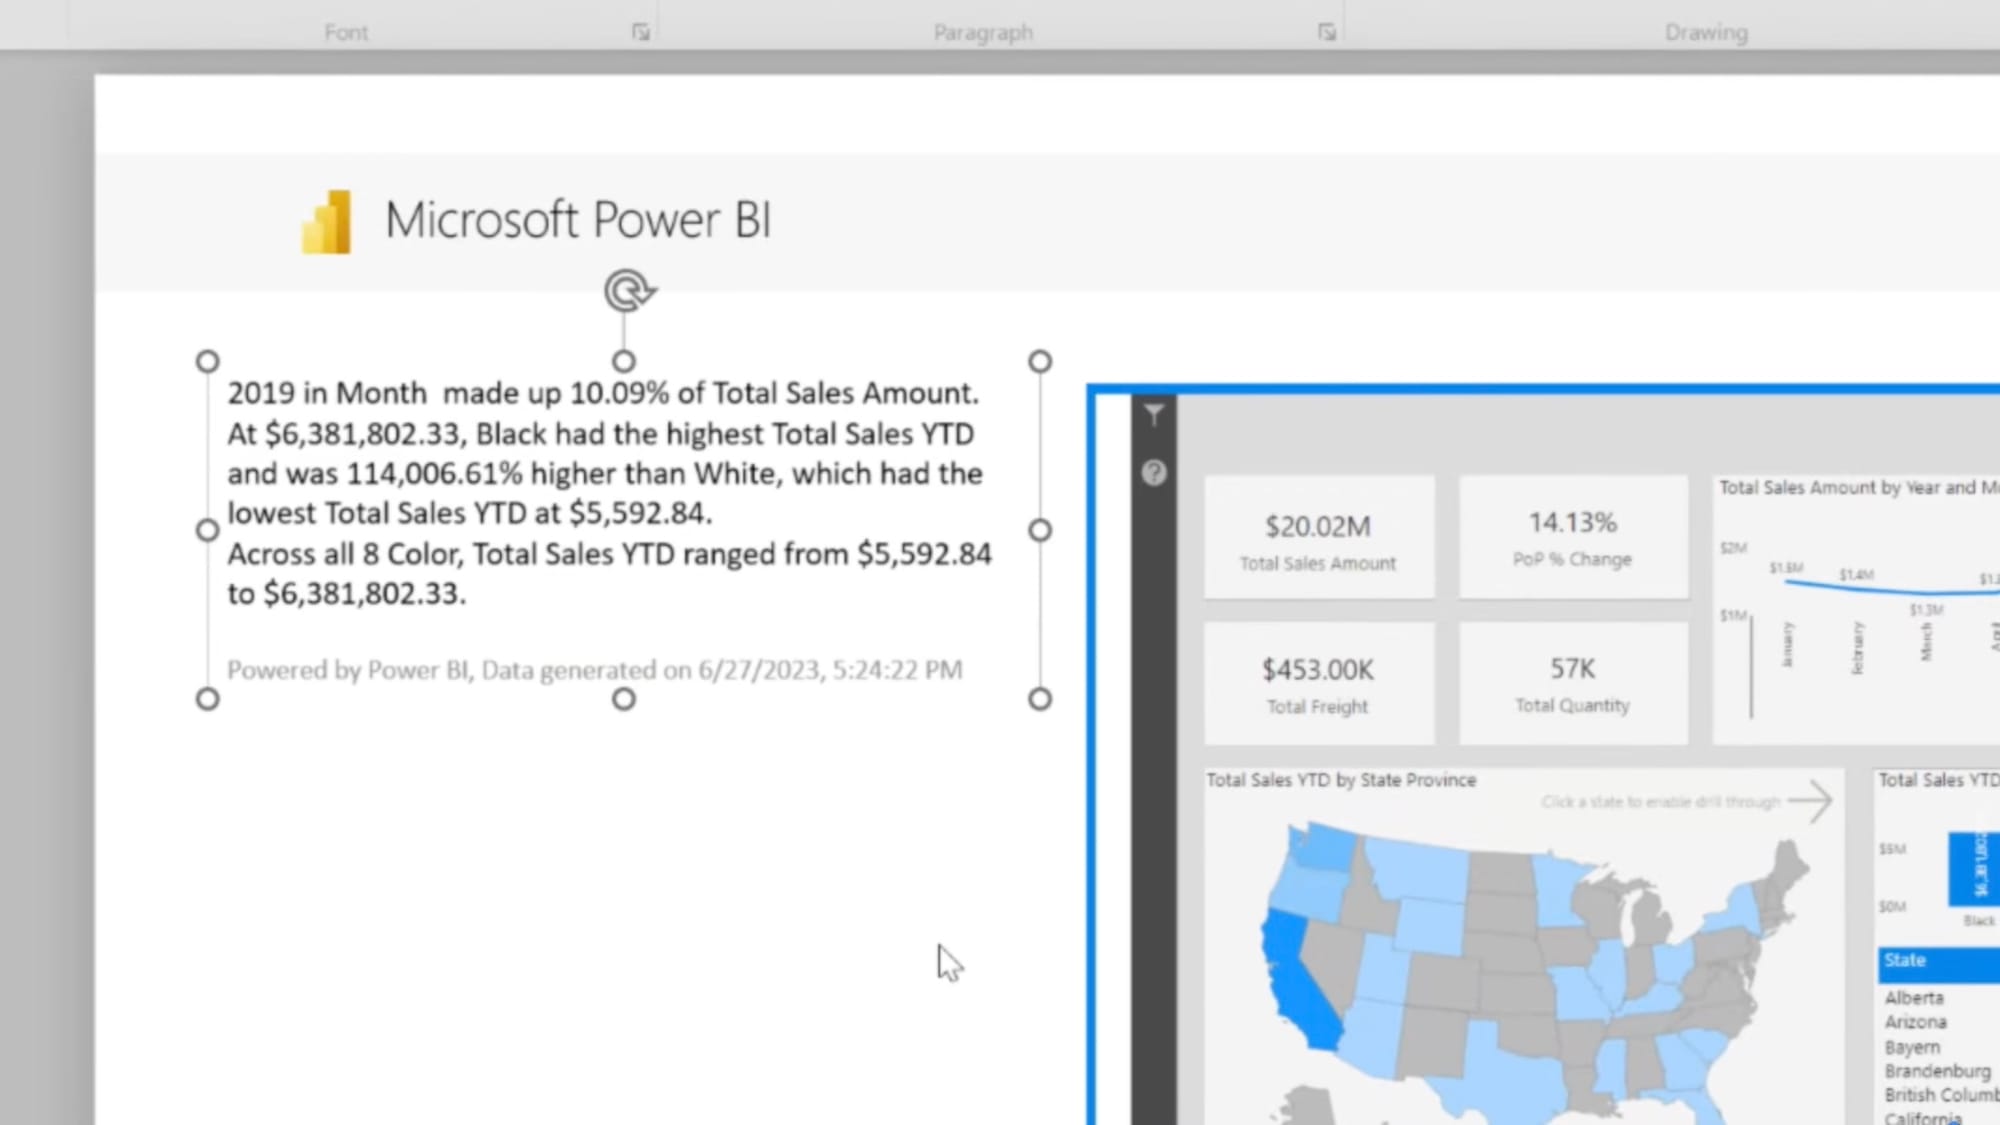
💡 Tip: You can optionally add smart narratives generated by Power BI for summary insights:
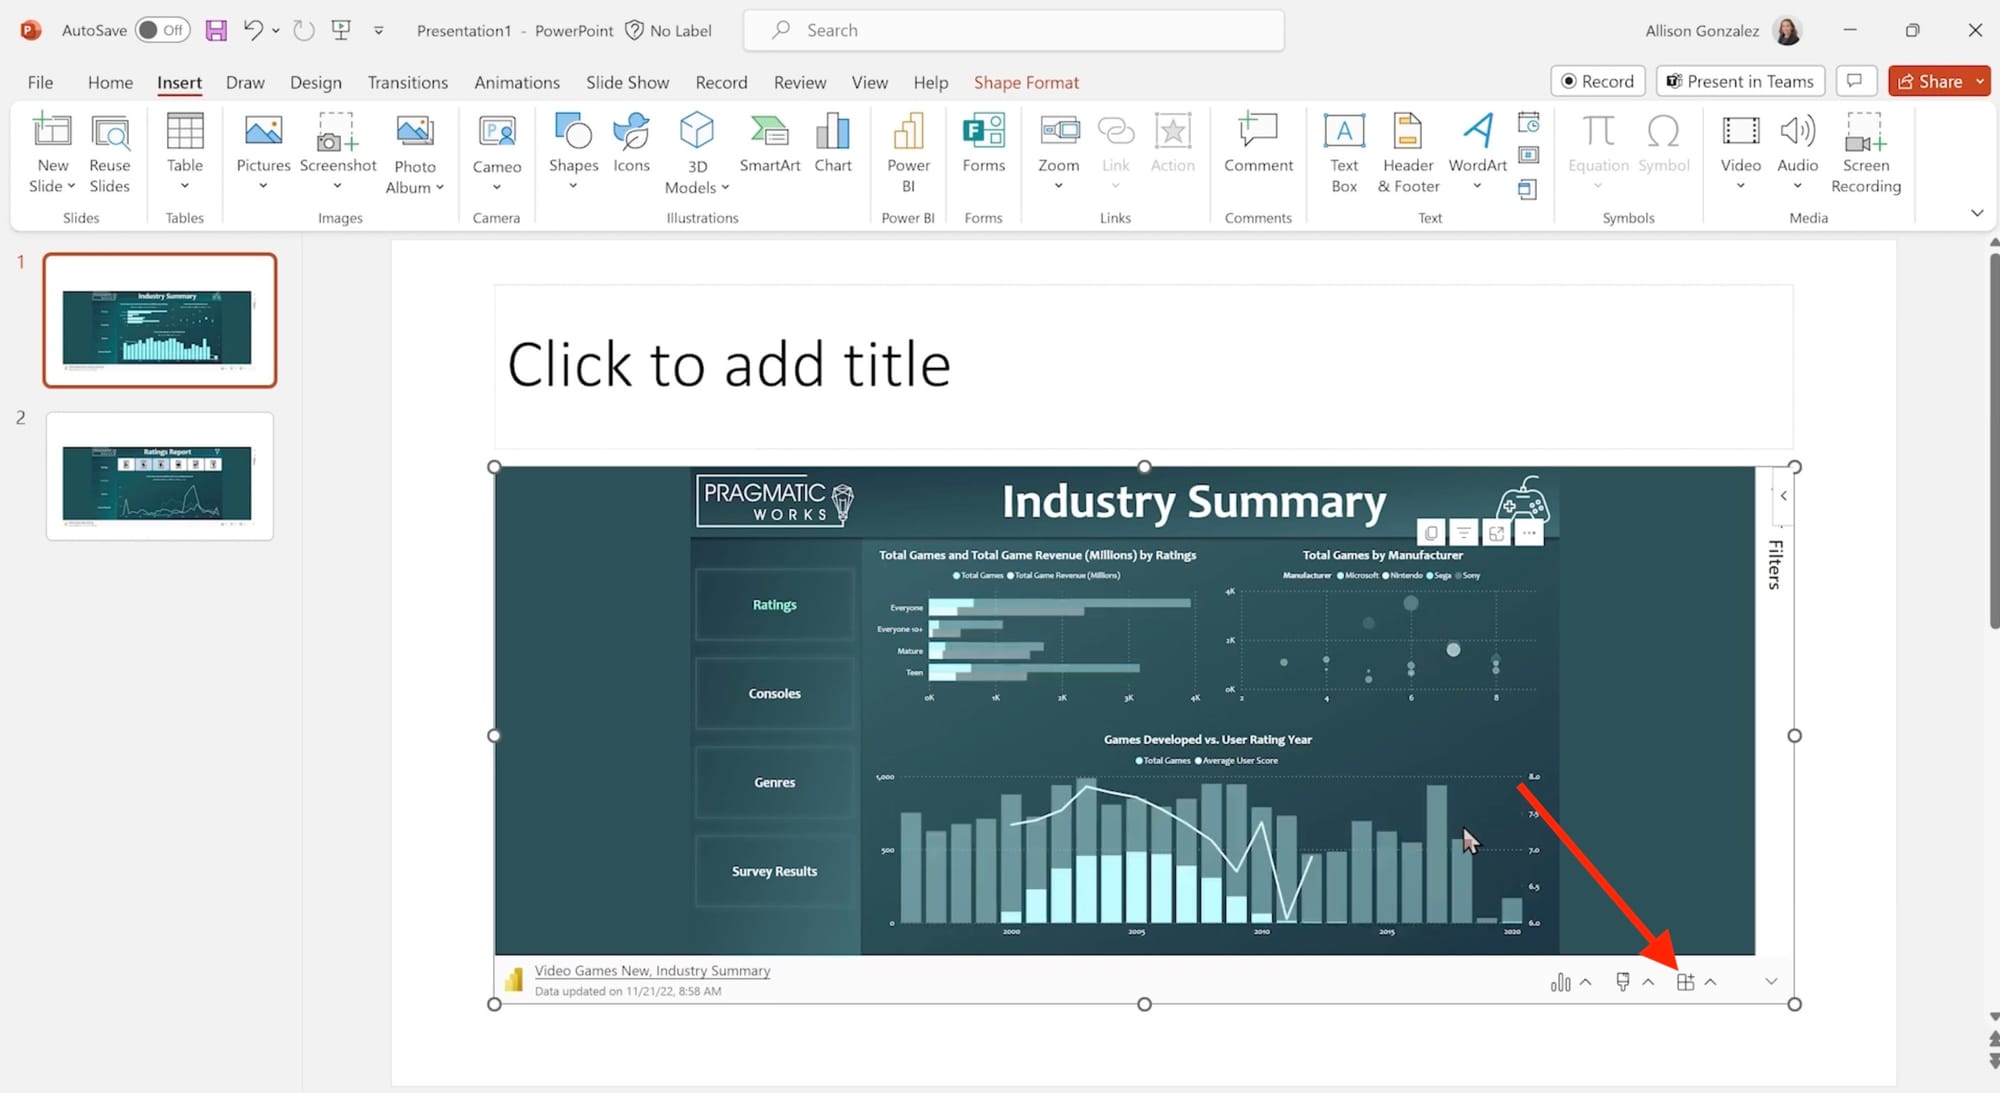
6. Set up auto-refresh (optional)
On the embedded report or visual click the Add in options icon:
Under Slide show settings, tick the box for Automatic refresh in slide show:
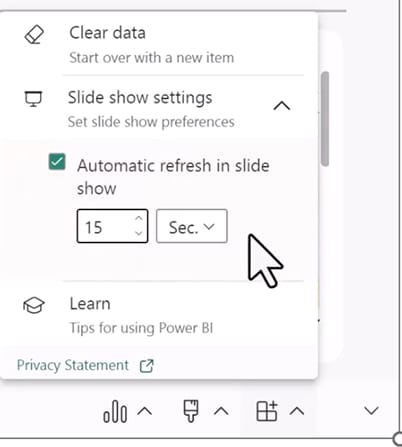
Set a refresh interval during slideshow playback. 15 seconds is the minimum.
This allows your dashboards to loop and stay up-to-date in passive display mode.
Note: The “auto-refresh” option in PowerPoint controls how often the visual re-renders - not how often the underlying data updates in Power BI.
To ensure your embedded reports reflect the latest data, you’ll also need to configure the refresh settings of the Power BI report itself (e.g. scheduled refresh or DirectQuery/live connection).
Without this, the visual may refresh on-screen, but the data it displays could still be out of date. For teams tracking live KPIs or operational metrics, it’s important to align both refresh layers.
Access Analytic covers the auto-refresh feature in more depth here
Option 2: Start from Power BI and export to PowerPoint
You can also initiate the workflow from Power BI itself:
1. Go to your Power BI report or visual
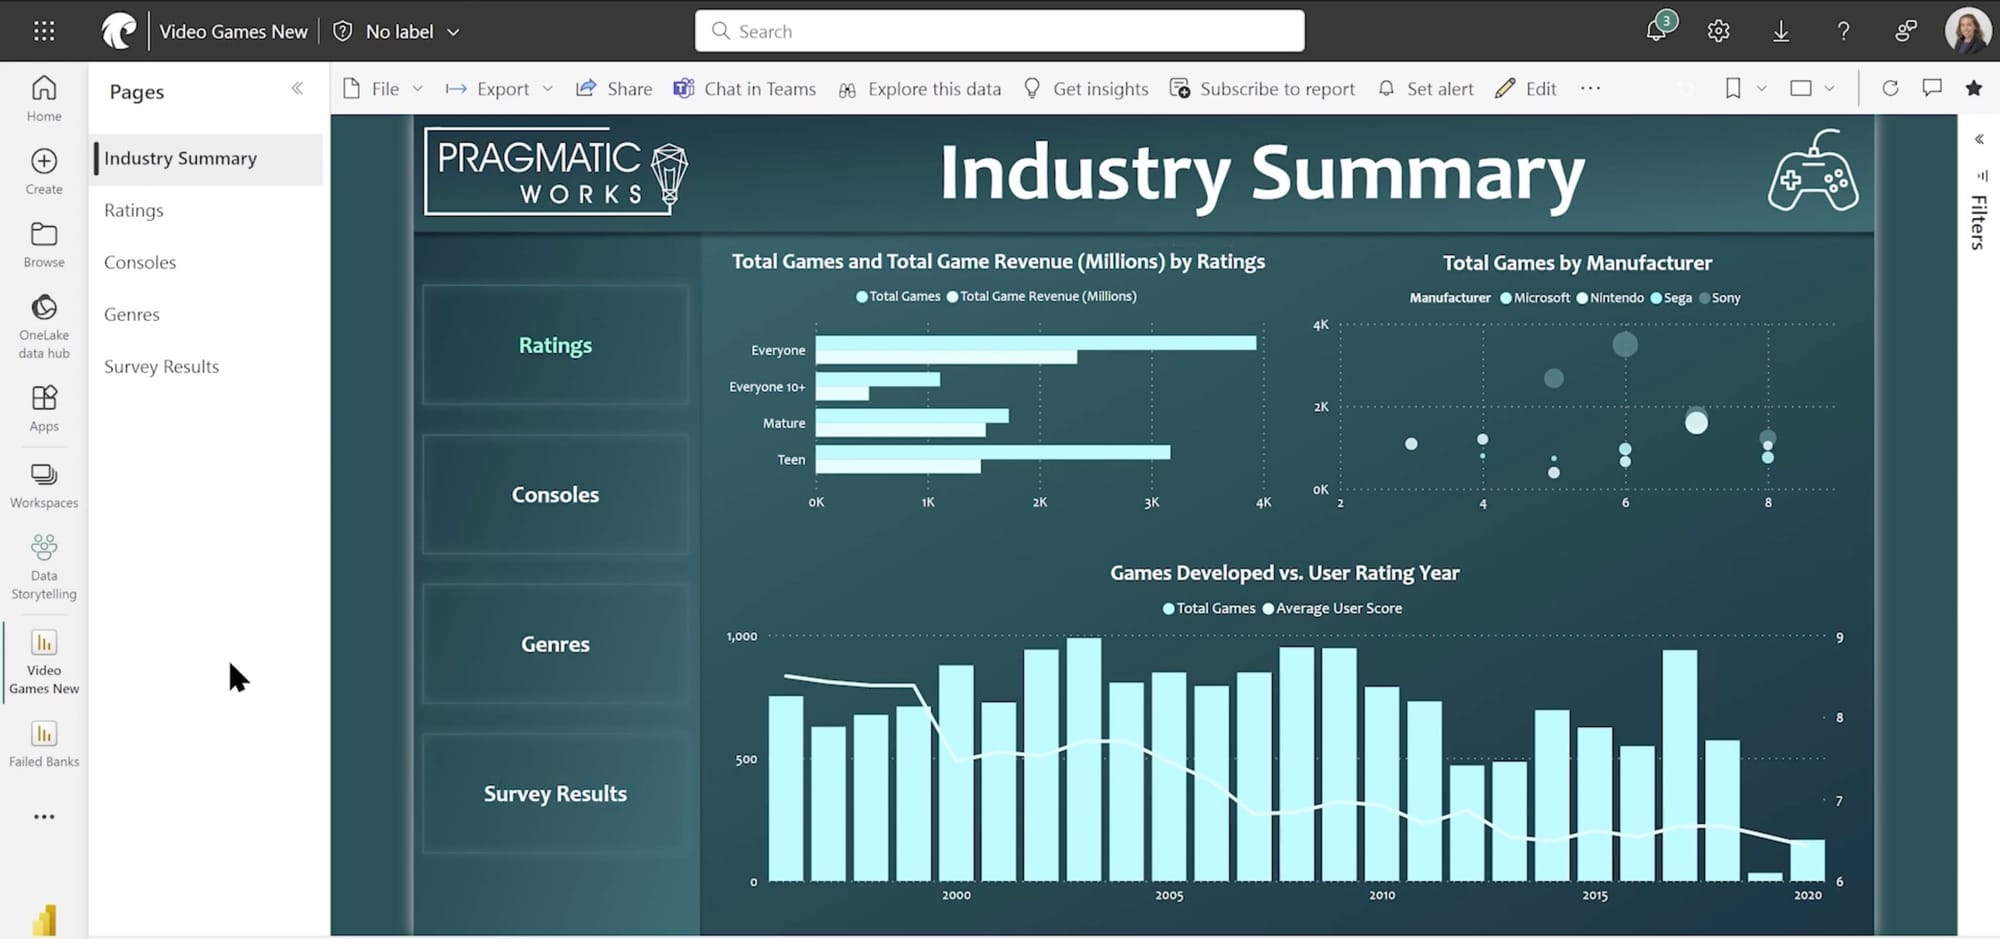
Apply any filters or slicers you want preserved.
2. Click Share or Export
In your report, click Export → PowerPoint
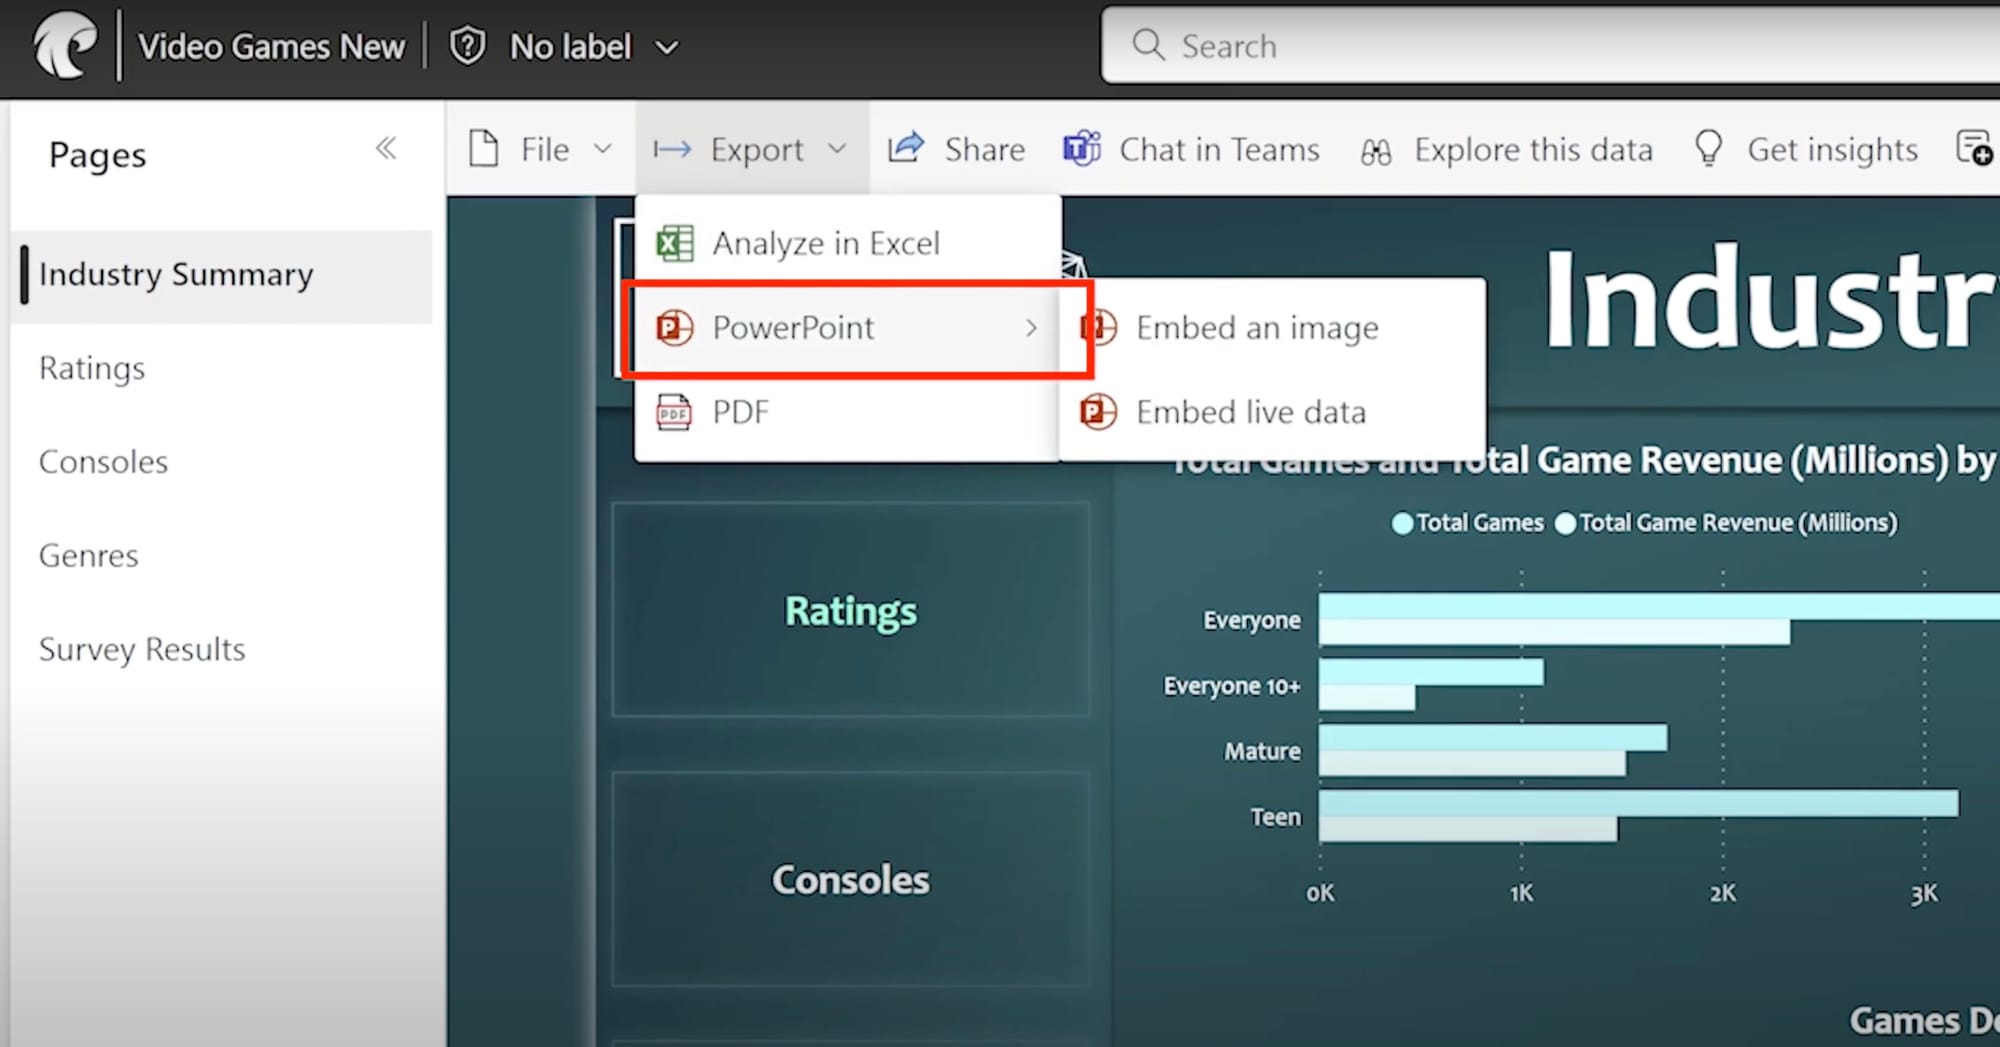
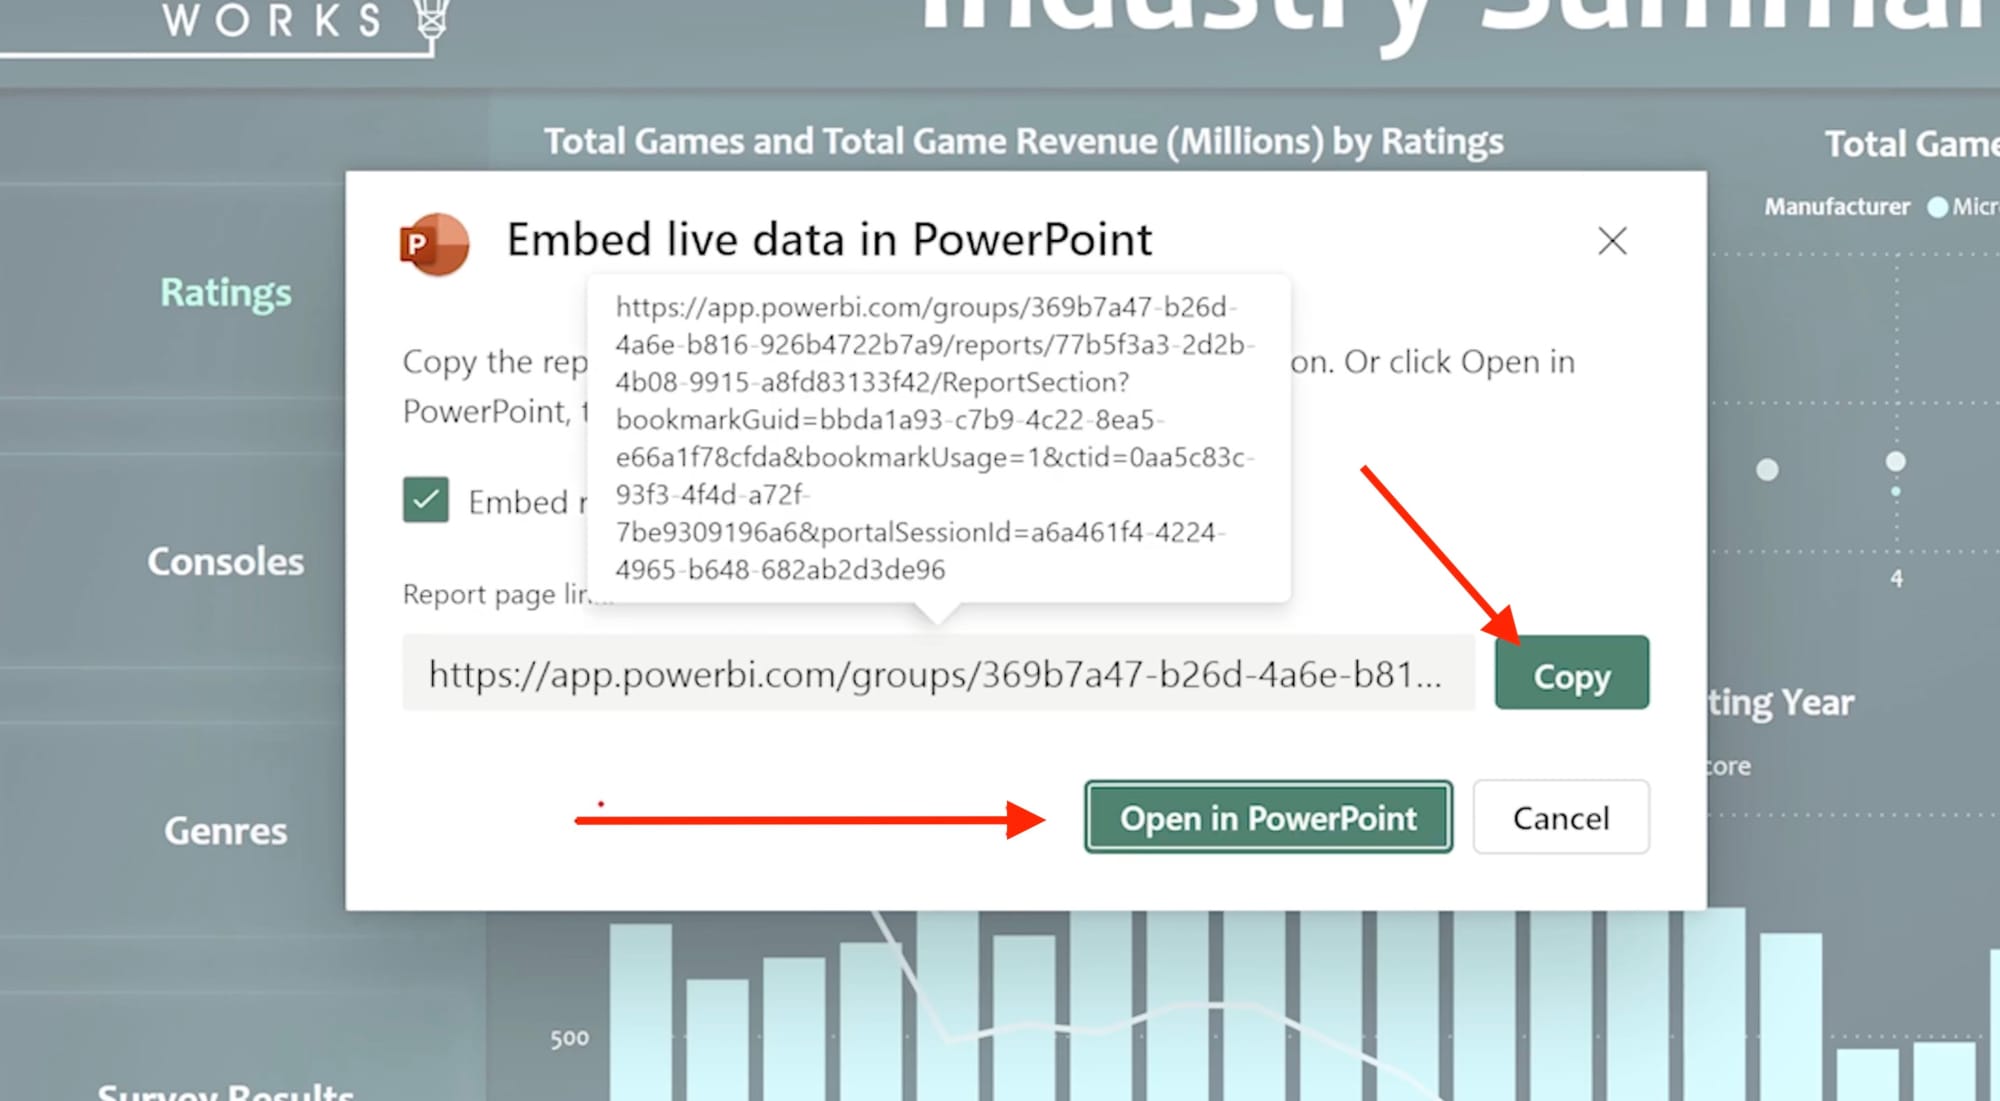
You'll have options to embed an image or the live data. To retain interactivity and fresh data, we recommend you choose Embed live data.
In the popup, you can either choose Open in PowerPoint or copy the link to paste directly into the Power BI add-in in PowerPoint.
3. Configure your slide/s with
If you chose Open in PowerPoint, PowerPoint will launch with the report already embedded via the Power BI add-in.
If you copied the report link, you'll need to follow the steps in sections 2-4 above.
From there, you can format the slide or continue adding content.
Share your presentation on a TV screen
Once your report is embedded and positioned the way you want in PowerPoint, it’s time to get it on a TV screen. Here’s what that typically involves:
A. Physical or wireless connection
Most teams use one of the following methods to connect their laptop to the TV or wall-mounted screen:
- HDMI cable: The most stable and widely supported option. Plug one end into your laptop, the other into the screen.
- USB-C to HDMI adapter: If your laptop only has USB-C ports, you’ll need an adapter.
- Wireless casting (e.g. Miracast, Chromecast, Apple AirPlay): Convenient, but prone to connection drops and network limitations.
B. Extend or mirror your display
Use your laptop's display settings to choose how the screen behaves:
- Duplicate if you want the same view on your laptop and TV
- Extend if you want to control the presentation from your laptop while displaying it full-screen on the TV
C. Start the slideshow
Switch to presentation mode in PowerPoint to render the slides full-screen. It should be interactive and reflect your chosen filters or slicers.
D. Avoiding interruptions
To keep the dashboard running uninterrupted:
- Disable sleep settings on your laptop (both screen and system sleep)
- Plug the laptop into power - running off battery may trigger power-saving features
- Keep PowerPoint in focus - switching apps or minimizing it can stop the slideshow
- Use presentation remotes sparingly - some can interfere with slideshow state
That setup works fine when someone’s in the room: running a meeting, walking through a report, clicking through filters in real time.
But if the goal is to keep a Power BI dashboard visible on a screen throughout the day without needing to babysit it - you’re going to hit some limits.
So what’s the alternative?
Let’s look at how a digital signage platform can handle this differently.
We’ll use Fugo to walk through the setup - but some tools in this space follow a similar structure, with variation in how deeply they integrate with Power BI.
How to display your Power BI reports & dashboards with digital signage software
Once you’ve outgrown the PowerPoint method - or need something more reliable for unattended screens - Fugo gives you a dedicated Power BI app built for display environments.
Watch the video how-to or keep reading 👇
Here’s how to get it running:
1. Add your screen to Fugo
To remotely push & update content on a TV screen using Fugo, you’ll need to install the Fugo player app onto your screen - this acts as the bridge between your screen and the CMS (content management system).
If your smart TV runs Android and has access to the Google Play Store, you can install Fugo directly — just like you’d install Netflix.

If your screen doesn’t natively support Android, you can connect a media player via HDMI and install Fugo onto that instead.
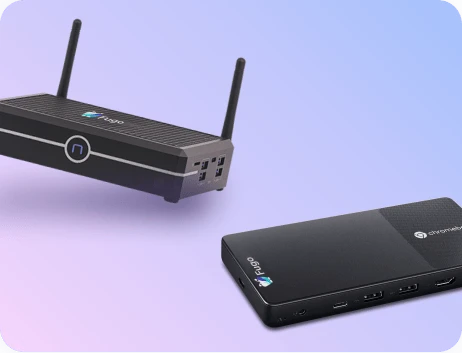
Affordable options include the Chromecast with Google TV, Google TV Streamer, and Raspberry Pi 5 - all of which are commonly used for digital signage and easy to find.
Fugo will run on any Windows or ChromeOS PCs and workstations too. So if your team has a spare NUC or Chromebox , you're already set.
👉 See our supported & recommended devices
Choose one that suits your environment and install the Fugo Player on it.
Once your screen is connected and paired with your Fugo account, you’re ready to configure the Power BI app!
2. Log in and find the Power BI app
Sign up for a Fugo trial (it's free for 14 days) or log in to your Fugo account.
Click Apps in the top navigation bar and find the Power BI app.
Click Try App to begin configuration.
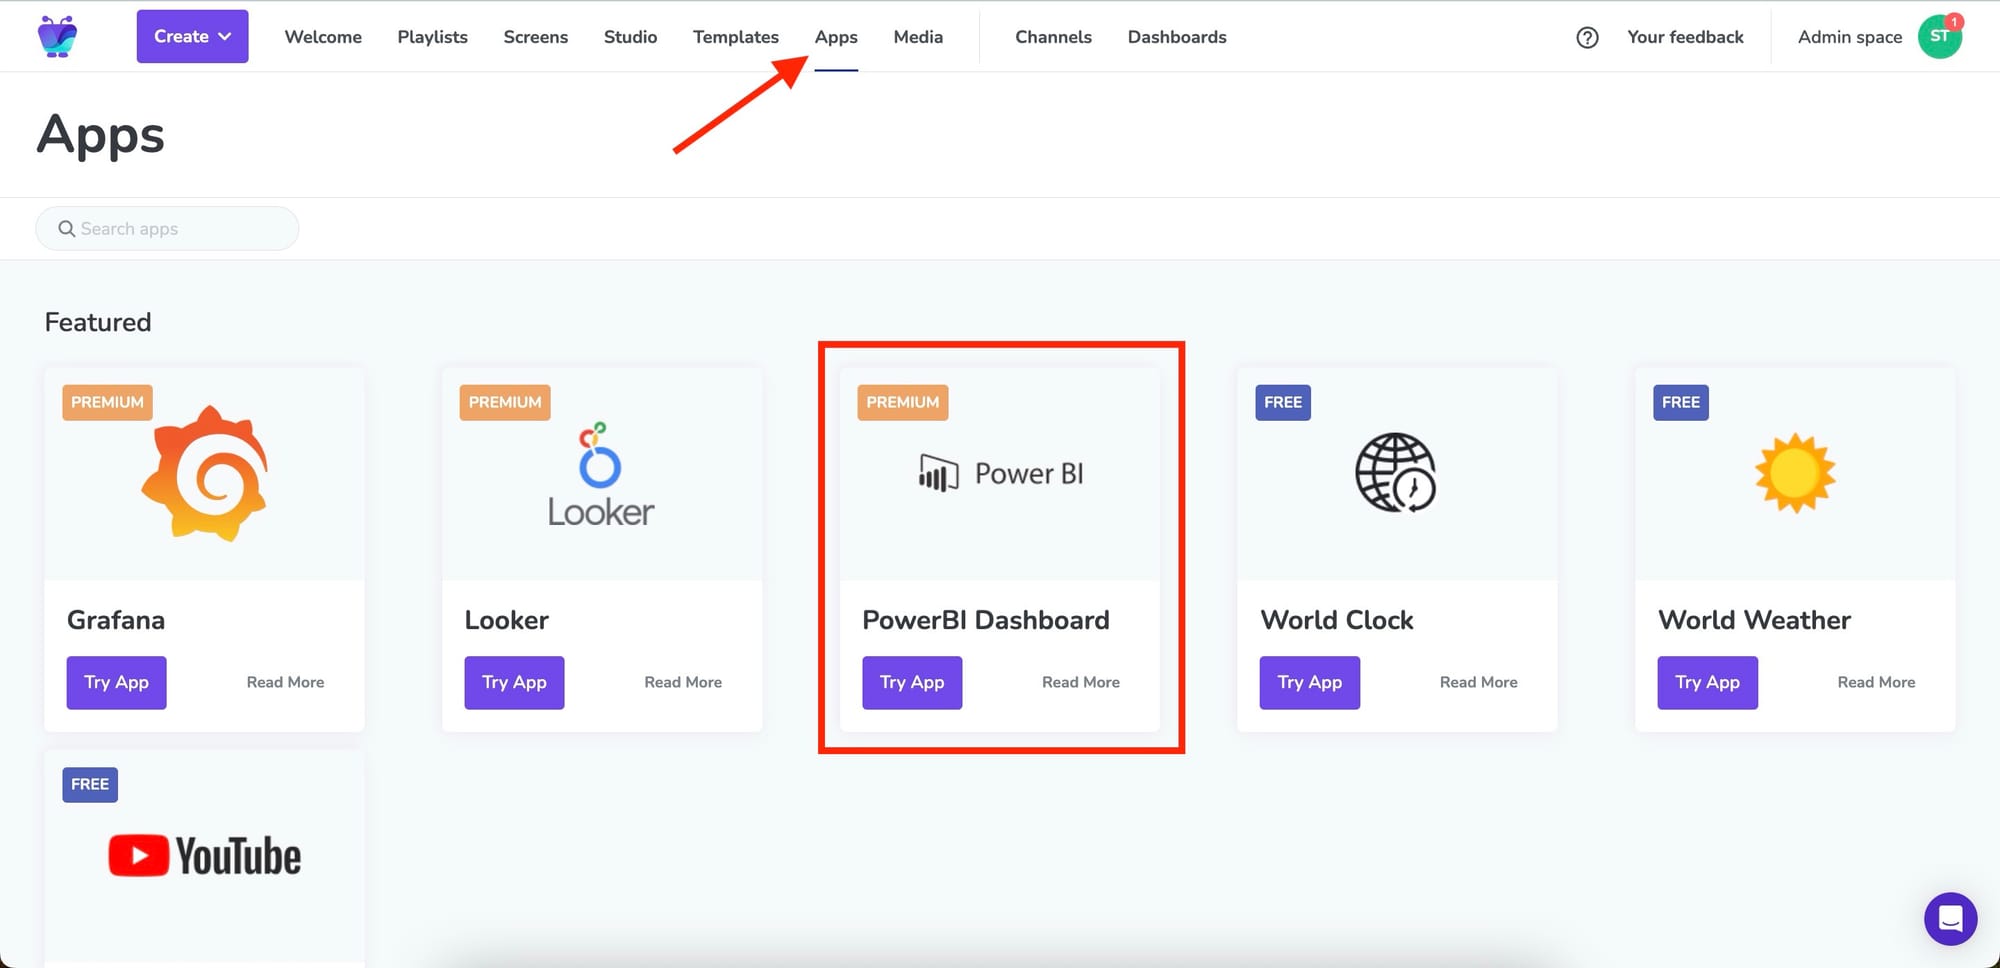
☝️ Note: The Power BI app is available to test on Fugo’s free trial and included in the Core and Enterprise plans once you upgrade. Pricing starts at $30/month per screen.
3. Authorize your Power BI account
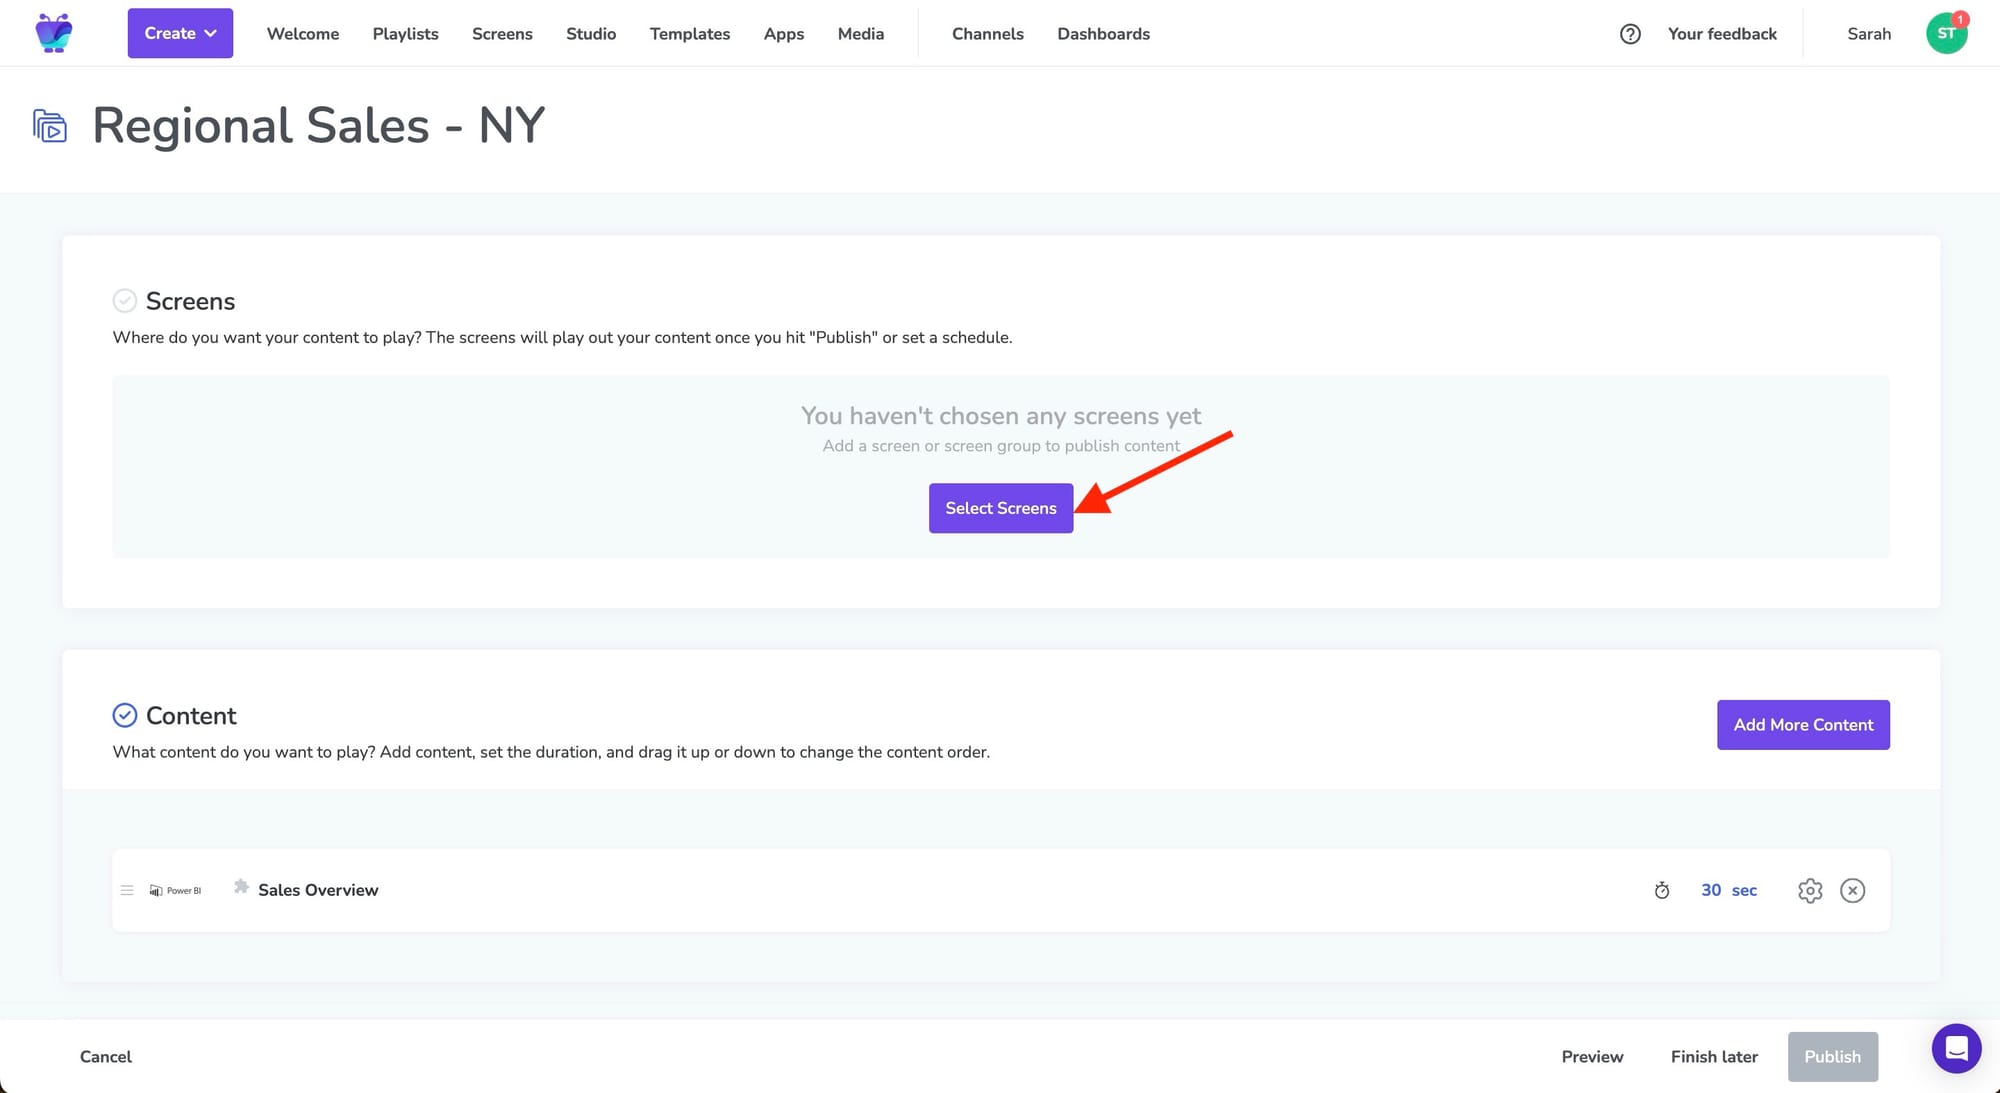
The app will open into Fugo's playlist builder.
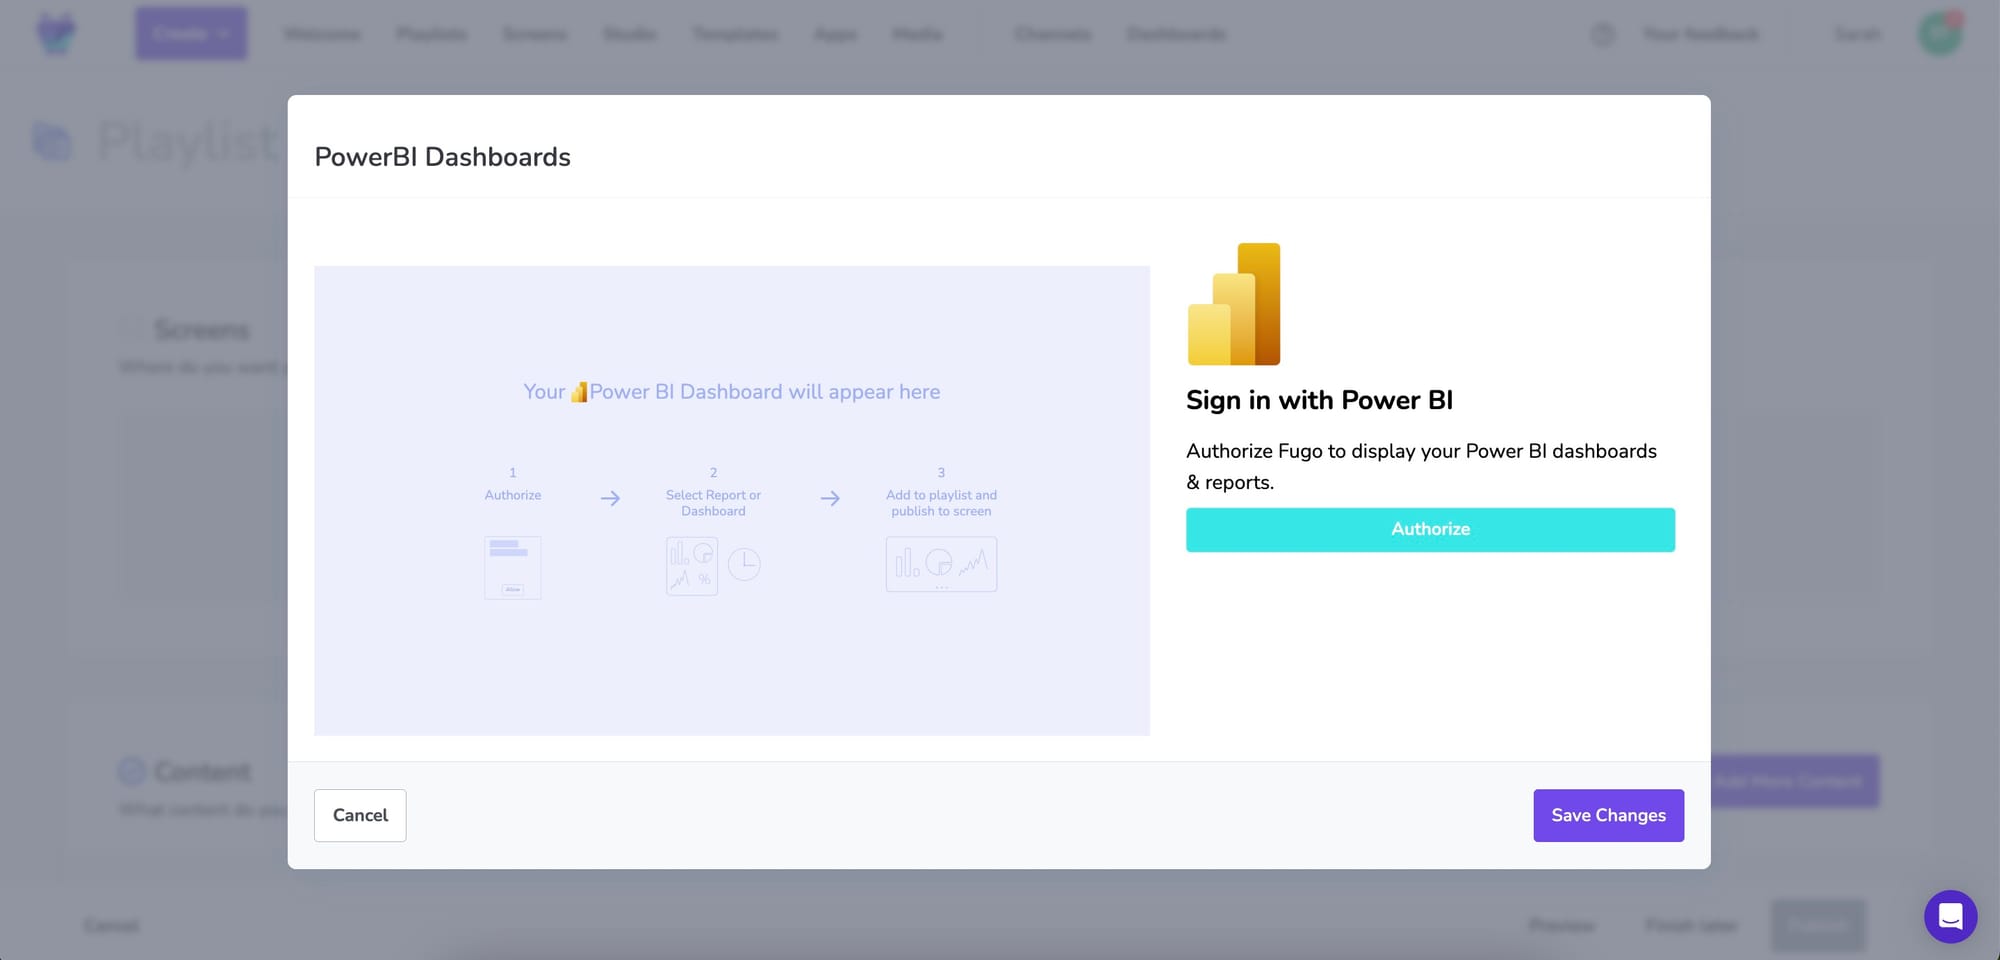
The playlist builder is a simple 3-step builder that allows you to:
- Choose the screen where your content will be displayed
- Choose the content that will be displayed (in this case, the Power BI app will be auto-filled as the content)
- Choose the date & times that the content will be displayed
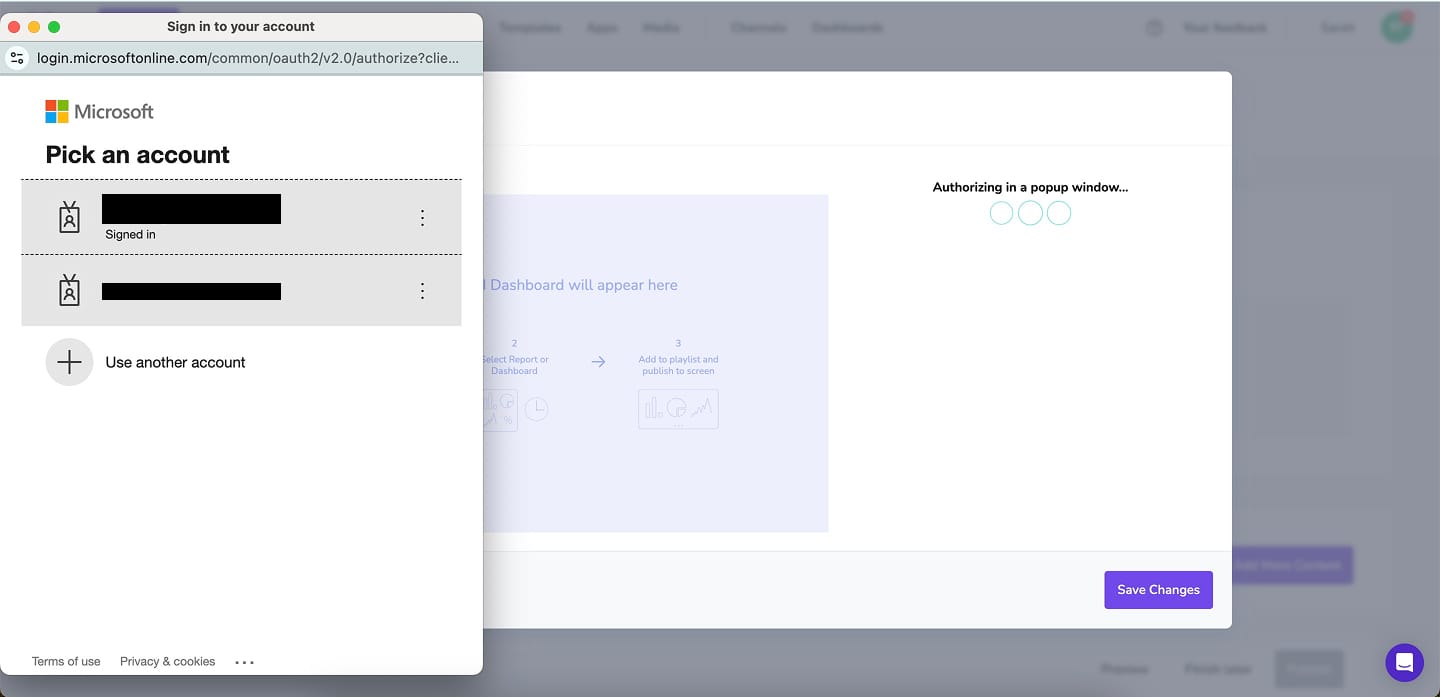
Sign in to authenticate with your Microsoft credentials. This gives Fugo secure, permission-respecting access to your dashboards.
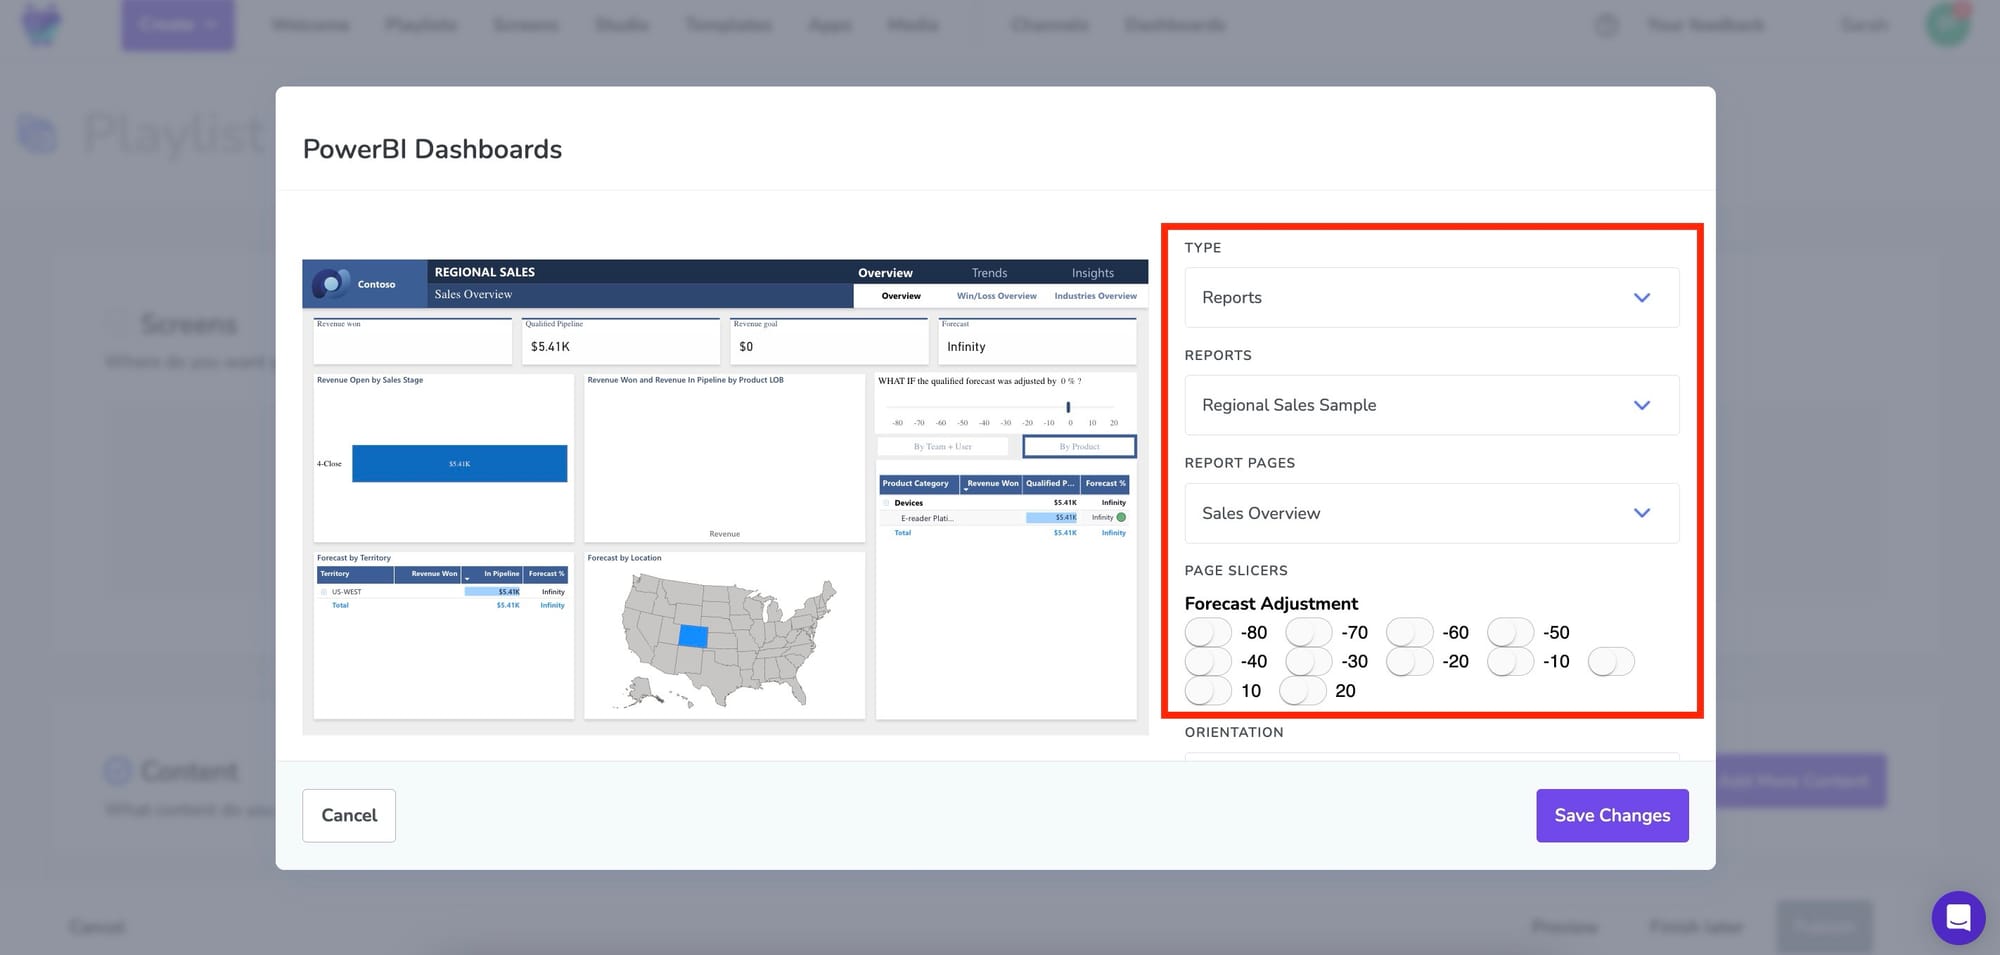
4. Configure the app to show the right dashboard or report
Once you're logged in, you’ll then be able to:
- Browse all accessible reports and dashboards that in your workspace
- Select one to display
- Choose a specific page if your report has multiple
- Set the Slicer (if your report is configured with them) to filter for a specific report page
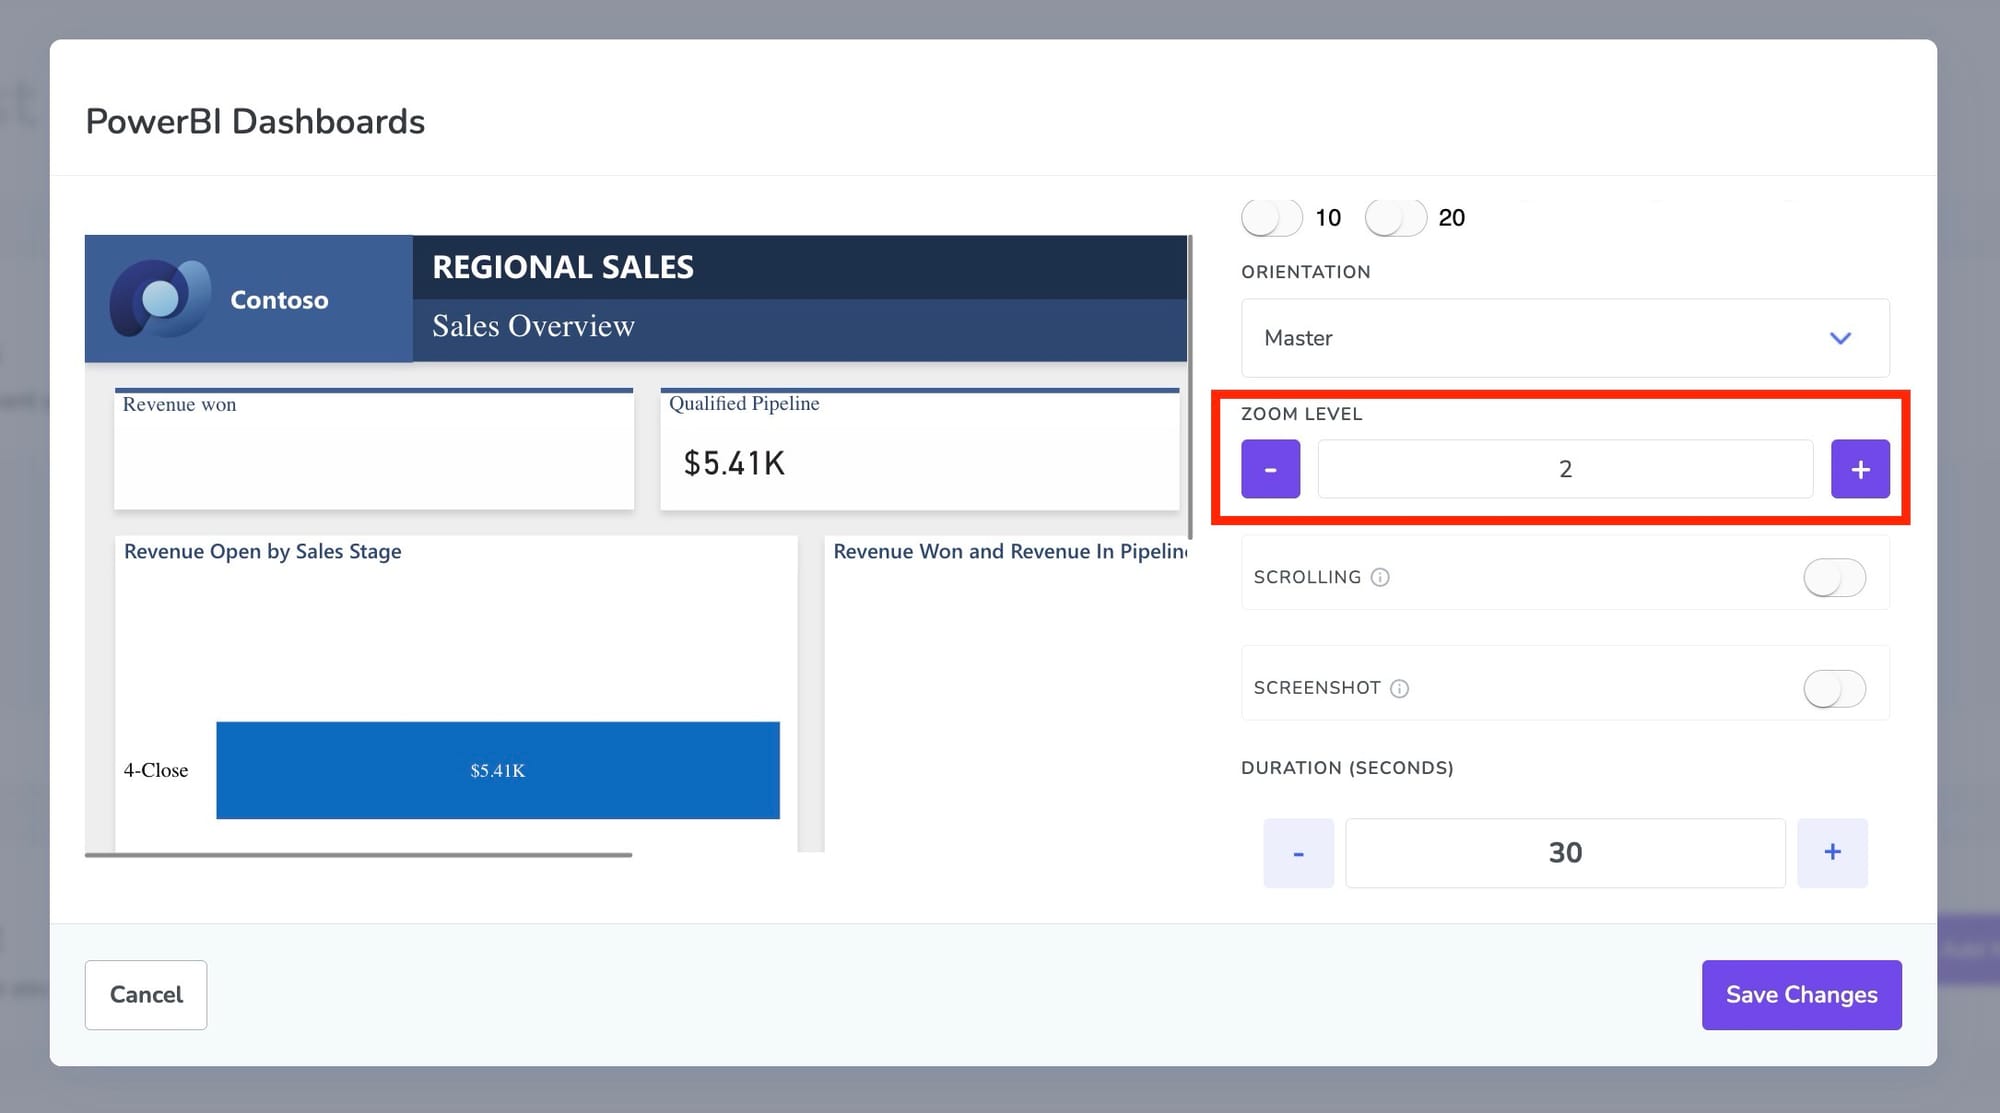
5. Configure scroll, zoom level, and screenshot mode (optional)
There are a few additional helpful settings that you can use:
Zoom level
Have a particular metric you want to eagle-eye in on? Use the Zoom level setting to zoom in on the page.
Scrolling
If you have a particularly long dashboard and you want to designate a certain portion of it to display on screen, you can use the SCROLLING feature to set the pixel dimensions of the part of the dashboard Fugo displays.
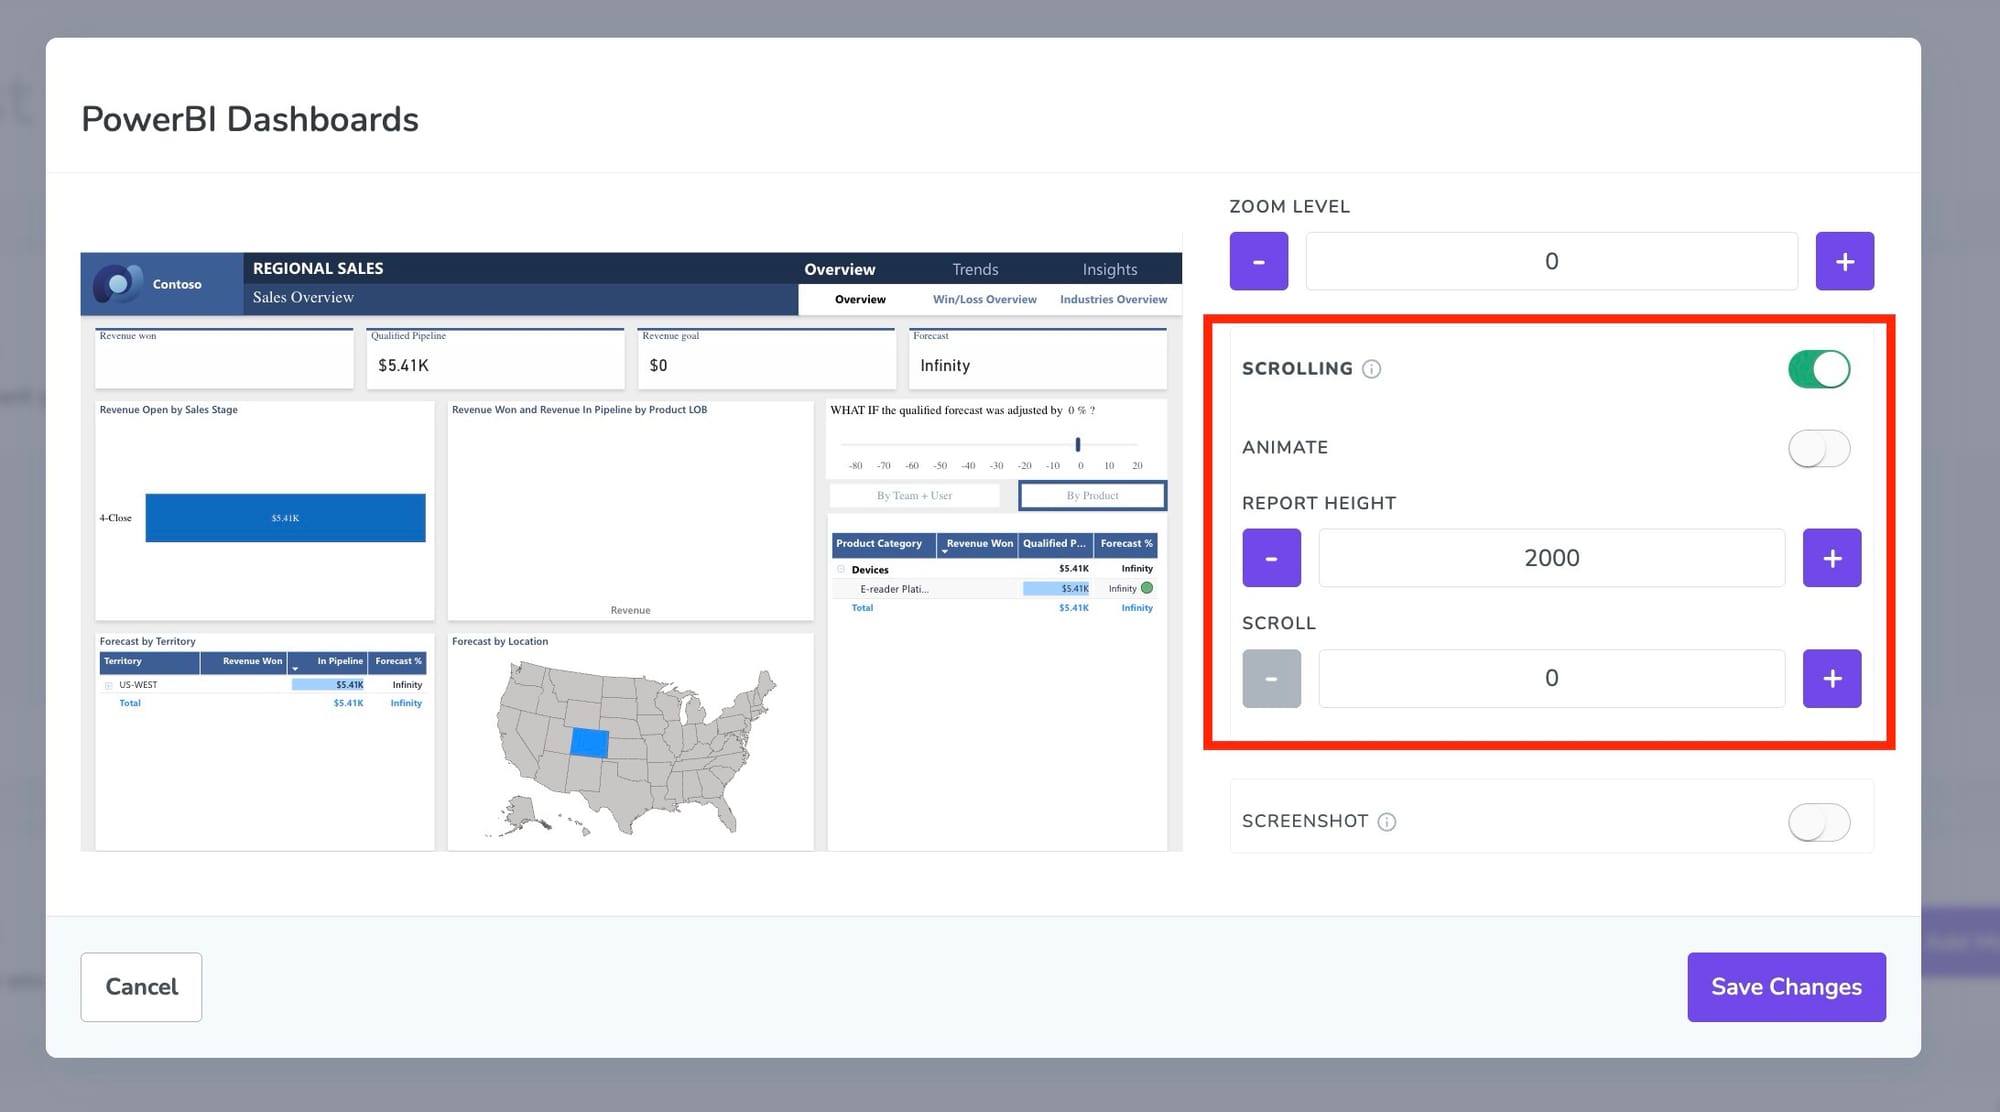
Screenshot
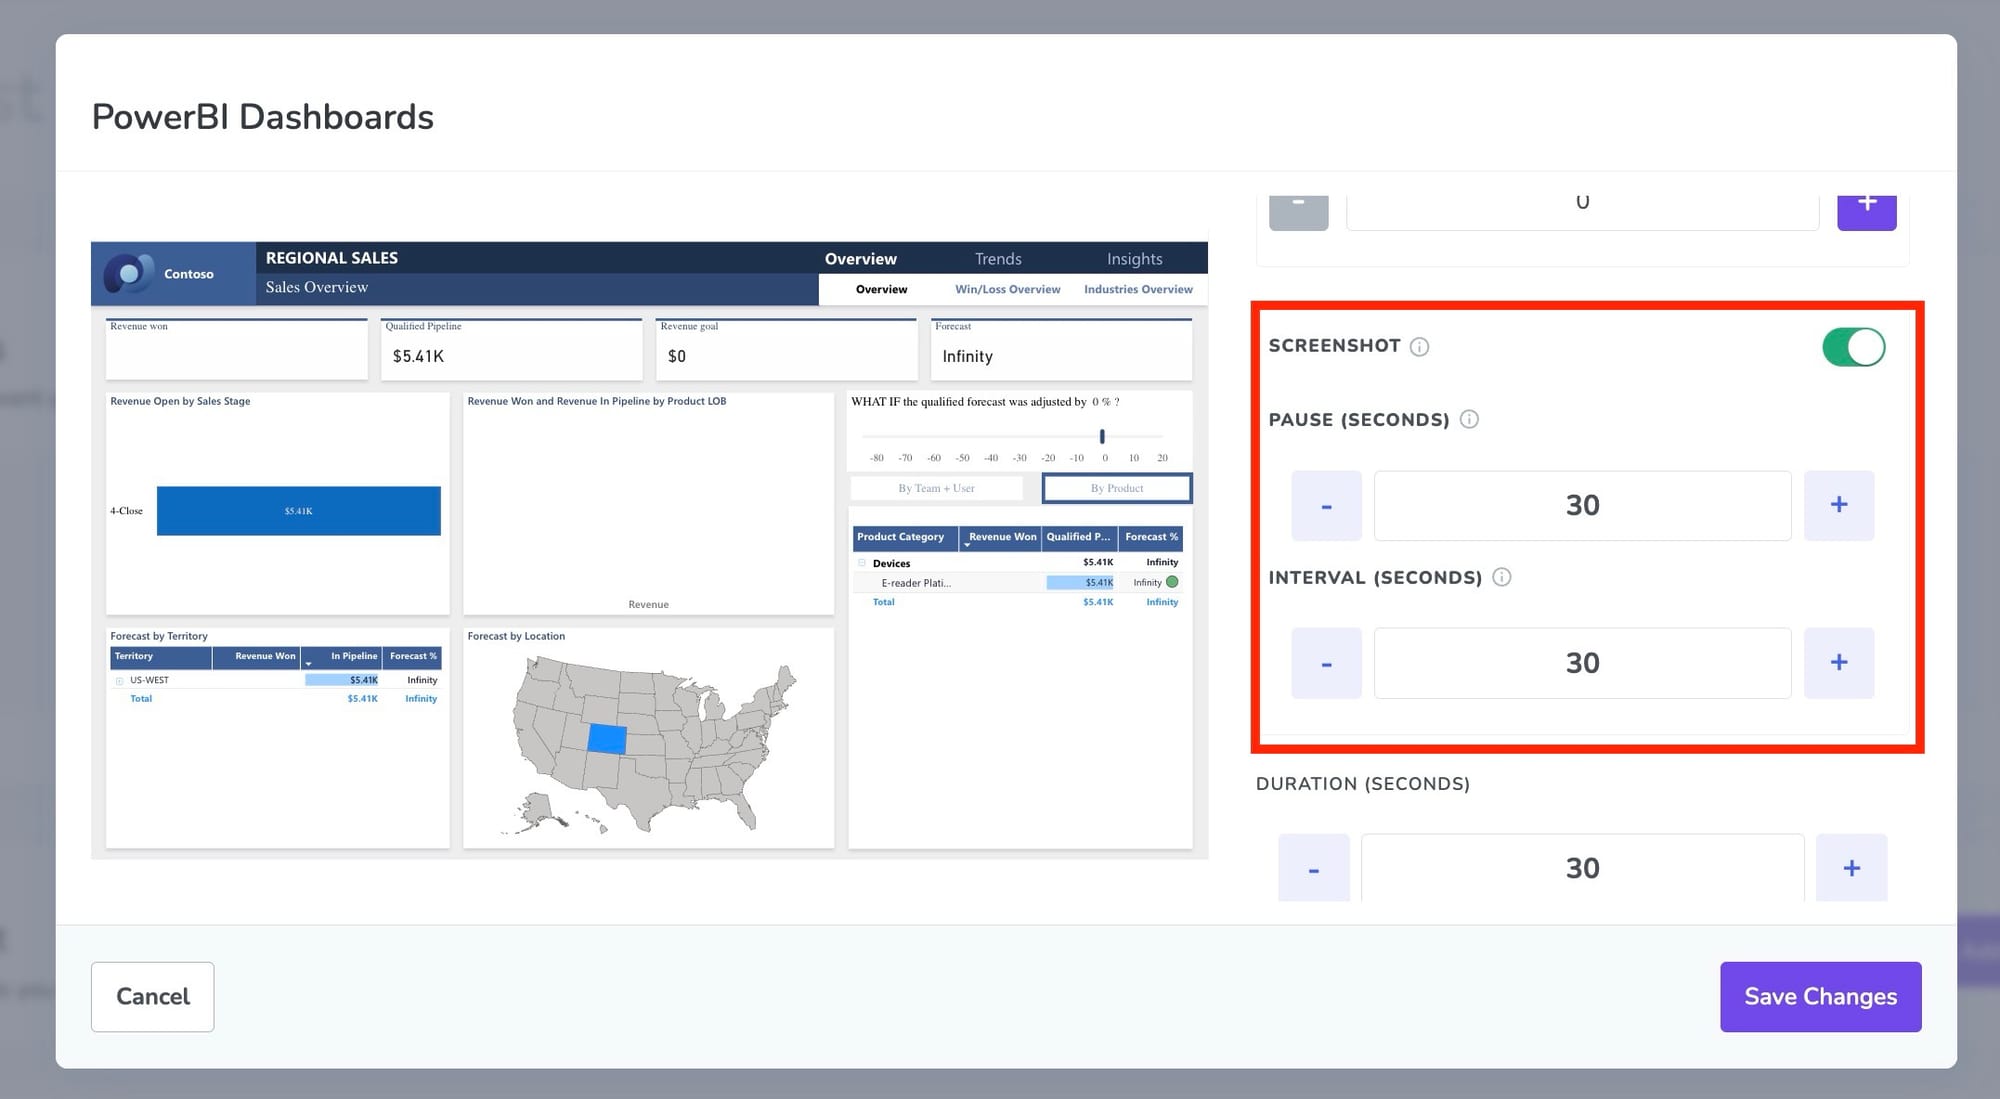
By default, the app uses the Power BI API to load your dashboard directly on the screen or device. But if your setup struggles with that, you can switch to Screenshot mode.
In Screenshot mode, Fugo opens your Power BI dashboard in a secure, cloud-based virtual browser, takes a screenshot, and sends that image to your screen. The screenshot is then refreshed automatically at the interval you set.
When to use Screenshot mode:
- Your screen or device uses an outdated browser (Power BI requires one of the two most recent versions of Chrome).
- Your hardware has limited processing power, making it difficult to load complex reports in real time.
- You need a lighter-weight fallback that’s less likely to stall or break.
You can also set a pause to allow the report time to fully load before the screenshot is captured - helpful for data-heavy dashboards.
6. Set duration & save your app instance
Choose how long this dashboard should be displayed within a loop of content (e.g. 10, 20, 60 seconds).
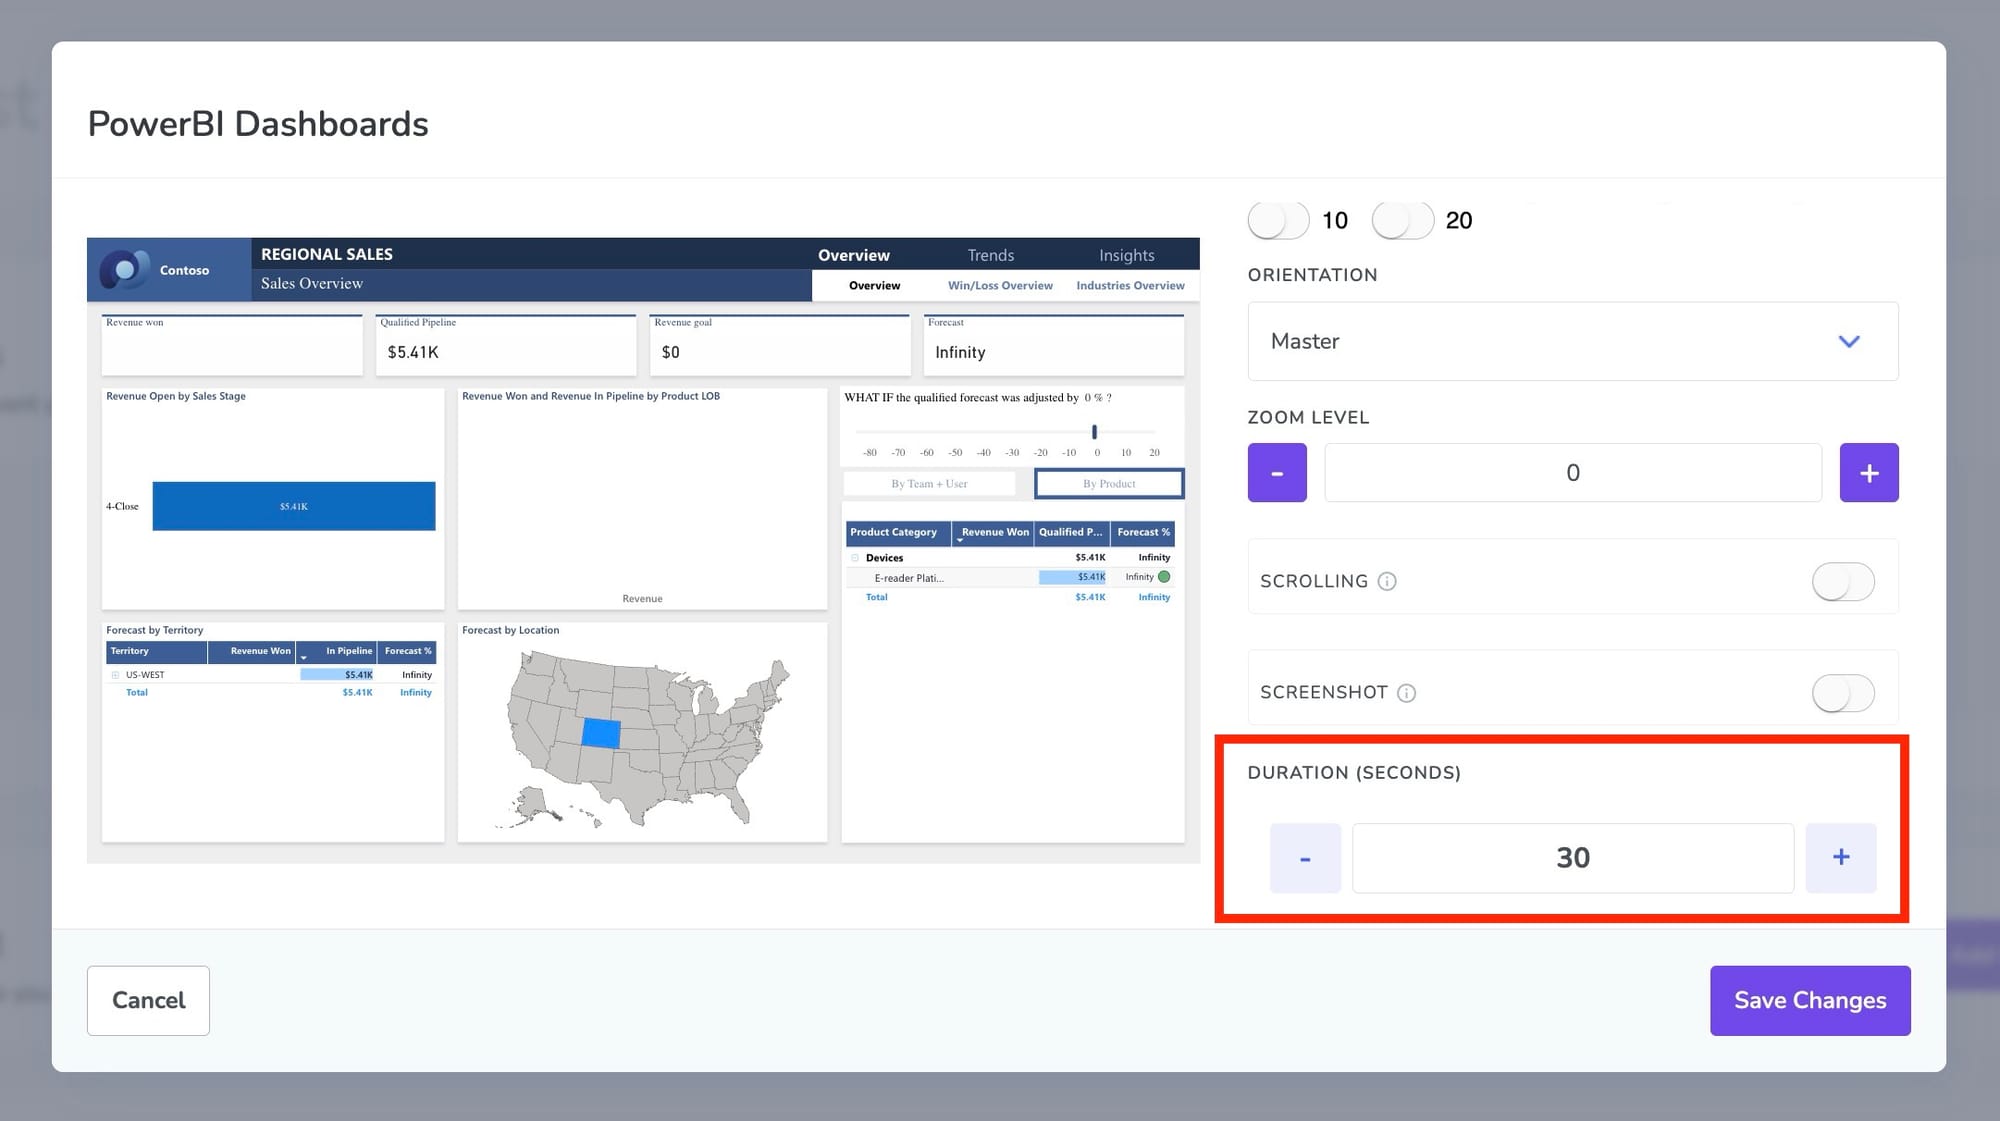
Click Save Changes. The configured app will appear as a slide in your playlist:
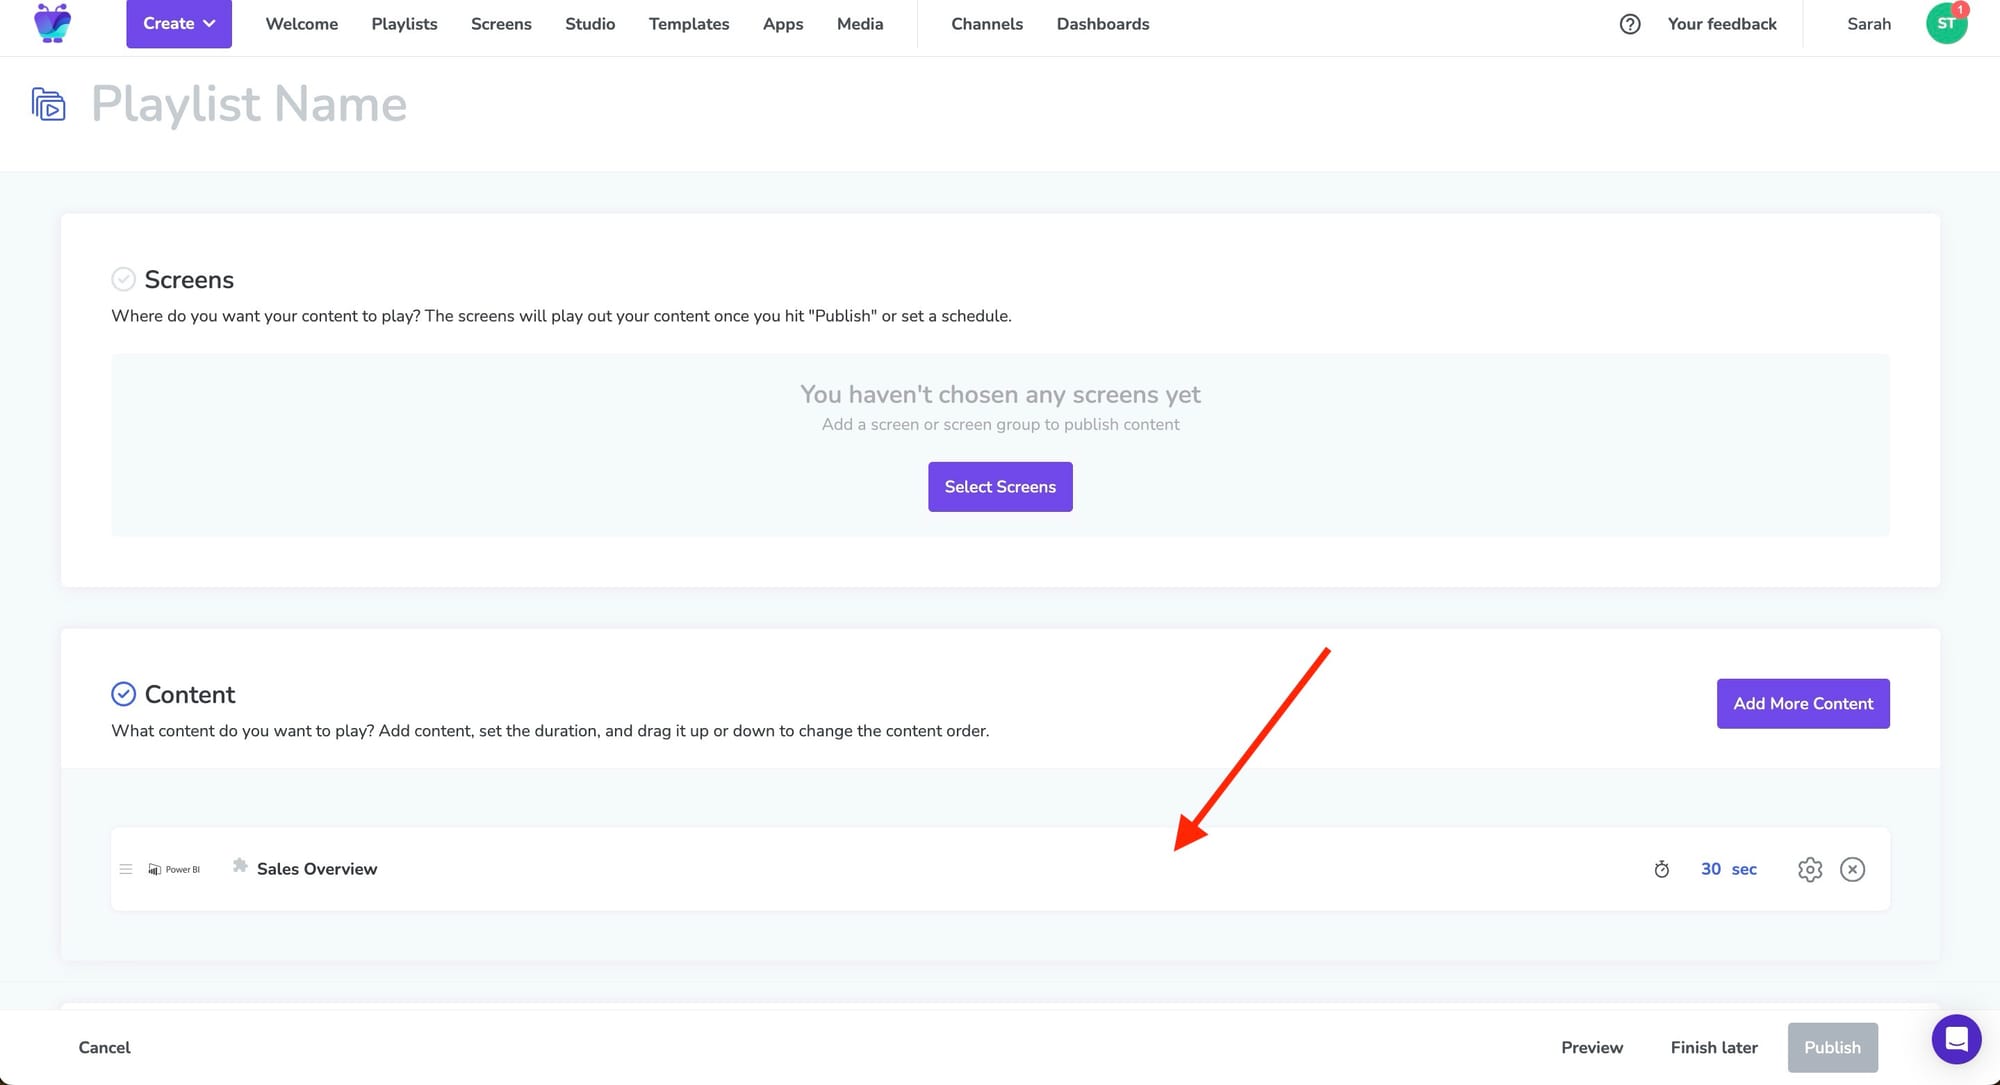
Want to show multiple pages from a multi-tab report? Add another Power BI app instance for each page.
7. Build out the rest of your playlist
At this stage, you can keep building your playlist out with more content if you've got it (PPT presentations you want to repurpose, media uploads, video links, etc).

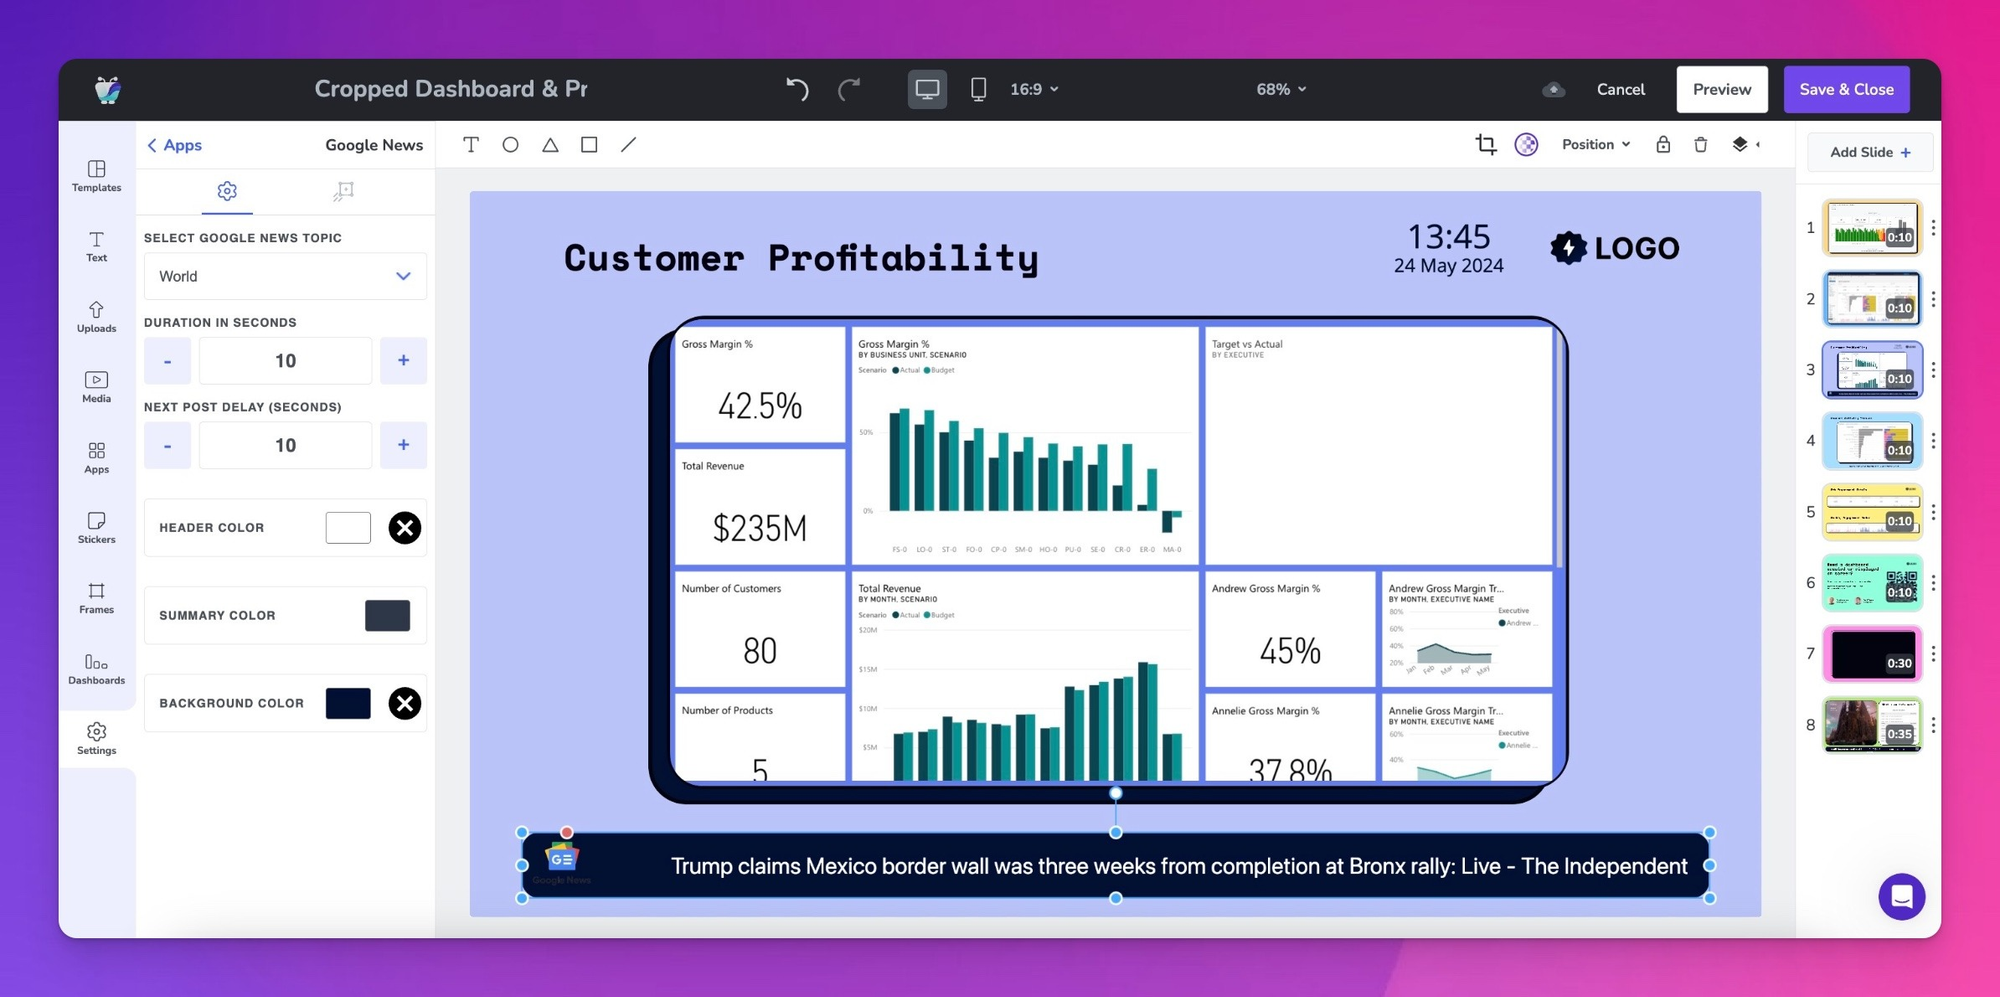
Bonus: Create custom layouts for your report slides
Your reports don't have to be the only item on your slide! Fugo's Design Studio allows you to embed your Power BI reports and dashboards into fully customizable slides.
Think of it like embedding your Power BI report in PowerPoint, except that you're not limited to working with just text & media. You can mix in news tickers, clocks, or other media to create a full signage experience, or:
- Add your company logo the slide
- Crop the app to visually highlight key parts of your dashboard
- Add text boxes and scrolling ticker texts with important messages, reminders, or requests pertaining to your dashboards or data initiatives
- Add QR codes to your display to create calls to action for your colleagues pertaining to your dashboards or workflows
- Incorporate other apps & integrations into the display, such as the World Clock app or CNN app to grab attention with live updating headlines
8. Publish to your screen
Finally, assign your playlist to the screen (or screens) you want it displayed on.
You can:
- Preview how it’ll look
- Publish instantly
- Or schedule it to run at specific times or days
Once published, Fugo will refresh your Power BI dashboard automatically in the background - no laptop, no casting, no hands-on maintenance.
From your Fugo account, you can check in any time to see how your screen's doing:
- Is it online?
- Is it displaying your reports correctly?
- Do you have any content that's going to expire soon?
- Want to update your playlist with new reports or announcement slides?
Beyond dashboards: What digital signage software can add
Digital signage platforms - including tools like Fugo - are designed to go further than just displaying Power BI dashboards. Once you’ve got a screen connected, you’re not limited to a single analytics source or a fixed layout.
Many platforms support multiple dashboard integrations, so you can rotate through reports from tools like Looker, Grafana Cloud, Salesforce, or HubSpot in addition to Power BI. Some also offer drag-and-drop slide builders that replicate the layout flexibility of PowerPoint, but with the added ability to embed live widgets, apps, branded visuals, and messaging layers.
More advanced options include screen casting features, which allow people in the room to temporarily take over the screen for impromptu presentations or whiteboard sessions without disrupting the scheduled content for the rest of the day.
In short: if your screen’s role is evolving from “Power BI display” to a more dynamic and multi-purpose workplace tool, it may be worth looking at signage software that can support those use cases natively.
TL;DR: When to use PowerPoint, and when to switch to digital signage
- PowerPoint works well for meetings and short-term setups, especially when a team member is actively presenting or interacting with the dashboard.
- But if you need your reports to run all day on unattended screens — in lobbies, offices, sales floors, or control rooms — PowerPoint starts to fall short.
- Digital signage software like Fugo gives you a dedicated way to display Power BI dashboards reliably, with refresh intervals, scroll settings, and remote publishing.
- Fugo also lets you build multi-app playlists, layer in branding and messaging, and connect dashboards from tools beyond Power BI all without needing a laptop plugged in.
- Bonus: You can even cast your device to the screen when you need to go off-script or run a quick collaborative session.
Try Fugo with your Power BI dashboards & reports
Fugo offers a 14-day free trial, so you can test your dashboards in a live display environment without committing. No credit card required.
Or, if you’d like to see a live demo and talk through your specific use case: