

Logistics dashboard displays
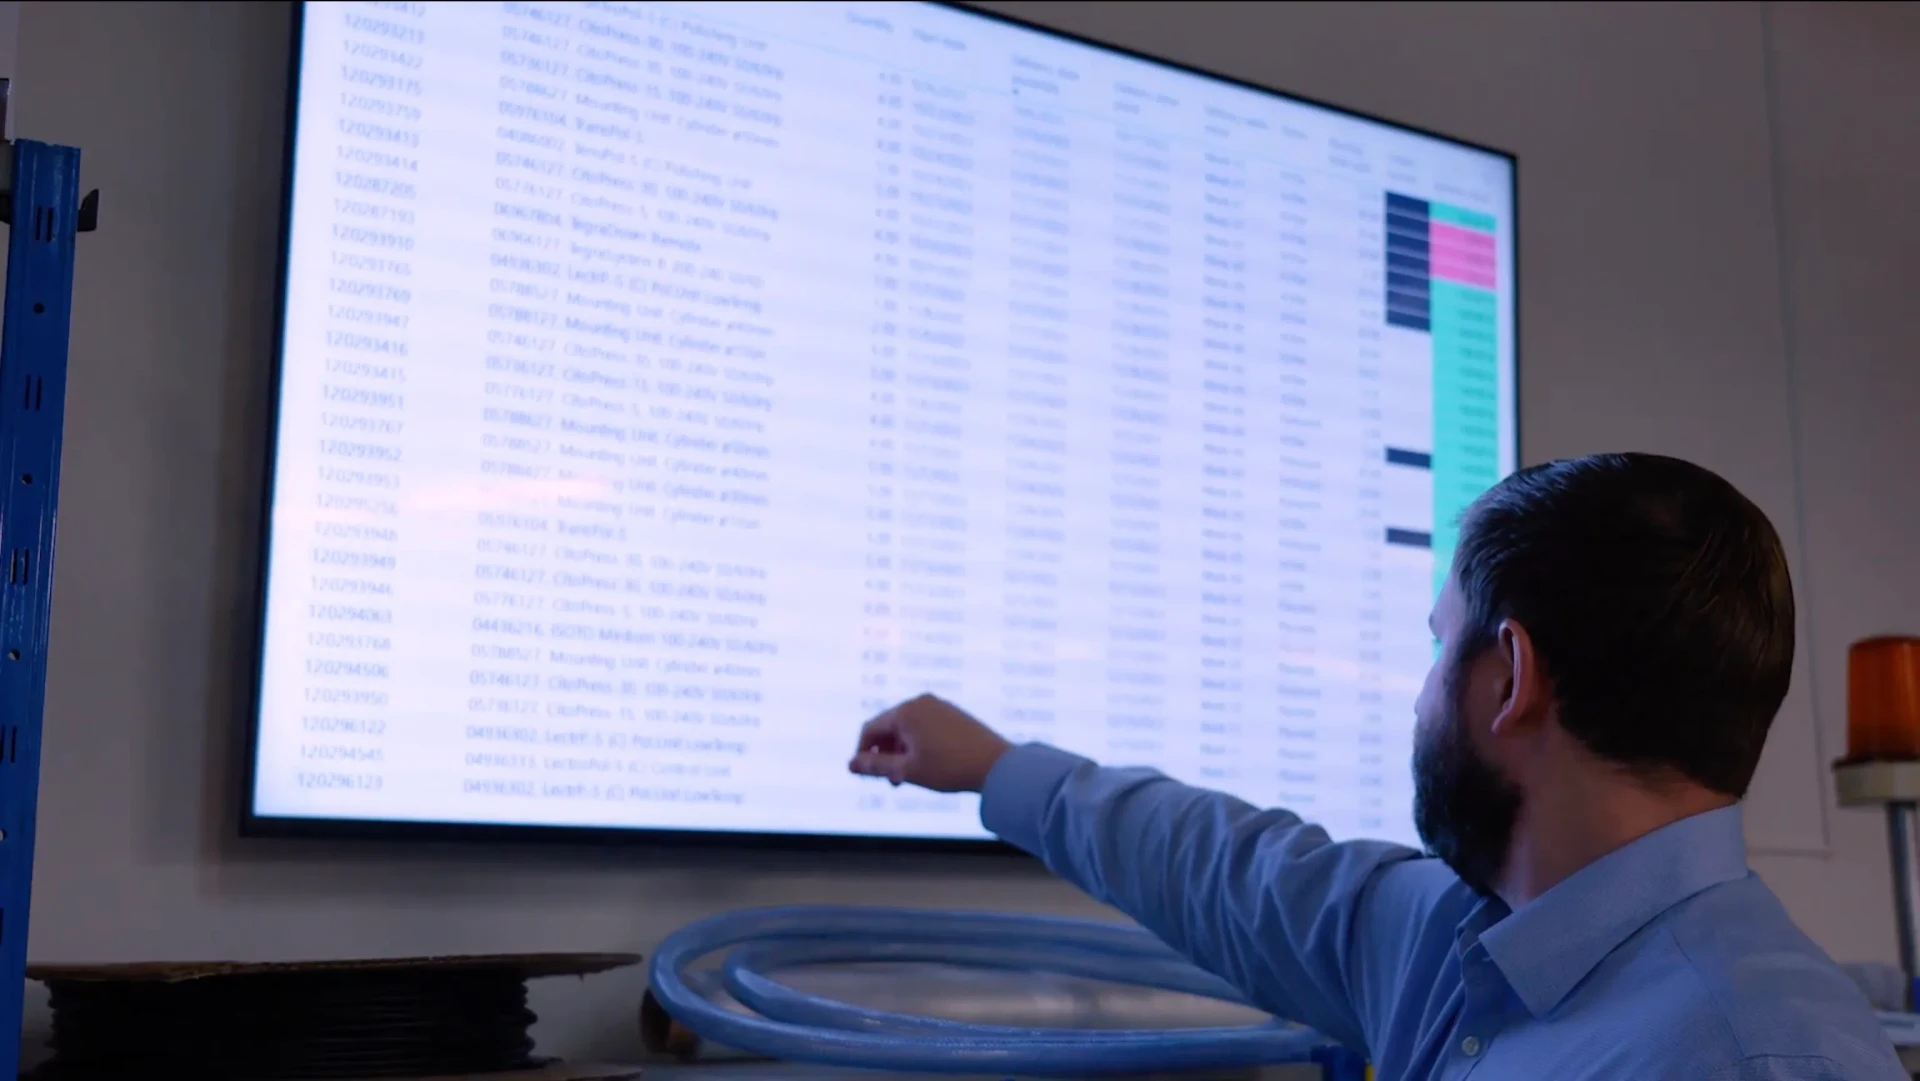
Put logistics dashboards from your existing systems onto shared screens. Dispatch, warehouse, and management stay aligned on shipments, delays, and performance without toggling between tools.
Why logistics teams put dashboards on screens
Shared screens turn shipment data into something the whole floor can act on, not just whoever has the right tab open.
Make delays visible before they escalate
A delayed shipment on a shared screen gets attention from everyone nearby. Teams catch problems earlier than they would checking dashboards individually.
Reduce status-check calls between teams
When dispatch can see warehouse throughput and warehouse can see delivery status, there are fewer interruptions asking for updates.
Keep dispatch and warehouse aligned
Both teams work from the same live data. Dispatch sees what is leaving the dock. Warehouse sees what carriers are waiting.
Support shift handoffs with current data
The incoming shift sees exactly where things stand. No waiting for a verbal briefing or digging through overnight logs.
Track SLA compliance where teams can see it
On-time delivery rates and SLA targets stay visible throughout the day. Teams self-correct before metrics slip.
Spot bottlenecks without opening reports
When throughput drops or exceptions pile up, the pattern shows on screen. Nobody needs to pull a report to notice it.
What logistics teams show on screens
Logistics displays typically combine shipment tracking, fleet status, and performance metrics from your existing tools.
Shipment tracking status
Live shipment locations, current status, and estimated arrival times from your TMS or tracking platform.
Fleet and vehicle status
Vehicle locations, route progress, and driver assignments from fleet management tools.
Delivery SLA metrics
On-time delivery rates, SLA attainment by carrier or lane, and delivery exception counts.
Route performance
Transit times by lane, carrier comparisons, and route efficiency from your analytics tools.
Warehouse throughput
Picking, packing, and shipping rates against daily targets from your WMS.
Exception and delay alerts
Delayed shipments, missed pickups, and items requiring immediate attention.
Fugo features for logistics displays
Fugo connects to your existing logistics and analytics tools to put live data on any screen.
Dashboard integrations
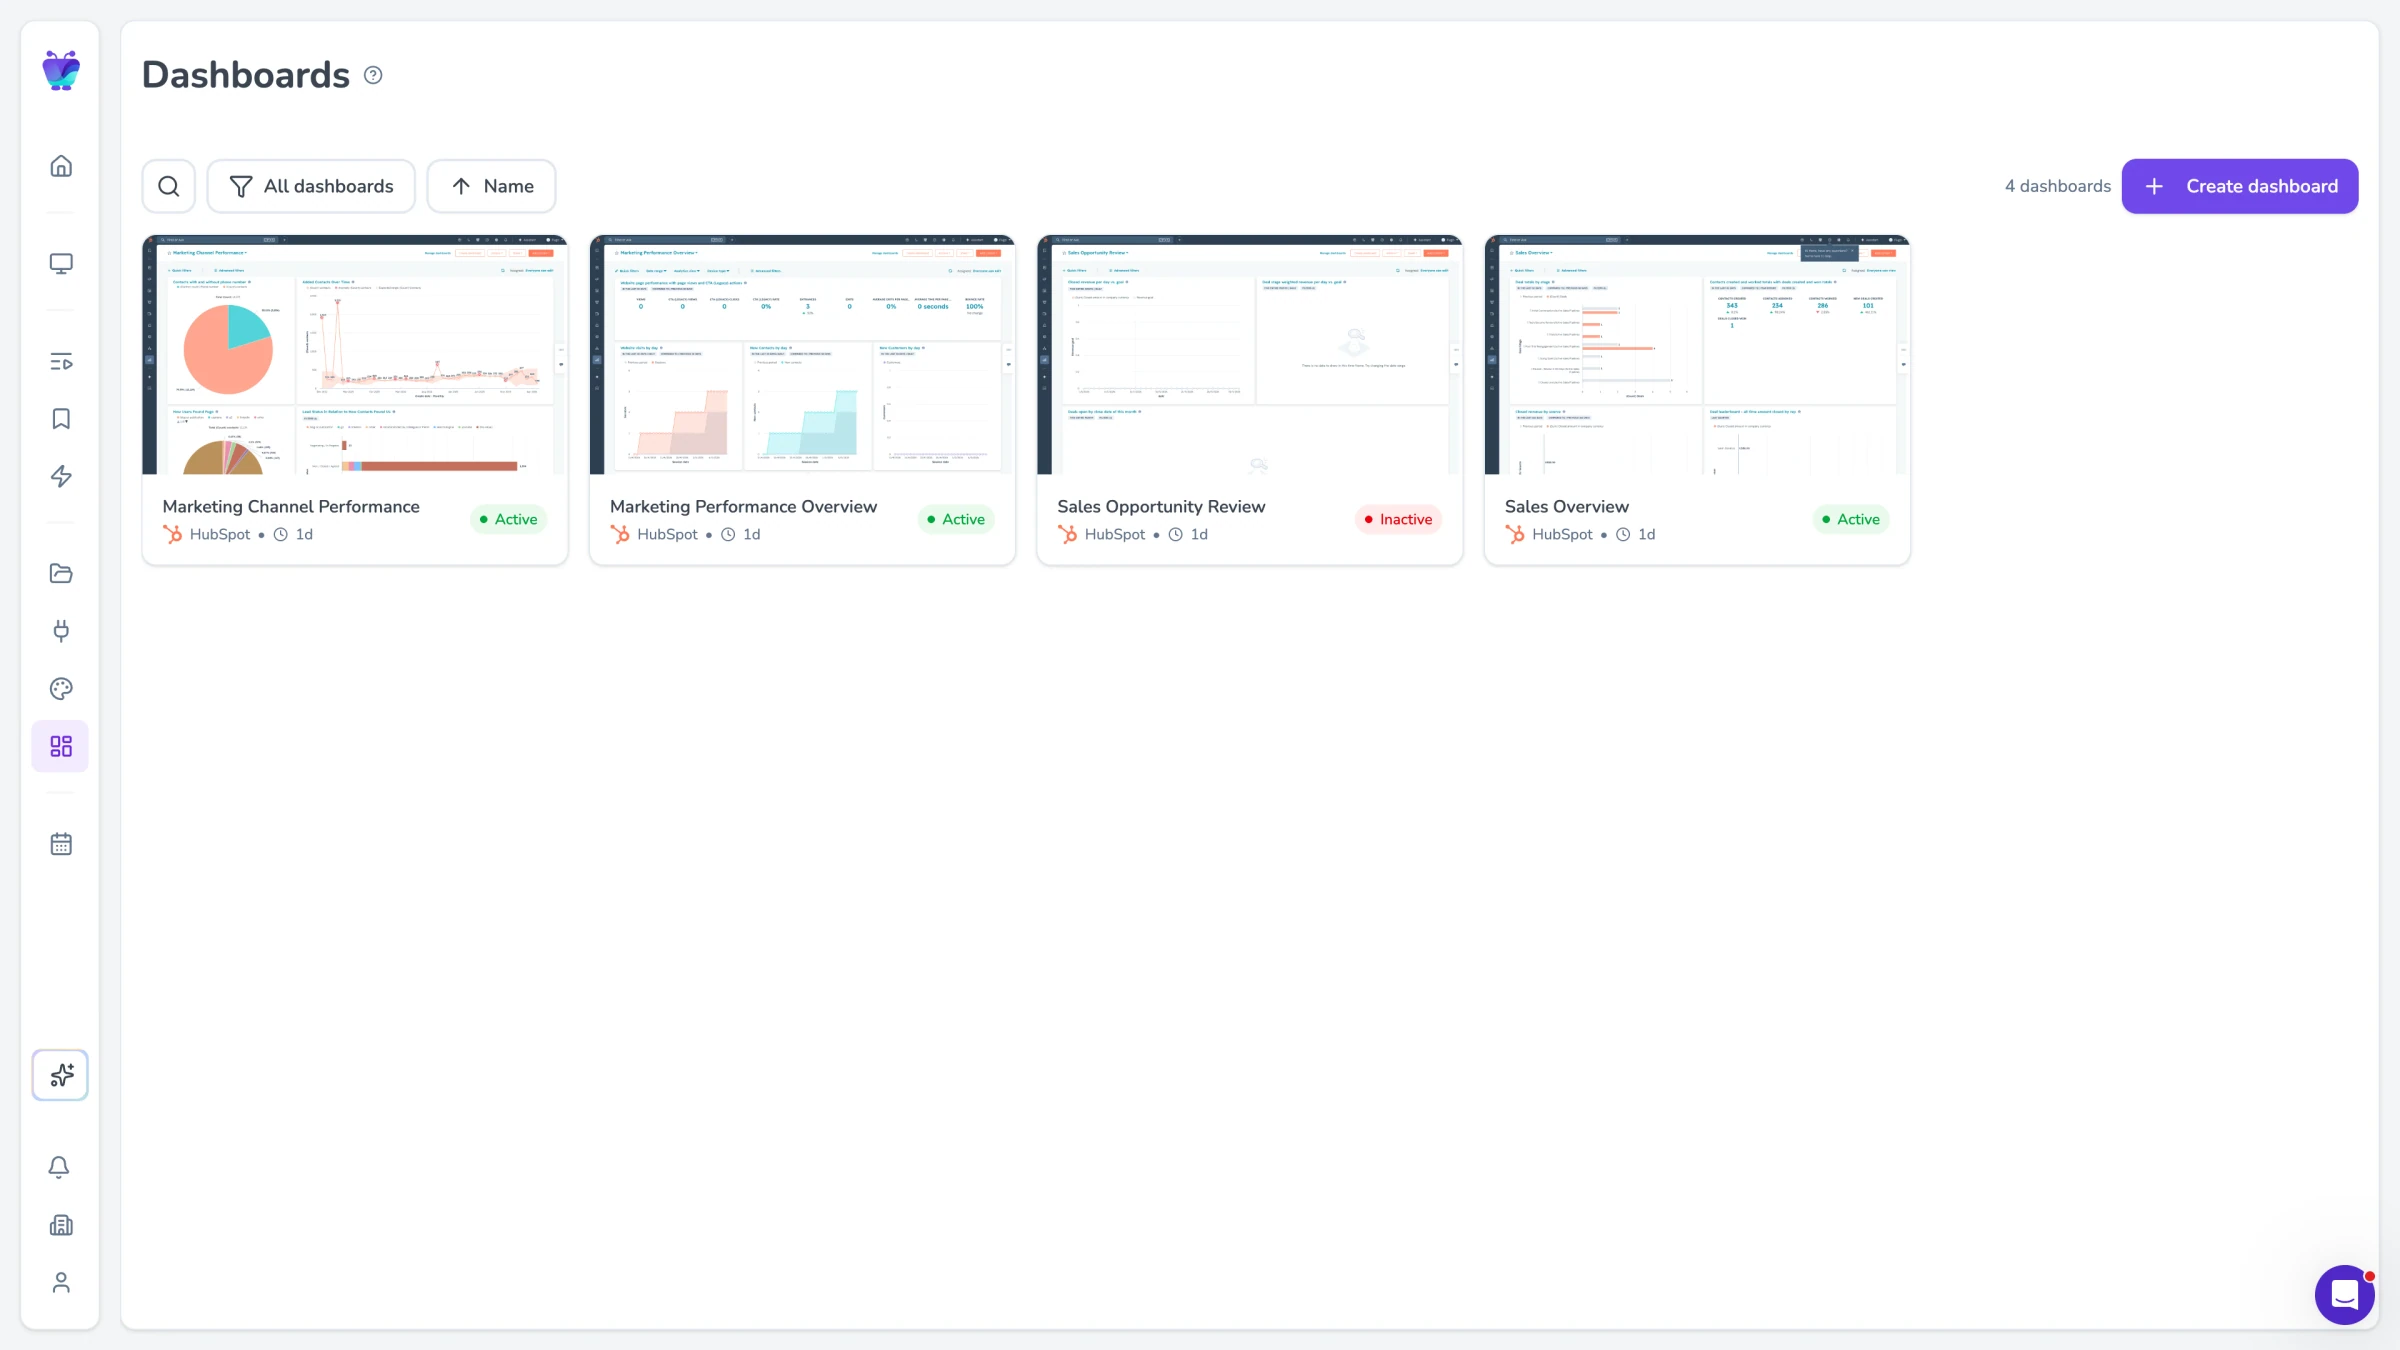
Display dashboards from your TMS, WMS, Power BI, Tableau, or any web-based logistics tool directly on screens.
Explore TV dashboards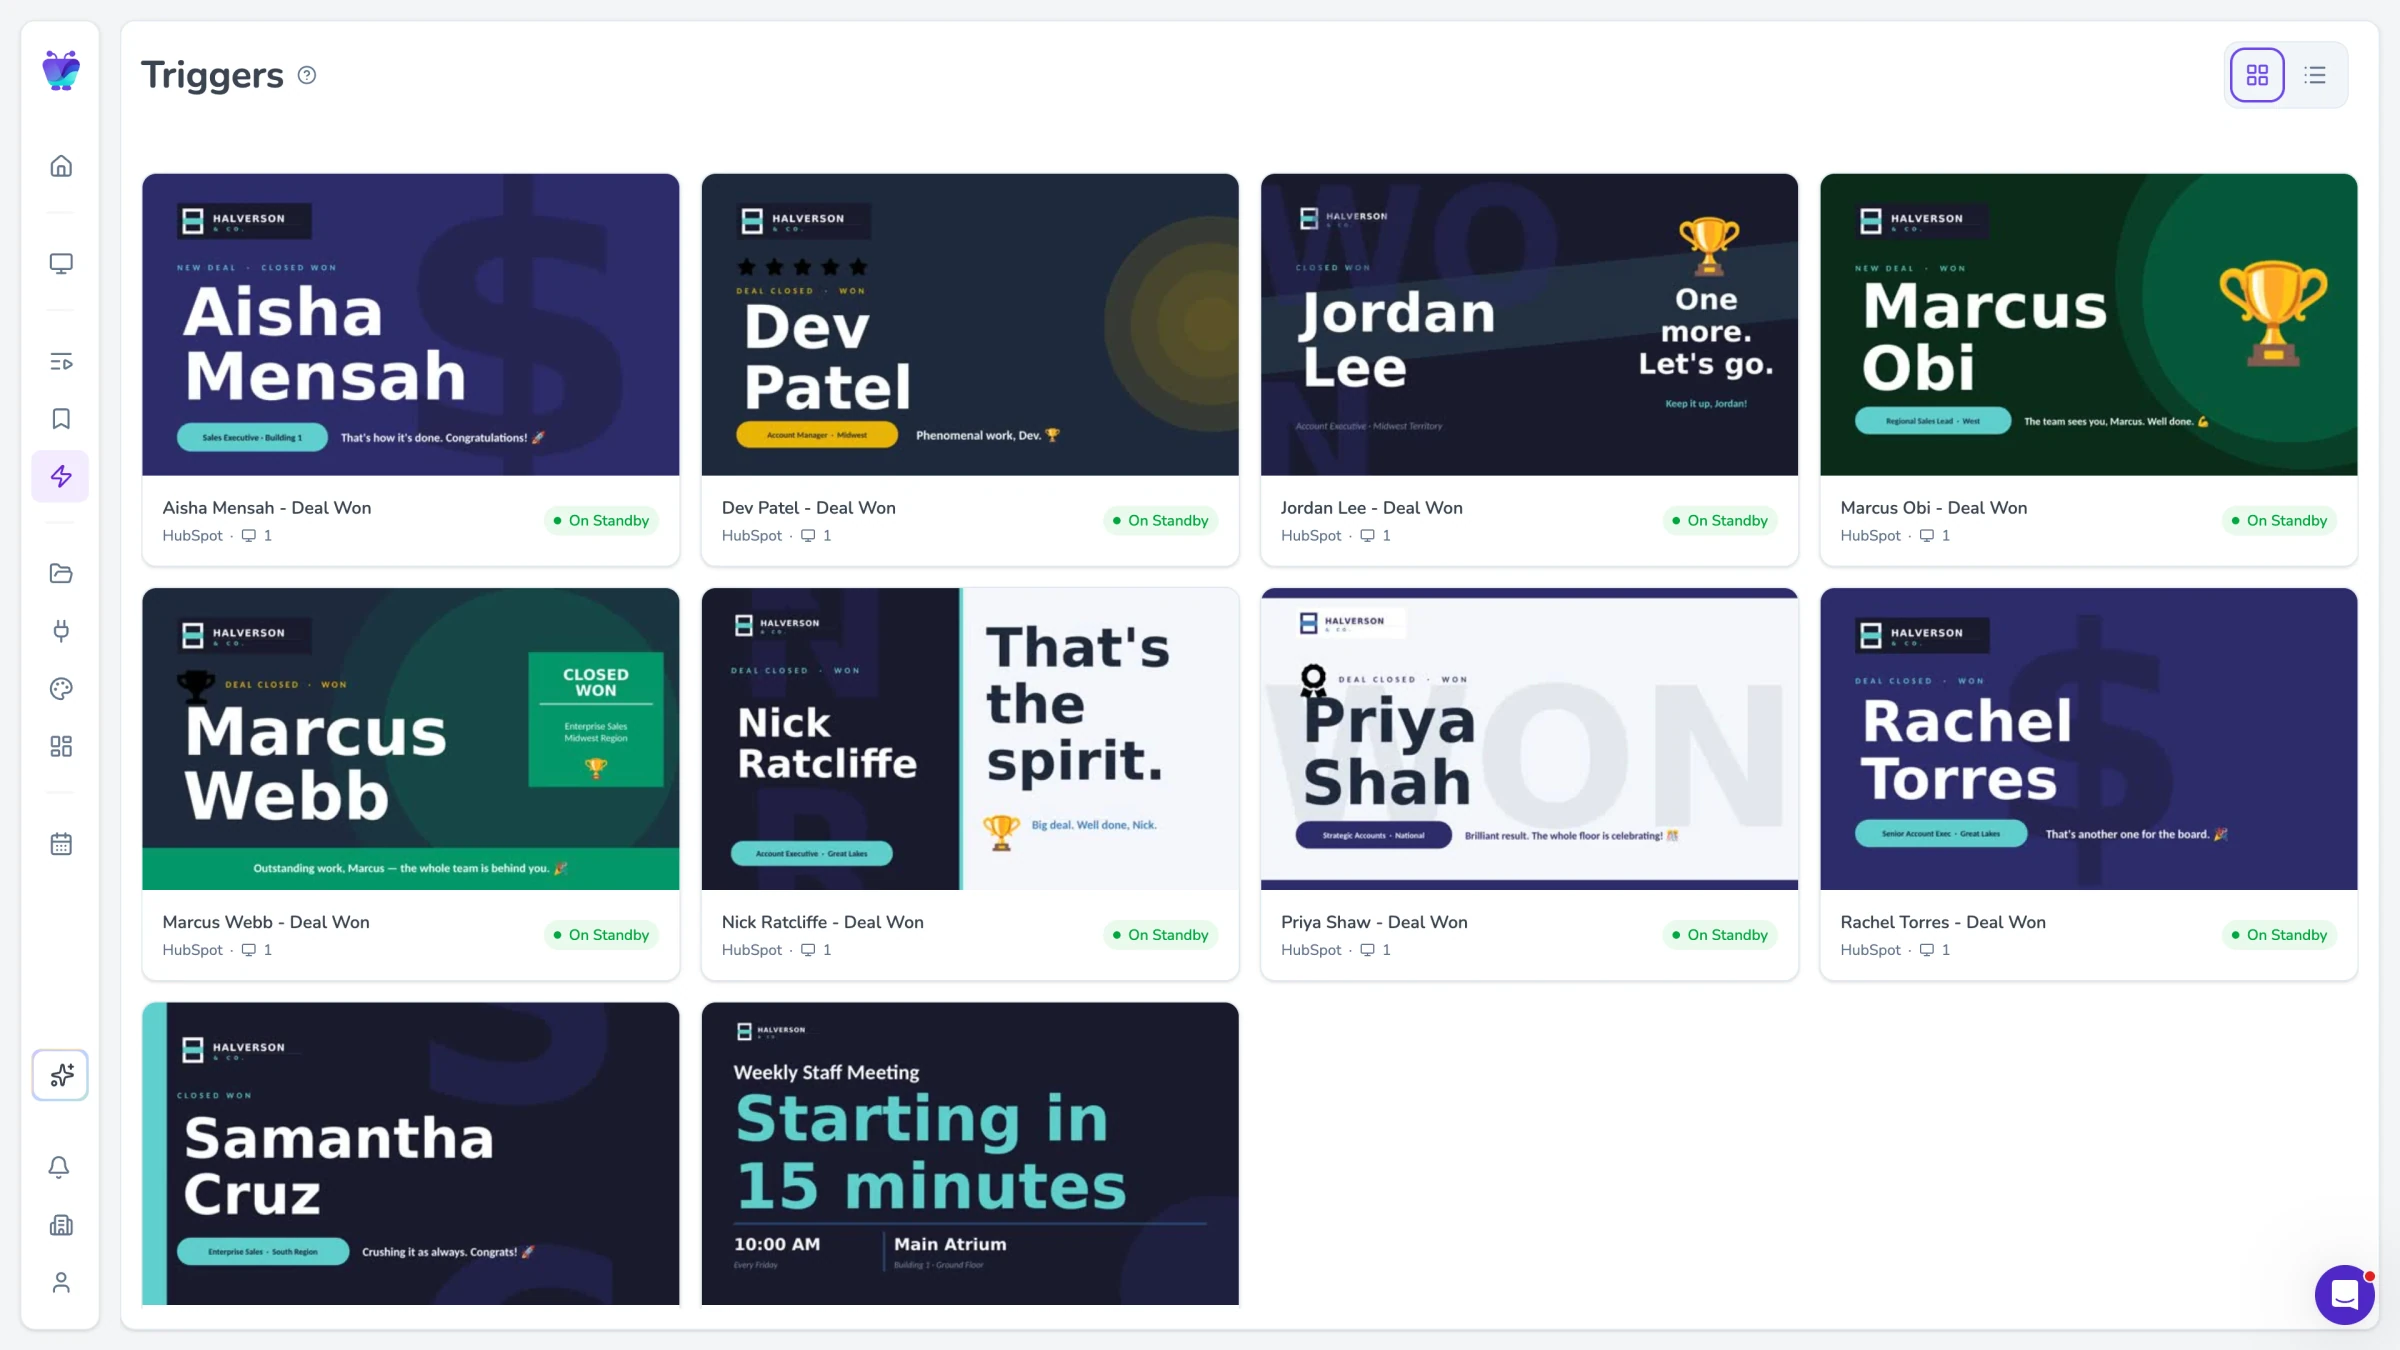
Content triggers
Automatically change what screens show when shipments are delayed, SLAs are at risk, or exceptions spike.
See content triggers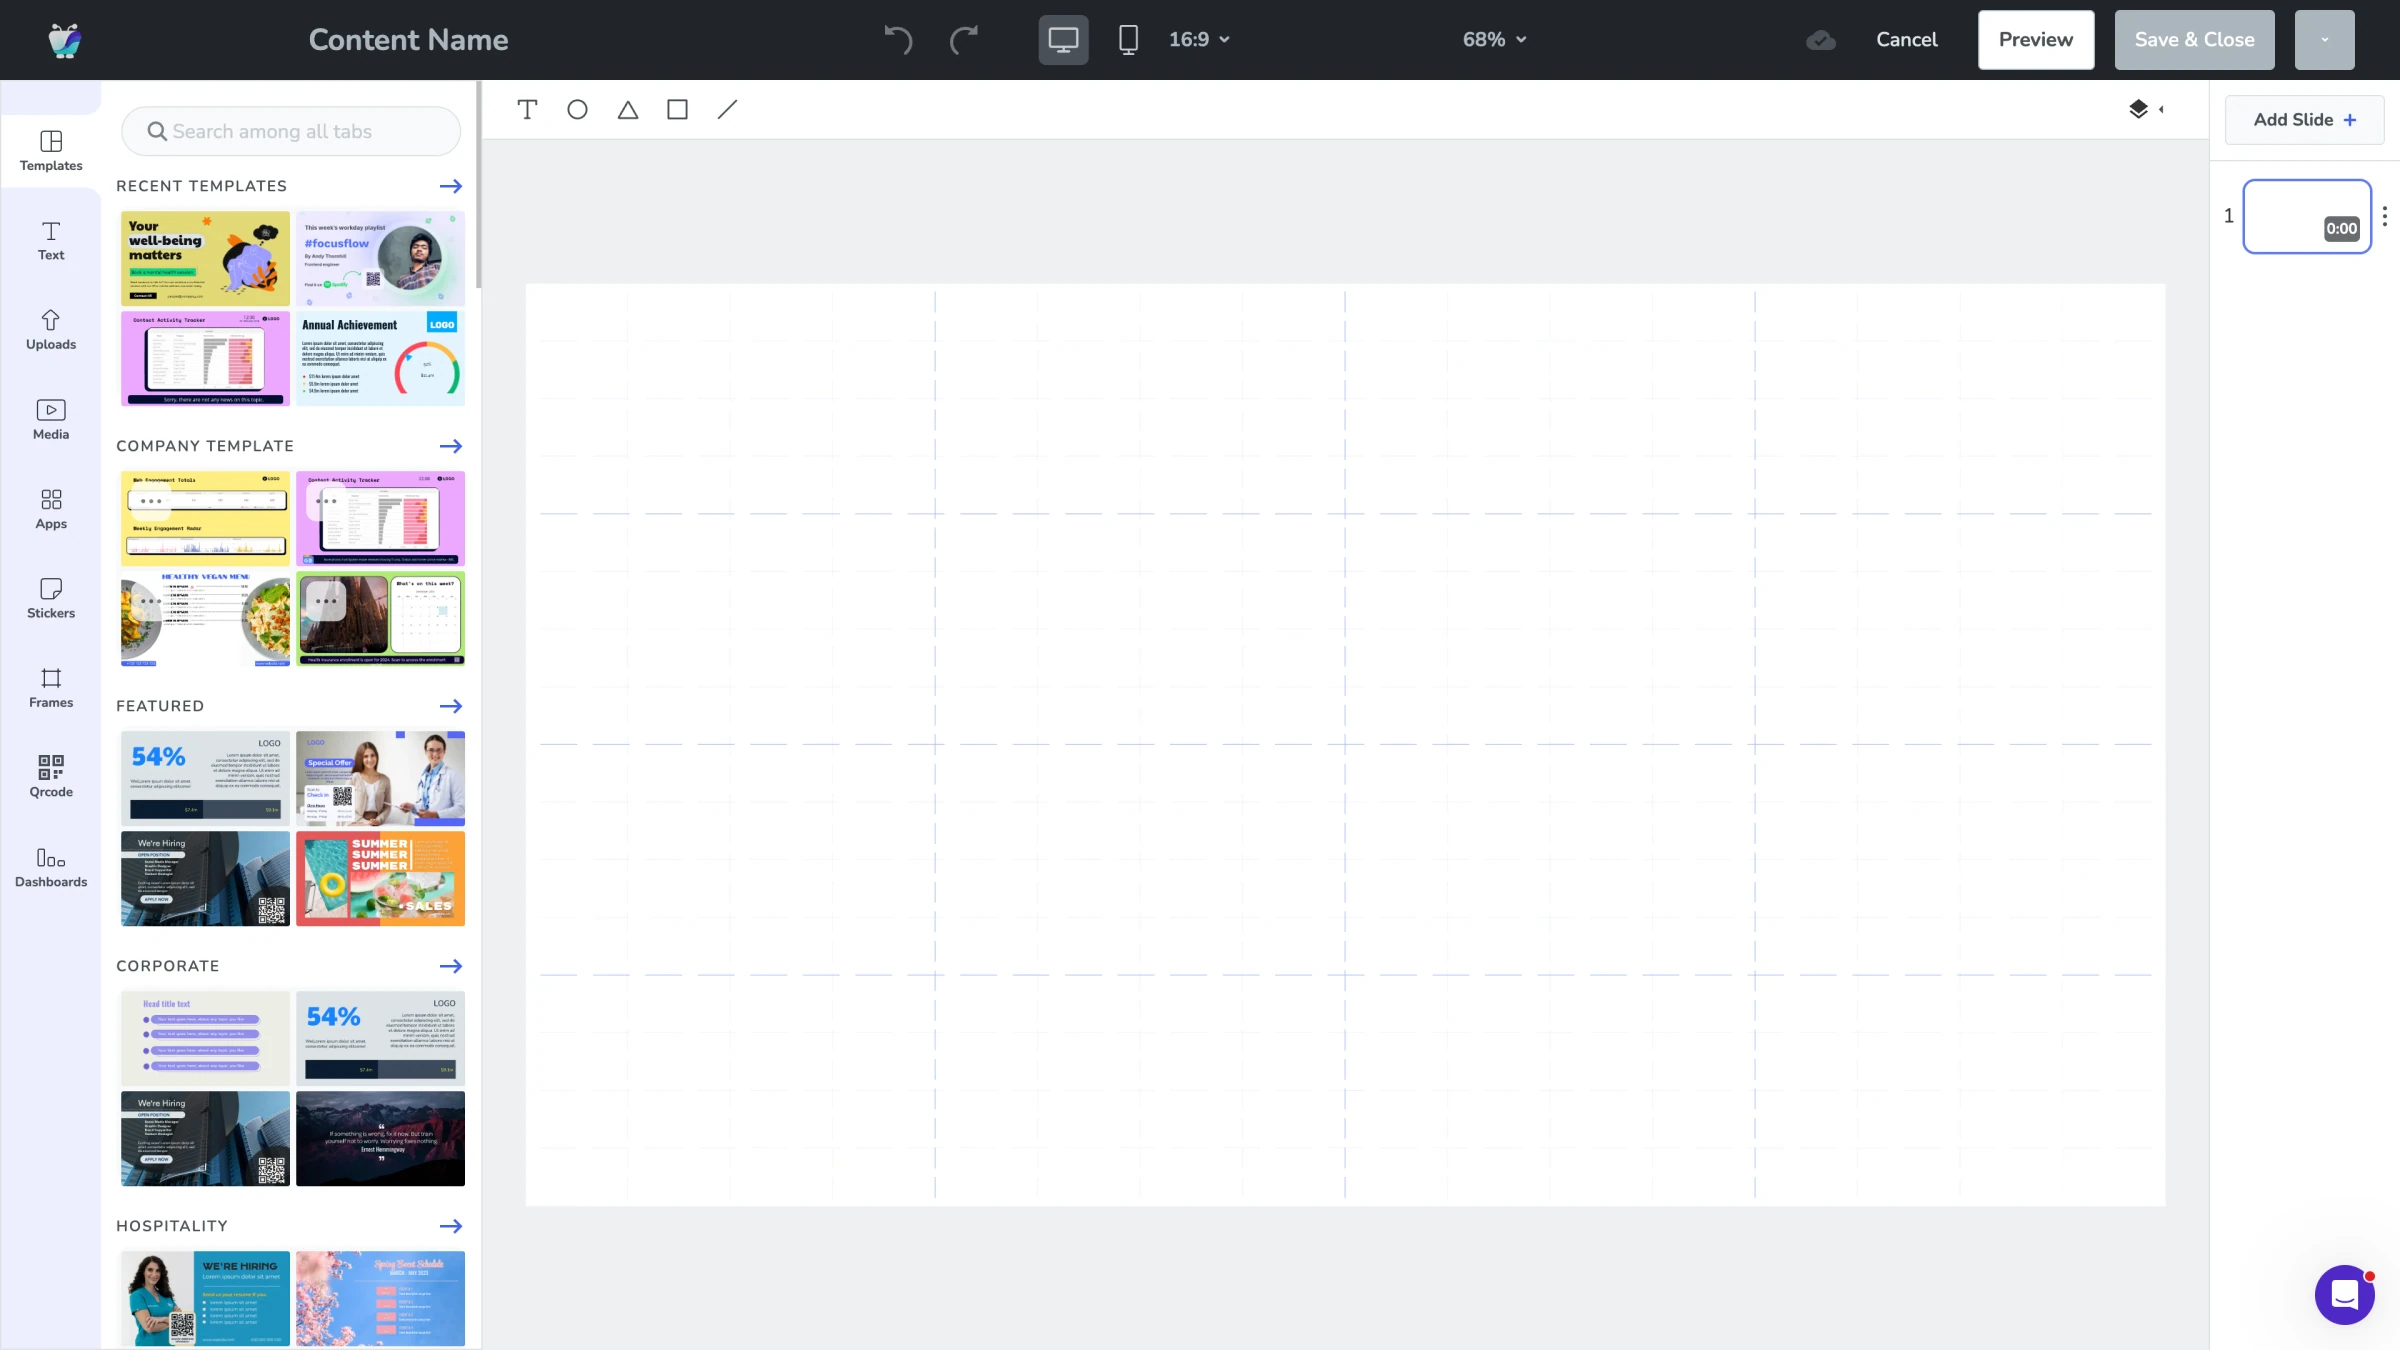
Design Studio
Build custom logistics dashboards that combine data from multiple sources into a single screen layout.
Explore Design Studio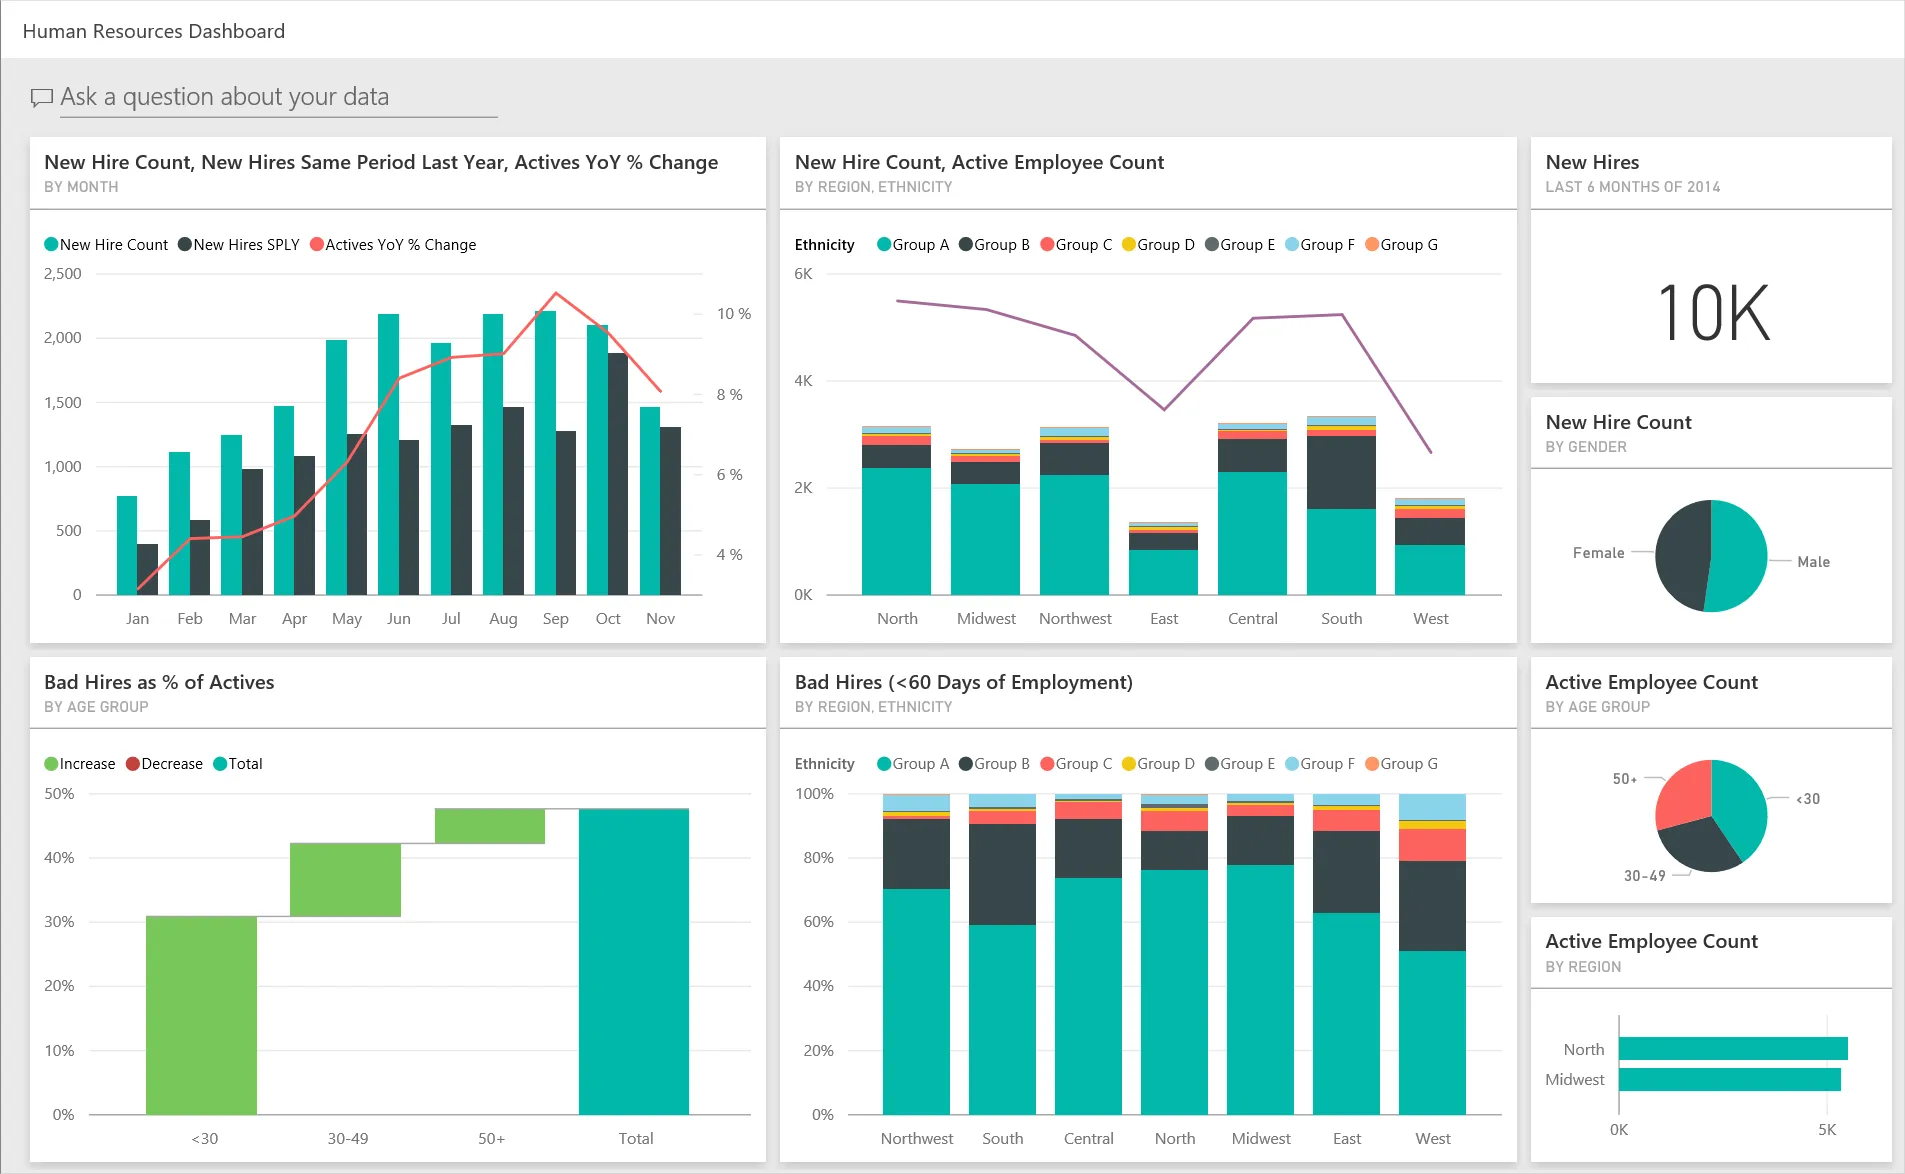
Power BI dashboards
Connect Power BI reports directly. Fugo handles authentication and keeps dashboards refreshing on screen.
Explore Power BI dashboards