

Call center dashboard displays
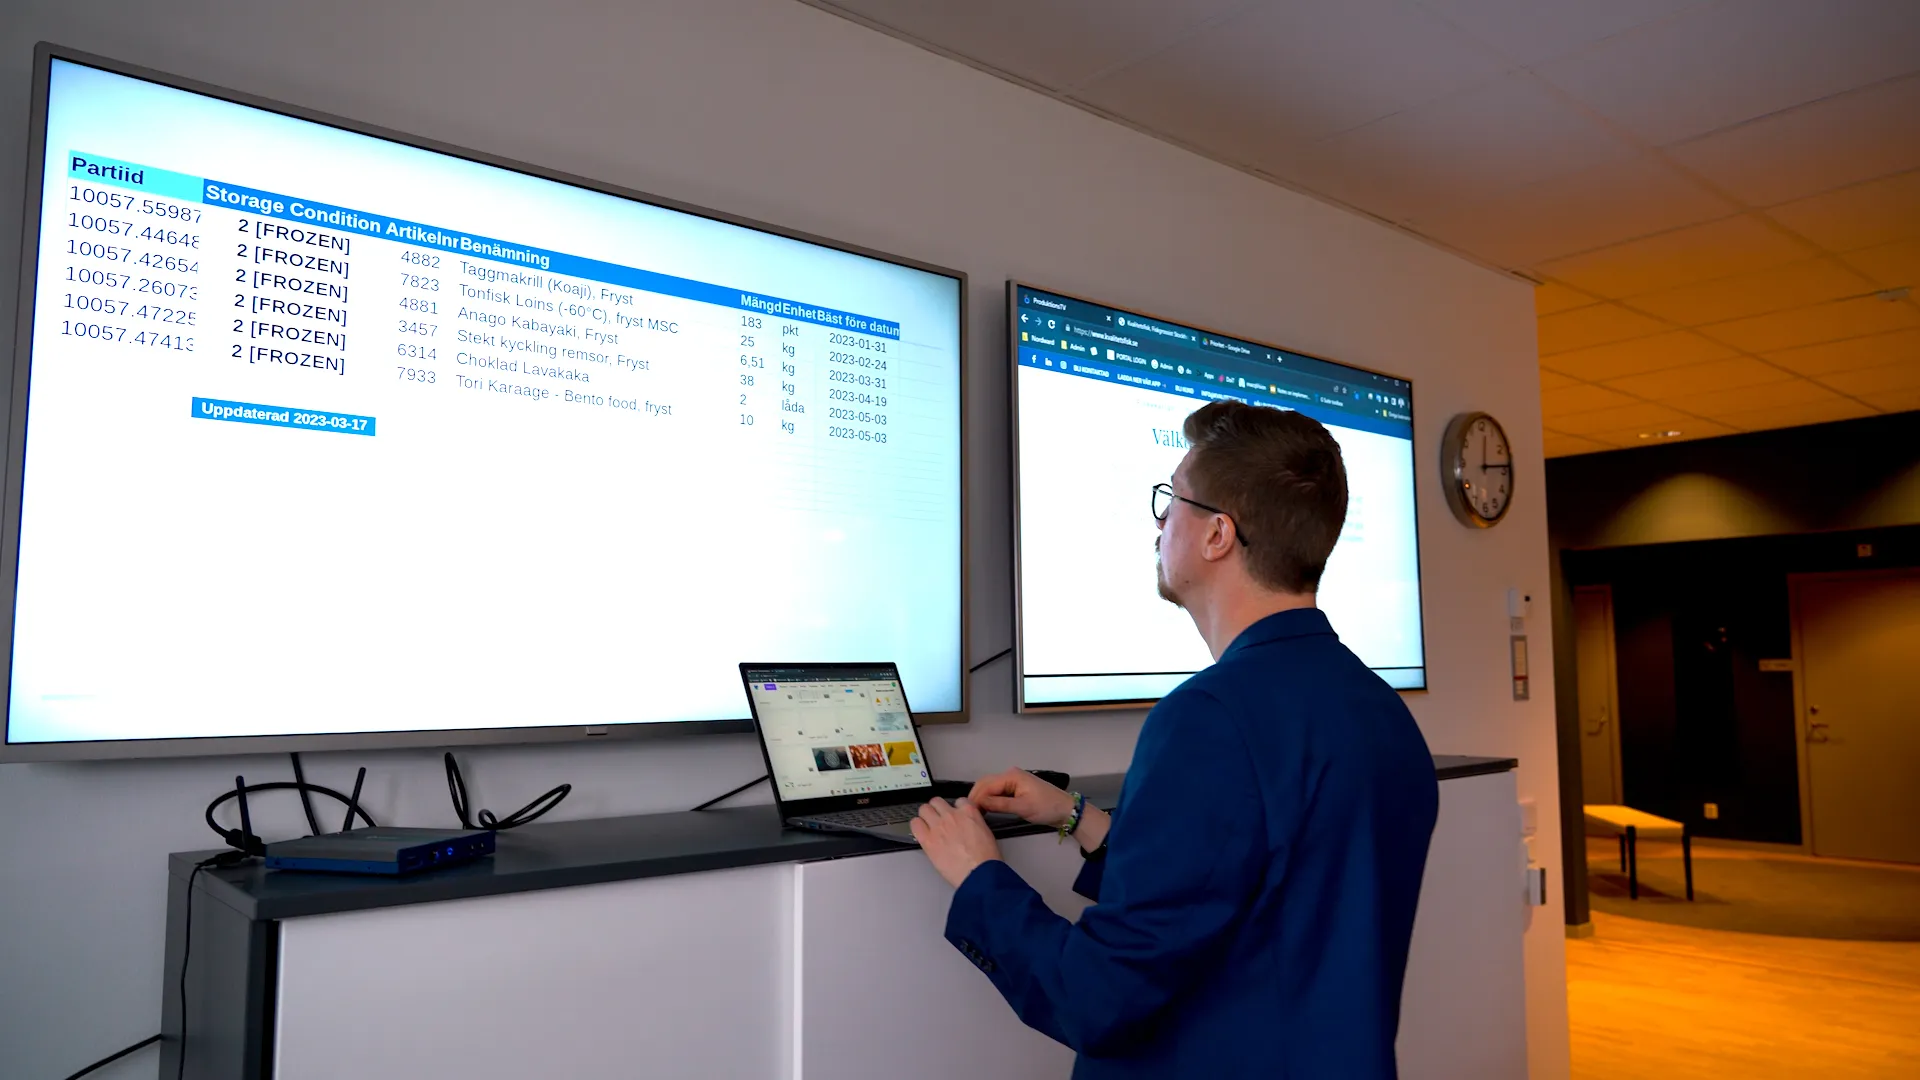
Put queue status, SLA metrics, and agent performance on shared screens so supervisors and agents react to conditions as they change. No tab switching, no delayed reports.
Why call centers put dashboards on screens
Visible metrics change behavior. When the whole floor can see queue depth and SLA status, teams respond faster and managers intervene earlier.
Make queue depth visible early
When agents and supervisors can see queue depth on a wall screen, staffing problems surface before customers start abandoning calls.
Cut time spent pulling reports
Supervisors checking dashboards on their laptops is a context switch. A wall display gives the same information passively, freeing time for coaching.
Keep agents aware of SLA status
Agents already have enough open on their desktops. A shared screen shows SLA compliance without asking anyone to open another browser tab.
Support staffing decisions during spikes
Volume spikes need quick responses. Visible call volume trends let supervisors reassign agents or activate overflow queues before service levels drop.
Surface trends hiding in analytics tools
Patterns in handle time, first-call resolution, and callback rates are easy to miss inside analytics platforms. On screen, they stay visible all day.
Create accountability around response times
When average speed of answer and abandonment rates are on the wall, the whole team shares ownership of service quality.
What call center teams show on screens
Call center displays typically combine queue status, agent metrics, and service level data from contact center platforms.
Real-time queue depth and wait times
Current calls waiting, longest wait time, and queue trends by skill group.
SLA compliance and service levels
Percentage of calls answered within target, tracked against daily and weekly goals.
Agent availability and status
How many agents are available, on calls, in wrap-up, or on break across each queue.
Call volume trends and patterns
Inbound volume over the last hour, day, and week to help anticipate staffing needs.
Customer satisfaction scores
CSAT and NPS results from post-call surveys, updated as new responses come in.
Escalation alerts and priority tickets
Flagged tickets, VIP callers, and escalations that need immediate supervisor attention.
Fugo features for call center displays
Fugo connects to your contact center tools and puts live dashboards on any screen in the building.
Dashboard integrations
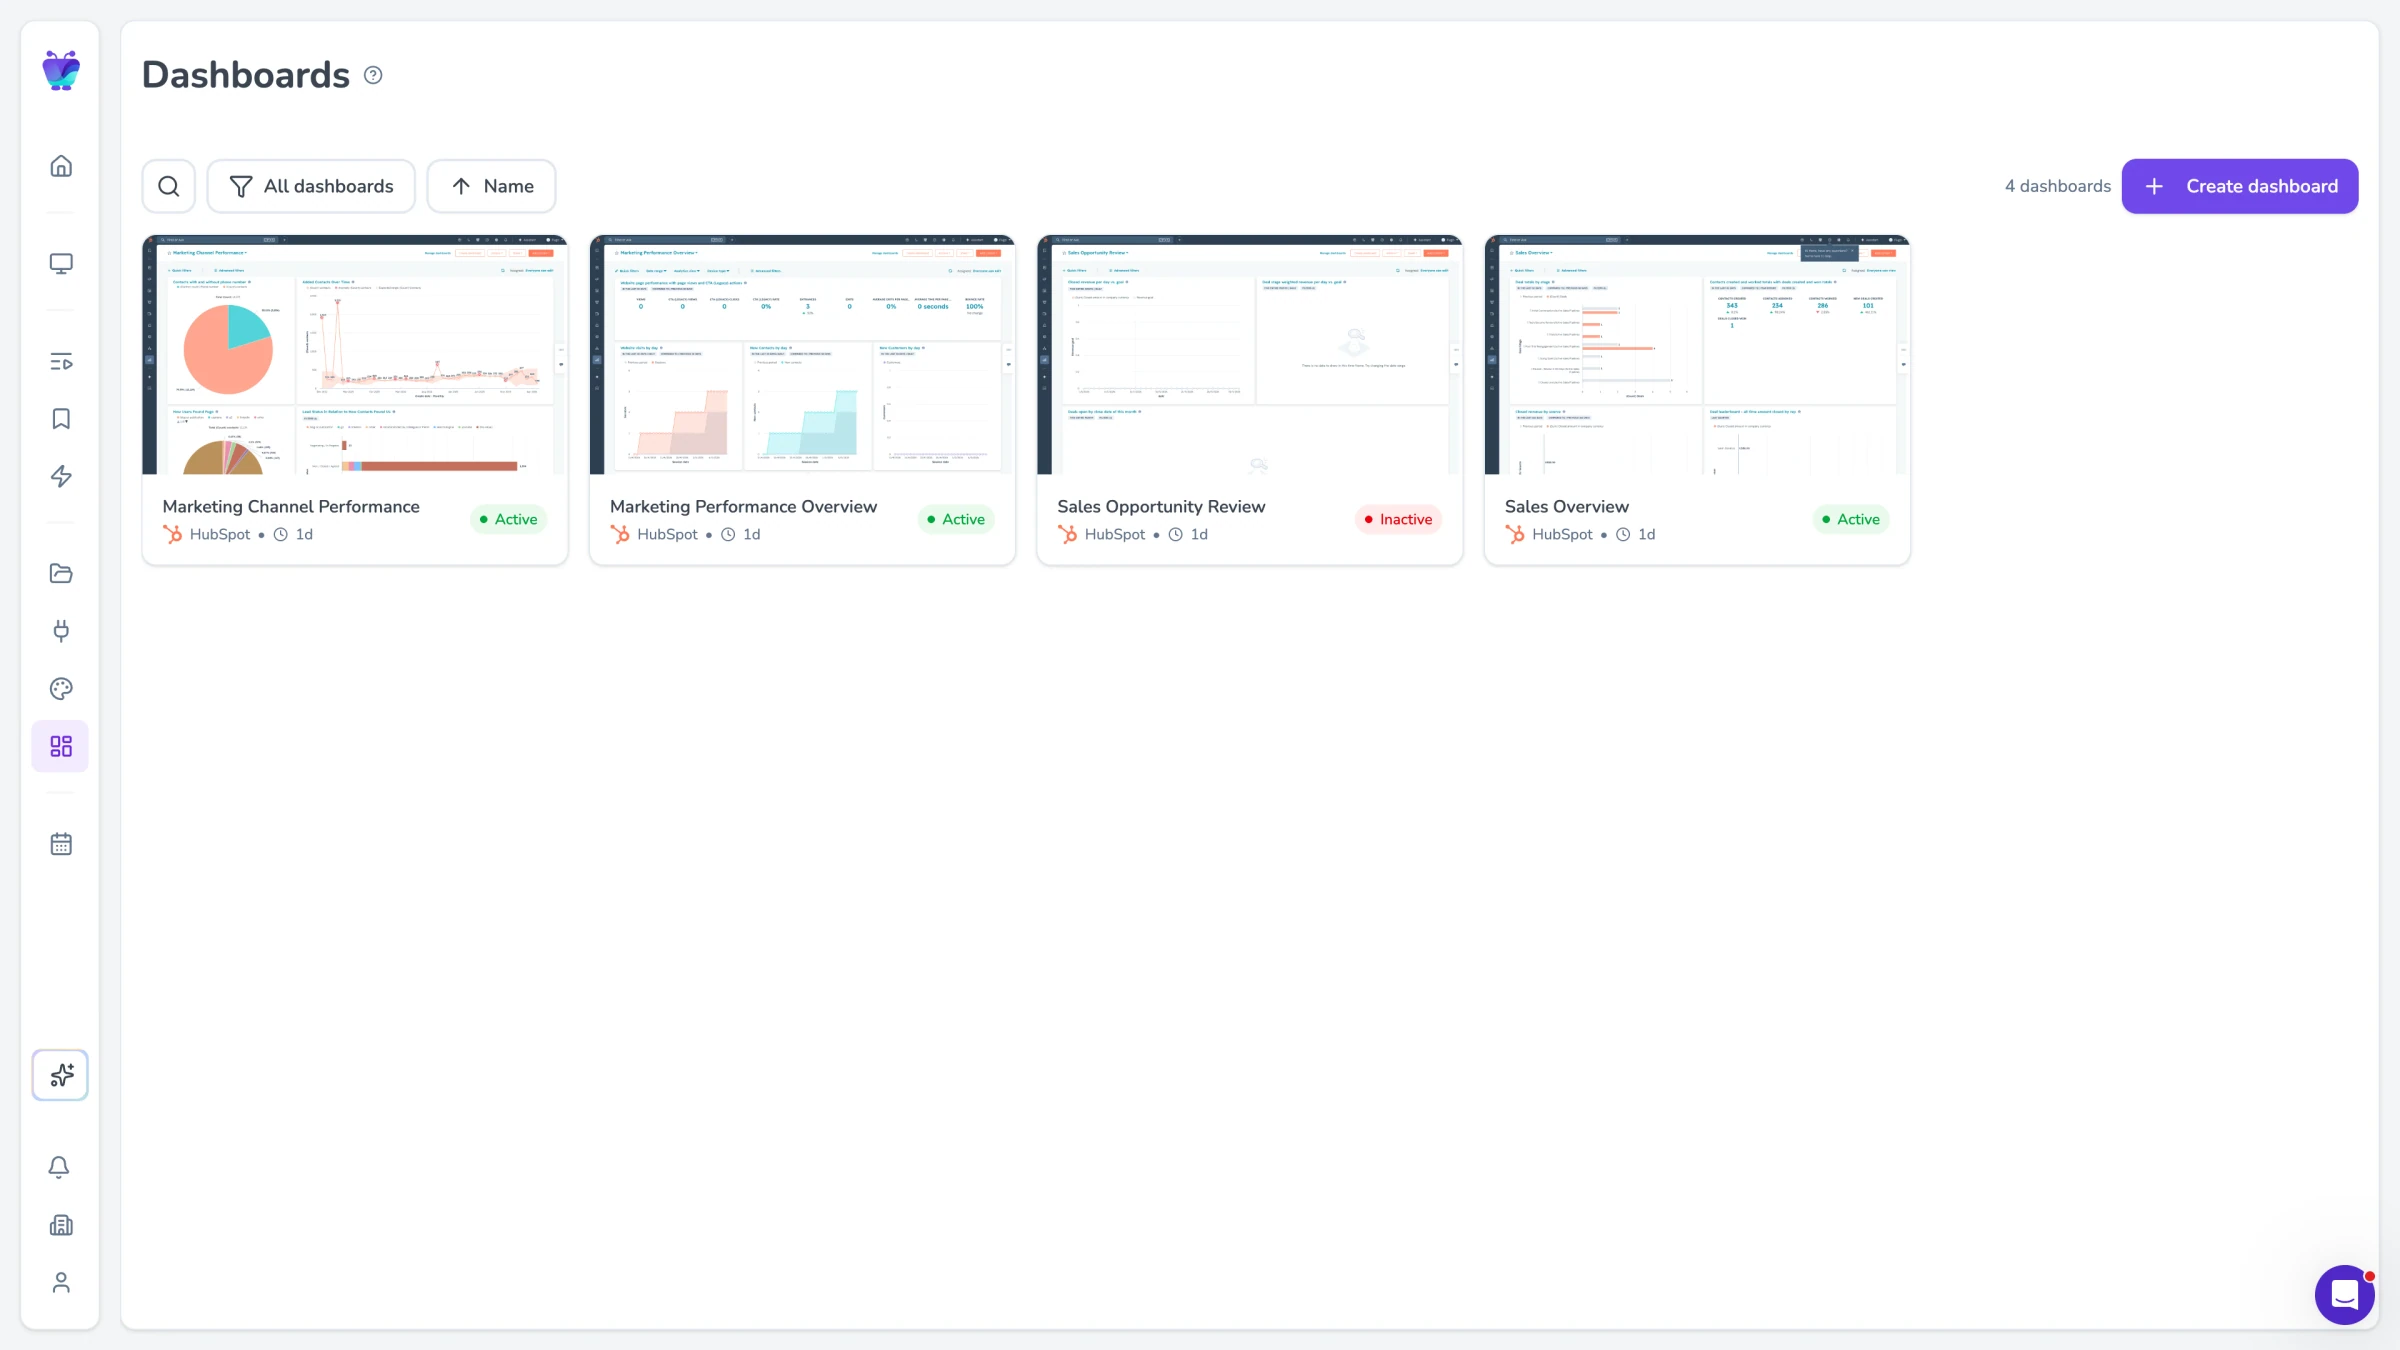
Display dashboards from Zendesk, Five9, Genesys, or any contact center tool with web-based reporting. Fugo shows whatever your dashboard shows.
Explore TV dashboards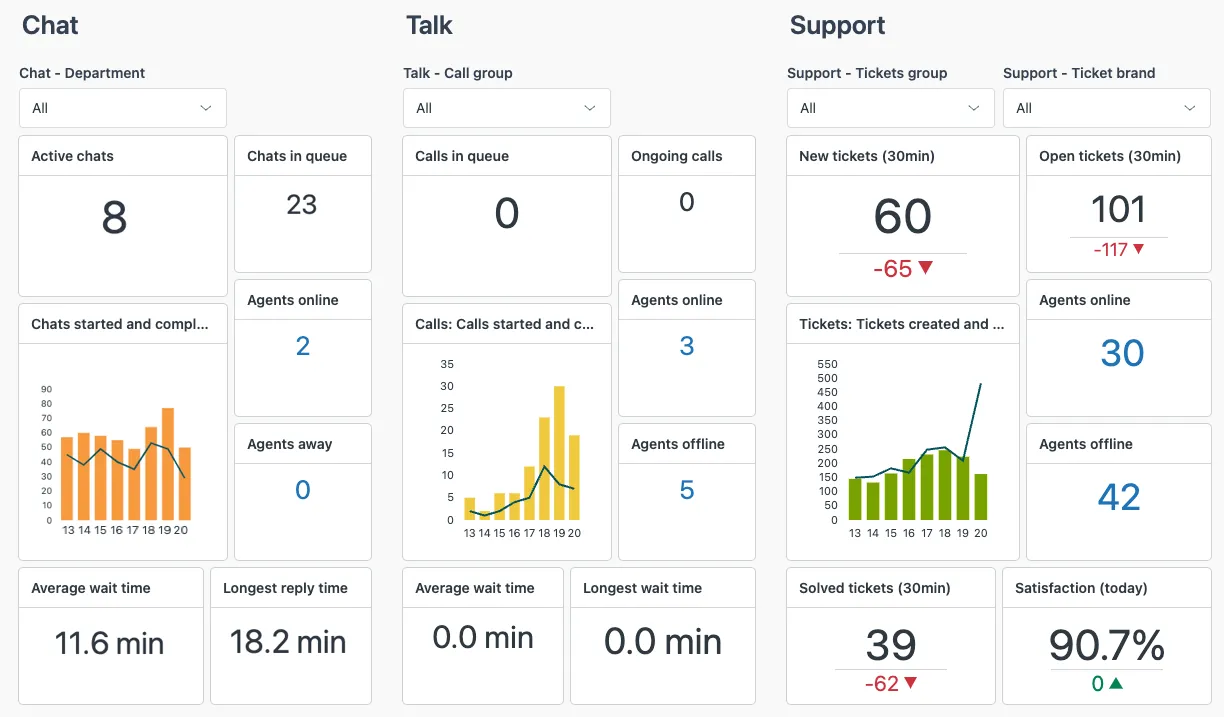
Zendesk dashboards
Connect Zendesk Explore dashboards directly. Show ticket queues, agent workload, and satisfaction metrics on shared screens.
Explore Zendesk dashboards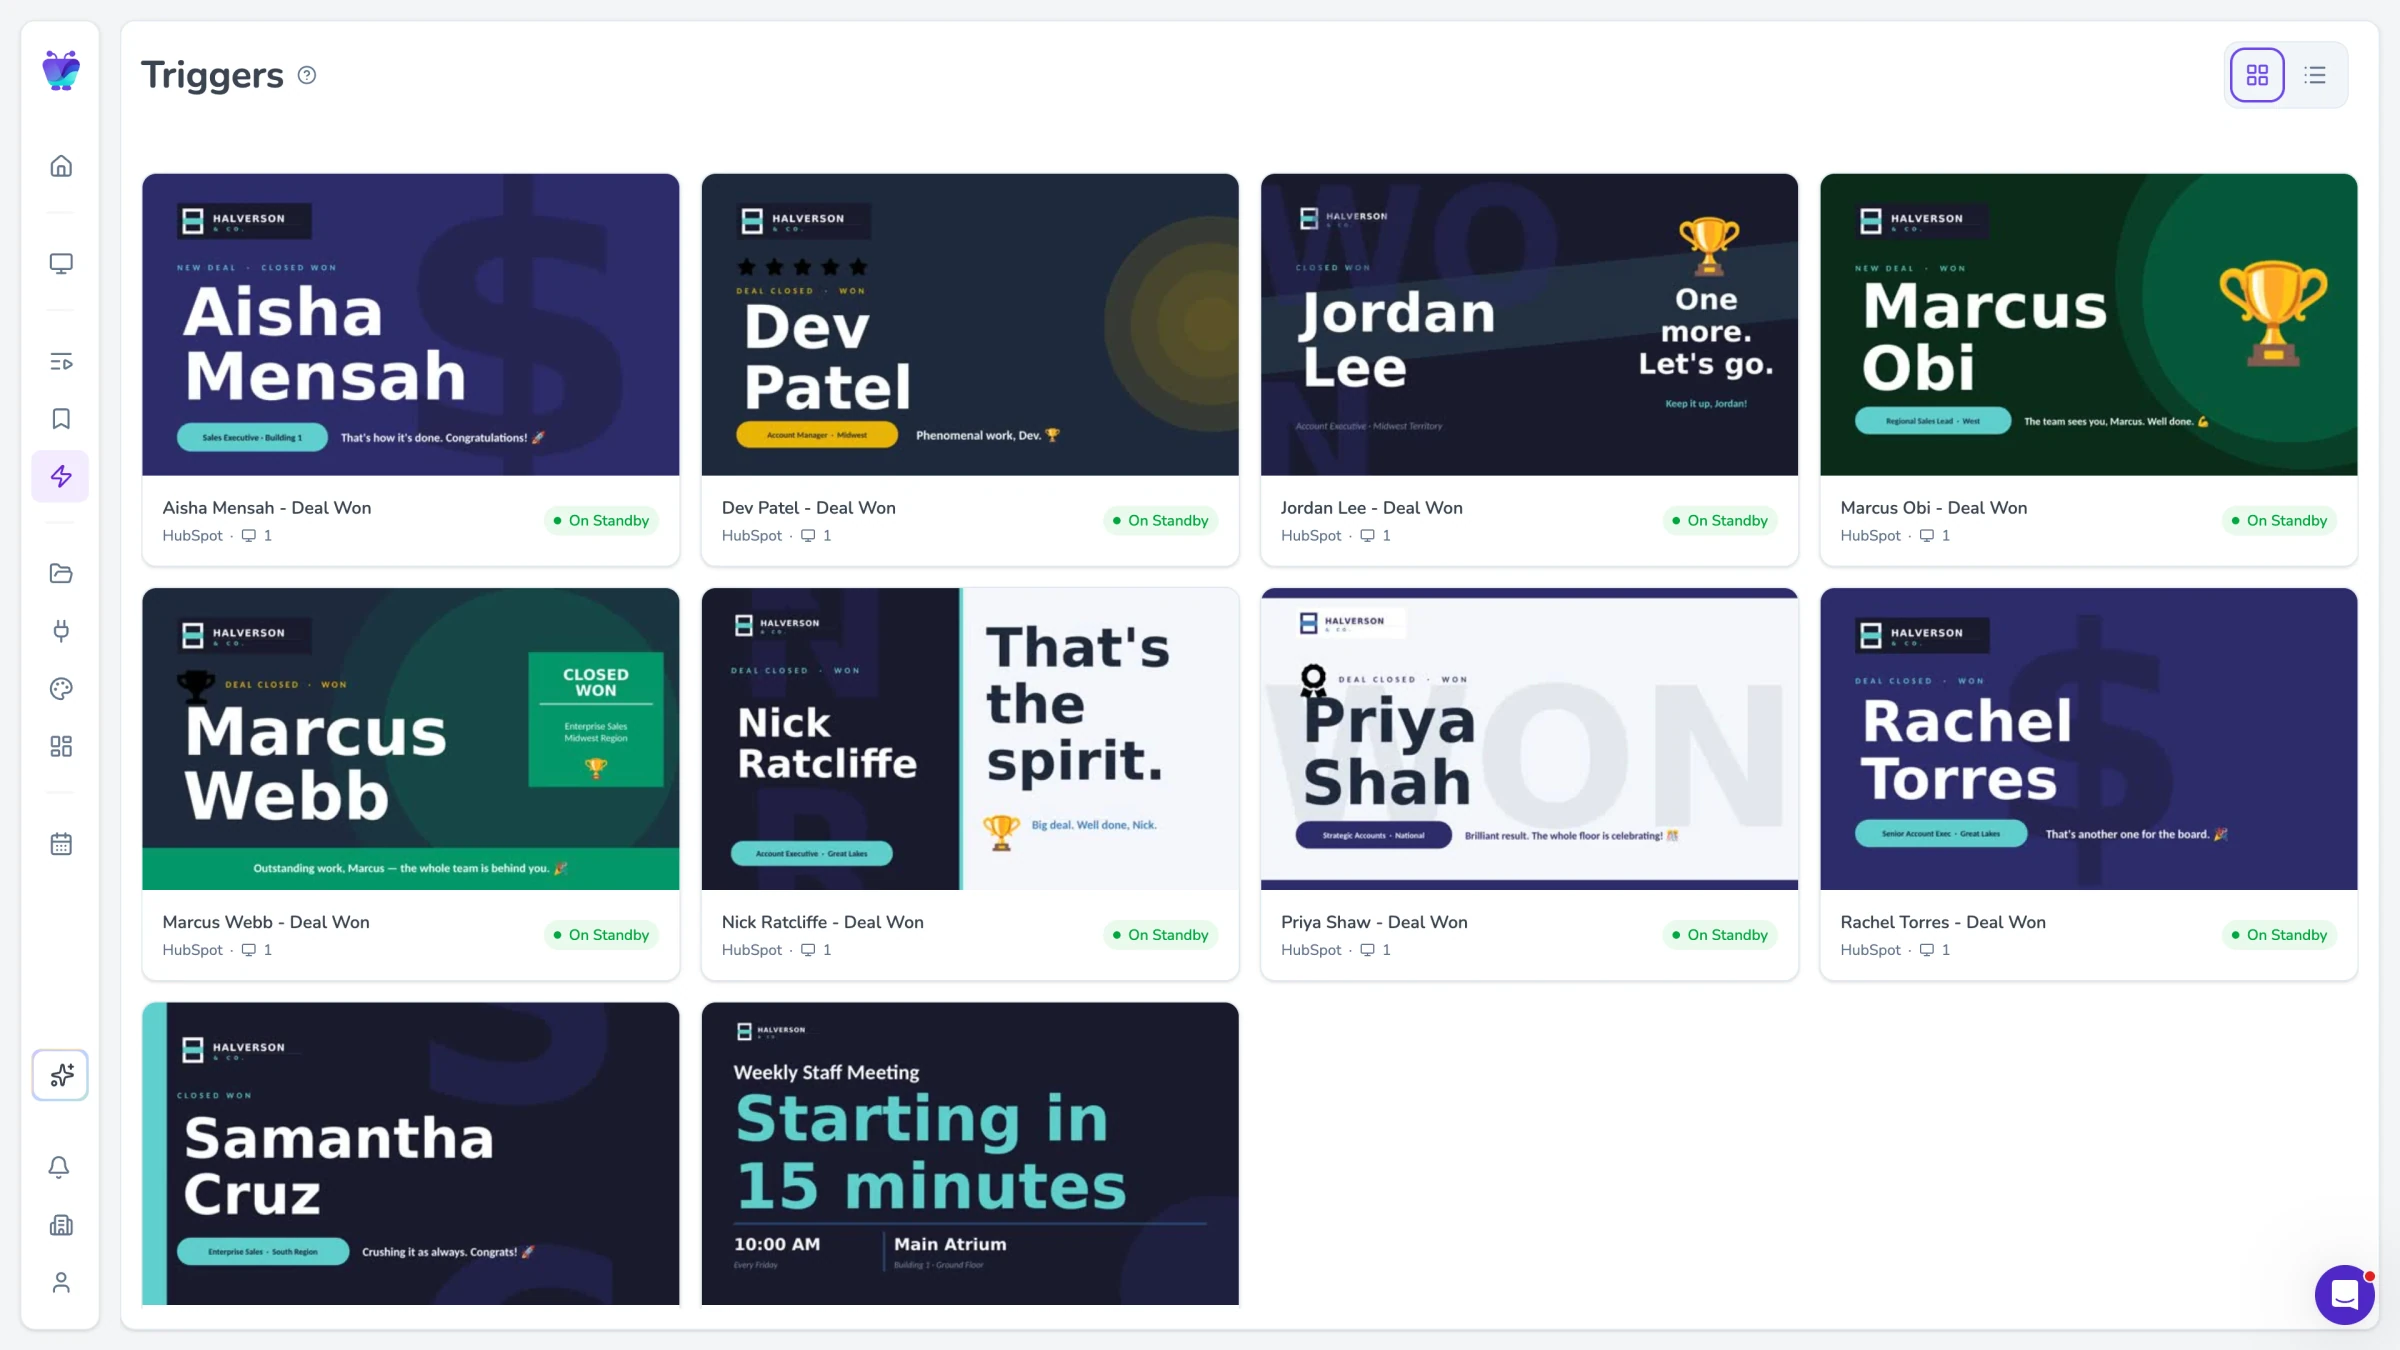
Content triggers
Automatically switch screen content based on conditions. Show an alert layout when queue depth exceeds a threshold, then return to normal when it clears.
See content triggers
Design Studio
Build custom layouts that combine multiple data sources on one screen. Put queue metrics next to agent leaderboards or SLA gauges next to announcements.
Explore Design Studio