


They say that sales is a numbers game — but "they" don't know the half of it.
Between calls, emails, meetings, follow-ups, and deals in every stage of your pipeline, there are quite literally hundreds of sales metrics to balance all at once.
But take a deep breath: you don’t have to track every metric under the sun. A handful of KPIs can give you a clear picture of your team’s performance, without making your eyes glaze over or your team lead fall asleep during meetings.
Whether you're a sales manager, a team lead, or a sales rep looking to grow, this guide will show you 29 sales KPIs (plus some sales KPI dashboards) to help you make informed decisions.
First: what's a sales key performance indicator anyway?
Key performance indicators (KPIs) are numbers that signify the progress of your sales team toward larger business goals. These could be related to your sales strategies, like higher average revenue, more qualified leads, or shorter sales cycles. Or, they could be related to larger business goals. These might be higher company revenue, more new customers, or more new paying customers (depending on where you're at).
To put it another way: sales KPIs measure the progress of your business performance, plus your sales teams' ability to help along the way.
They exist to help you earmark "sustainable business growth" and the progress you're making toward your goals.
So what on earth's the difference between a KPI and a sales metric?
Both of them are numbers, sure, but it goes a bit deeper than that.
A sales metric is any number you can track: think calls made, emails sent, deals in the pipeline. A KPI, on the other hand, is a metric that directly ties to your business goals. So if your business goal is achieving 50% faster sales, metrics like sales pipeline, sales revenue, and average sales cycle length will be important to help you keep tabs on your progress.
All KPIs are metrics, but not all metrics are KPIs. If it helps you track progress toward a major goal, it's probably a metric. If it's the culmination of your sales activities and a major organizational goal, it's likely a sales key performance indicator.
💡Pro Tip: Fugo connects directly with BI platforms and customer relationship management software so you can display sales KPIs online or on TVs.
29 essential sales KPIs (with examples)
We've gathered up 29 of the best sales KPIs to help you measure the impact of sales strategies and boost the performance of your sales team over time.
Each KPI is broken down into a simple subcategory so you can pick and choose the metrics that are right for you.
P.S., having trouble picking the right metrics? Just scroll to the section covering how to choose the right sales KPIs.
Activity KPIs
Activity KPIs are all about "boots-on-the-ground" performance and sales productivity. They're particularly useful to sales reps and sales managers wanting to set daily quotas and measure targets for groups, teams, and individuals.
1. Number of calls made
You can probably guess what this sales KPI is: the number of calls made for outbound sales activities. It measures how aggressively your sales team is reaching out to leads and engaging potential customers over the phone.
Tracking the number of calls made can help with activity tracking, pipeline building, and evaluating sales rep effort. It's especially useful for teams focused on lead generation and top-of-funnel activity.
You can calculate the number of calls made by tallying up the total number of outbound calls made by a rep or team during a specific period (day, week, or month). Most business phone services can help you run the numbers automatically.
If your call volume is low, consider setting daily or weekly call targets. You can also purchase CRM or calling tools to make dialing easier. Just make sure your reps aren’t spending too much time on administrative tasks instead of calls — see if you can find other ways to make their lives easier.
2. Emails sent
This one’s also pretty straightforward: it tracks the number of outbound emails your sales team sends. It's a useful metric for teams relying on cold emailing or nurturing leads, since it measures how consistently your reps are reaching out to leads and/or if you're staying top-of-mind with prospects.
You can calculate emails sent by adding up the total number of outbound emails sent by a rep or team during a specific time frame. Good news: most CRM platforms automatically track this for you so you don’t have to do any manual counting.
Is your email volume low? Again, try setting daily or weekly outreach targets. You can also use email automation or templates to help reps send messages faster, while still keeping them personalized. Plus, make sure reps aren’t spending excessive time manually drafting every email. Small workflow improvements can make a big difference.
3. Meetings booked
Think of this KPI as the bridge between prospecting and your actual pipeline. Calculating the number of meetings booked measures how successful your reps are at turning outreach (calls or emails) into scheduled conversations with prospects.
So you can probably figure out how to calculate this one — by counting the total number of new meetings scheduled by a rep or team within a given period. Again, many CRM systems and calendar tools will track this automatically.
If your meeting volume is low, you might review how your reps are pitching meetings. You can try refining scripts, offering more convenient time slots, or using scheduling tools that eliminate back-and-forth emails.
4. Follow-up rate
Follow-up rate measures the percentage of leads that receive follow-ups after initial contact. It's best for personalized sales processes where you may need multiple touchpoints to close a deal (i.e., B2B sales). High follow-up rates indicate your reps are being persistent about nurturing leads toward conversion.
To calculate your follow-up rate, use the following formula:
Follow-Up Rate = (Number of leads contacted more than once / Total leads) × 100
Want your follow-up rates to be higher? Consider setting reminders or automated follow-up sequences in your CRM. You may also look into training reps on timing and messaging, which helps improve persistence without annoying prospects.
5. Response rate
Response rate tracks how often prospects engage with your outreach — like whether they reply to emails, answer calls, or respond via other channels. It’s a key indicator of outreach quality and relevance. Plus, it helps show positive sales performance, making it one of the best sales KPIs for leaders and managers.
You can calculate your response rate with this simple formula:
Response Rate = Number of responses received / Number of outreach attempts × 100
If your response rate is low, you can try testing different messaging, subject lines, or outreach times. Then, make sure your reps are personalizing communications and reaching out to the right audience.
If numbers are abysmal, take a closer look at your tech stack. Could there be something going wrong, like a broken automation, or an email campaign achieved as spam?
Performance KPIs
6. Lead-to-opportunity conversion rate
Lead-to-opportunity conversion rate measures what percentage of your leads turn into qualified opportunities. In other words, it measures how effectively your team moves prospects from the top of the funnel into middle or bottom pipeline stages.
To calculate it, try the following formula:
Lead-to-Opportunity Conversion Rate = Number of leads that became opportunities / Total number of leads × 10
Review your lead qualification process if your conversion rate is low. Are reps spending time on unqualified leads? Could your lead scoring be improved?
7. Opportunity win rate
Opportunity win rate tracks the percentage of opportunities that actually close as deals. It’s a direct measure of sales effectiveness, and one of the clearest indicators of your team’s ability to seal the deal. This makes it one of the best KPIs for tracking sales performance, rep progress, and the healthiness of your sales pipeline.
To calculate it:
Win Rate = Number of closed-won opportunities / Total number of opportunities × 100
Don't like your win rate? Take a closer look at your sales process. You can consider more training, improved messaging, or even revisiting pricing strategies to increase the likelihood of closing.
8. Average deal size
Average deal size is commonly referred to as "mean revenue per closed deal." In other words, it measures the average amount of revenue you generate per closed deal — which is best for gauging the value of your deals and guiding future forecasts and sales strategies.
The quick 'n dirty calculation is as follows:
Average Deal Size = Total revenue from closed deals / number of closed deals
If your average deal size is smaller than expected, try upselling, cross-selling, or targeting higher-value prospects. Reviewing deal structuring and packaging can also help increase the typical revenue per deal without increasing sales volume (unless you want that, too).
We'll cover more about sales volume later in the guide. 😉
9. Pipeline value
Pipeline value measures the total potential deal value in your sales pipeline. Think of it as the sum of all opportunities you’re currently tracking — the perfect snapshot of potential revenue waiting to close. You'll likely need this number for forecasting sales targets, although it's also a great indication of whether your sales efforts are paying off.
To calculate it:
Pipeline Value = add the sum of all deal values in the pipeline
💡 Pro Tip: Most sales analytics software will calculate this on your behalf.
If your pipeline value doesn't meet specific industry benchmarks, it's time to dig into your lead generation efforts. Are there enough qualified leads entering your funnel? Do you need pipeline expansion strategies, better lead qualification, or revamped outreach strategies?
10. Sales cycle length
Sales cycle length tracks the average time it takes for your sales team to close a deal, from first contact to final signature. It’s key for understanding how efficiently your team is moving deals and managing expectations around how long it'll take to close (looking at you, sales leaders).
Here's a fast formula for you:
Sales Cycle Length = sum of days to close each deal / Number of closed deals
Your sales cycle length is completely depending on your industry. But if numbers look bleak, start looking for the bottlenecks. It might be that approvals are taking too long, or that prospects hesitate later in the sales cycle.
To combat this, you can:
- Streamline internal processes
- Improve sales messaging
- Provide reps with tools to keep deals moving faster, like Gong
11. Opportunity age
Speaking of deals that are "taking too long," opportunity age measures how long deals stay open before finally reaching the finish line (aka closing). It’s particularly useful for spotting slow-moving deals and identifying where prospects might need extra TLC.
The formula for opportunity age is:
Opportunity Age = date of close − date the opportunity was created
So if a prospect closes on October 17 and said opportunity was created on January 1, the opportunity age will be a little over 10 months.
If your opportunities are aging too much, consider reviewing follow-up frequency, nurturing strategy, or whether deals are truly qualified. Stale deals that stall out or have trouble closing may need re-engagement or re-evaluation from your sales leaders.
12. Monthly recurring revenue (MRR)
MRR tracks how much consistent revenue you're generating each month from existing customers. That makes it one of the best KPIs for getting a predictable view of your cash flow. It’s particularly helpful for subscription-based businesses or SaaS companies, but it can technically be adapted to any recurring sales model.
To calculate MRR:
MRR = Number of paying customers × average revenue per customer per month
If your MRR growth is low and/or slow, you should consider ways to increase subscription uptake or reduce churn. Upselling, cross-selling, and retention strategies all play a big role in boosting monthly recurring revenue.
13. Quota attainment
Quota attainment measures the percentage of a sales target achieved by a rep or team. In other words, it tells you how close your salespeople are to hitting their goals. It's the ultimate reality check for sales performance.
To calculate quota attainment:
Quota Attainment = total sales ÷ quota × 100
If your quota attainment is lagging, check whether quotas are realistic, review territory assignments, and see if reps have the right resources. Coaching, sales enablement, and better prospecting can all help you bring those numbers up.

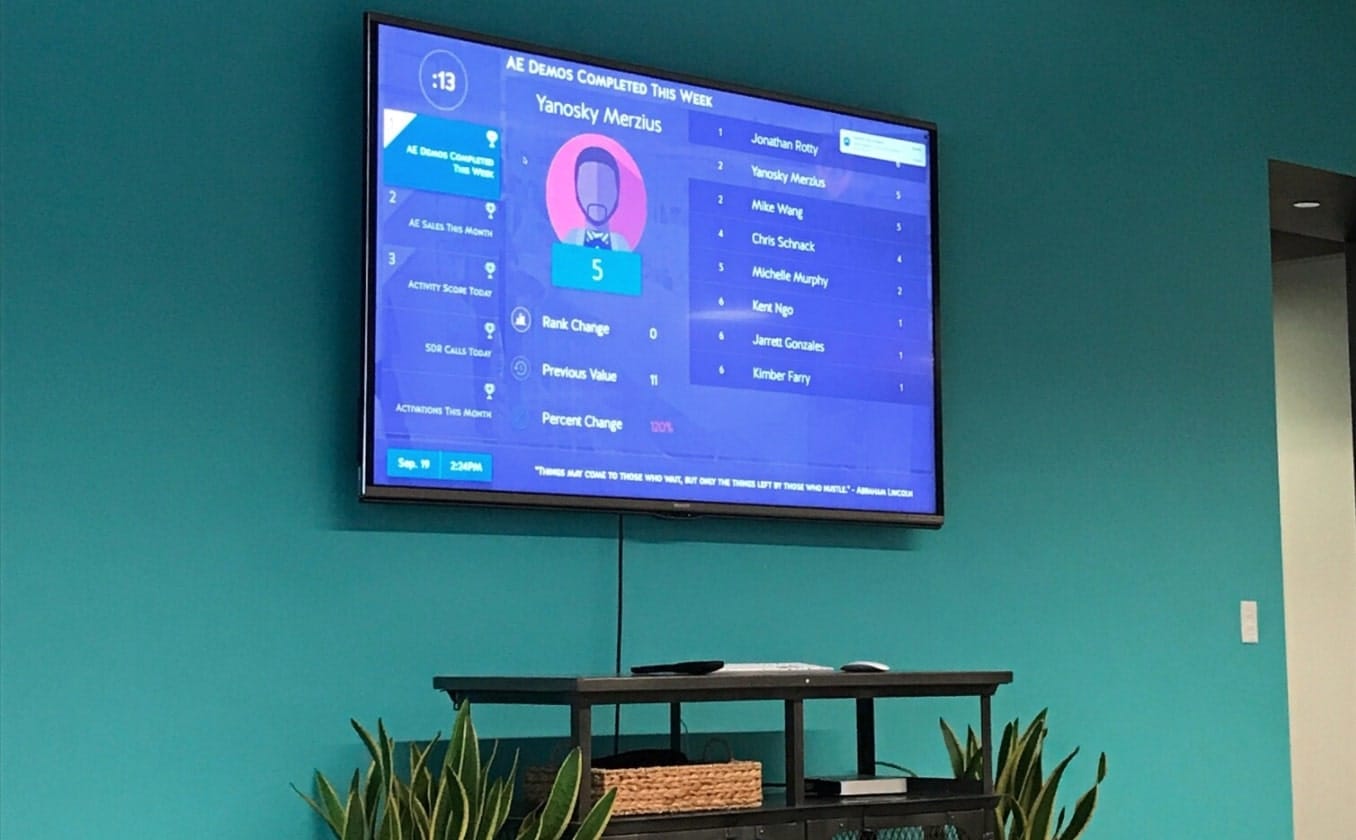
14. Revenue per rep
Revenue per rep measures — you guessed it! — how much revenue each sales rep generates over a given period. It’s a powerful KPI that's best for seeing who’s contributing most to your bottom line, and who needs more opportunities for training and improvement.
Quick formula:
Revenue per Rep = total revenue ÷ number of reps
You can also use hyper-specific sales software to calculate individual revenue contributions. Like this sales team leaderboard, for example:
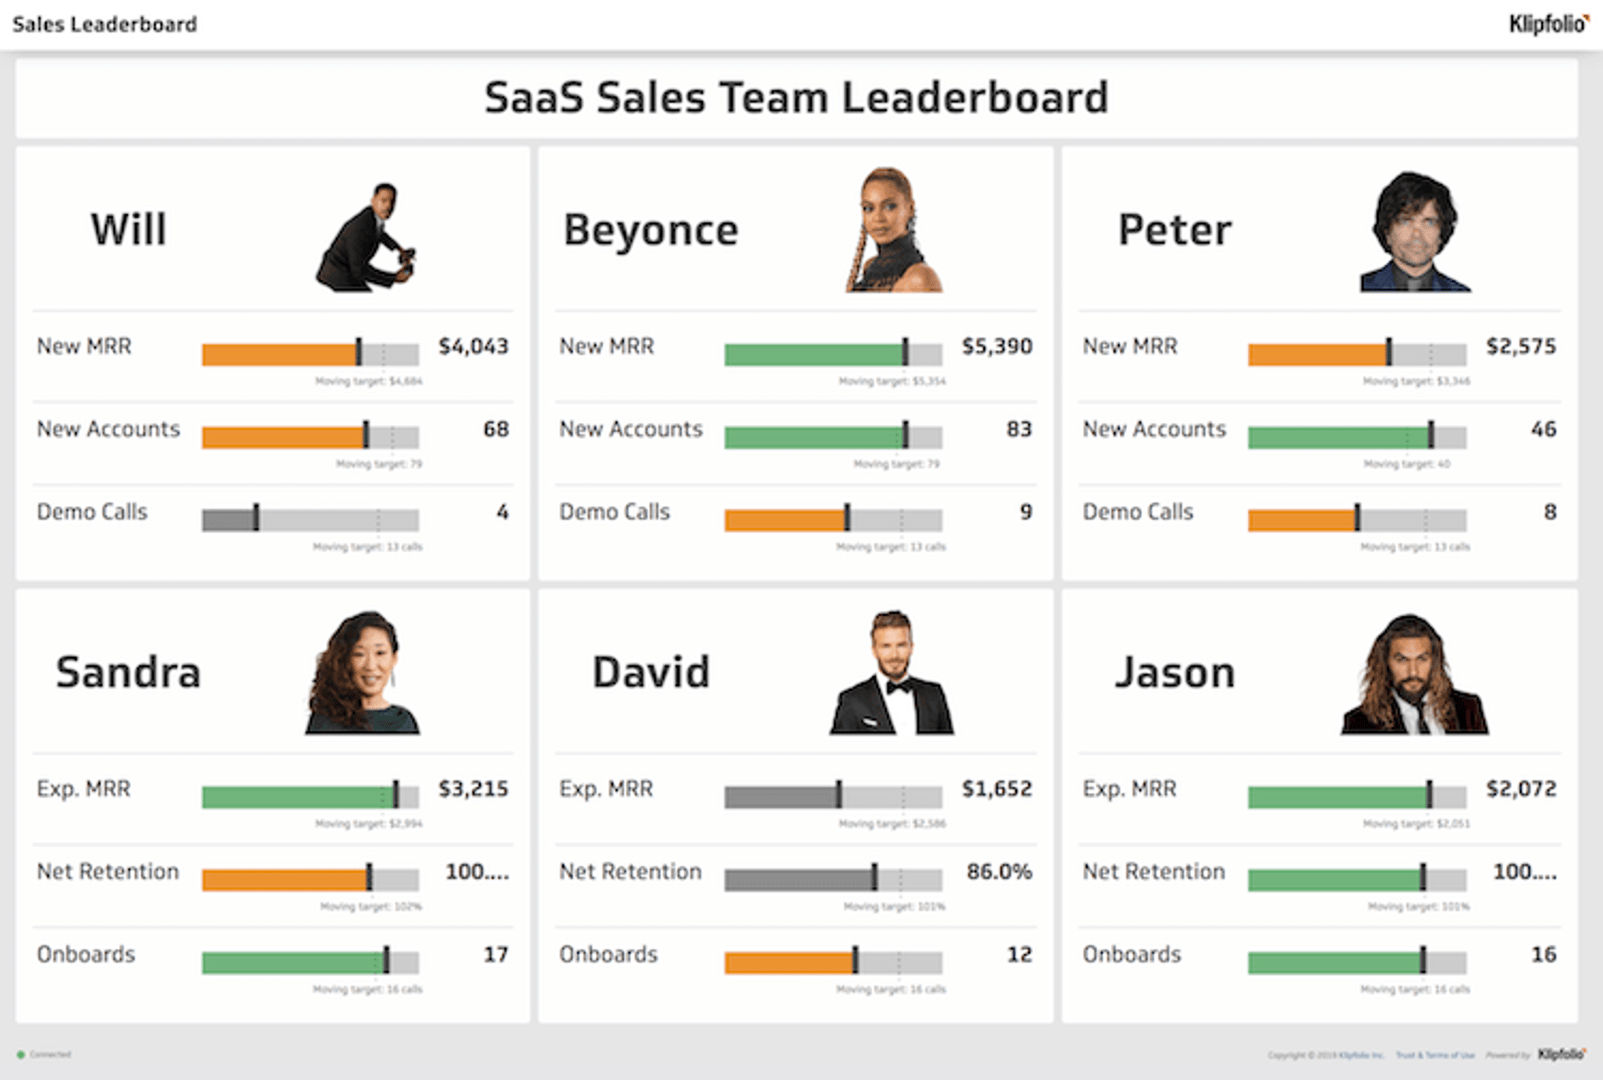
Low numbers here might mean uneven territories, underperforming reps, or deals taking longer than expected to close. If you notice rough numbers, you might consider redistributing leads, finding additional training, or investing in process improvements.
15. Customer acquisition cost (CAC)
CAC tracks how much it costs your business to acquire a new customer, including marketing, advertising, and outbound sales expenses. Knowing this KPI helps you see whether your growth is sustainable, or if the cost of new customers is too high to manage.
Grab the formula here:
CAC = Total cost of acquiring customers in a time period ÷ Number of new customers acquired
If CAC is too high for comfort, take a closer look at where your money is going. Perhaps your marketing targeting could be refined, or your sales process is too long or resource-intensive. Don't think you can be objective? Gather up your sales reps and have a heart-to-heart convo.
16. Customer lifetime value (CLV or LTV)
Customer lifetime value, or CLV, calculates the total revenue expected per customer. This KPI is best for financial planning, sales forecasting, and talking to investors about getting more funding.
You can track average customer lifetime value (ACLV) with the following formula:
(Average purchase value per year) x (average number of purchases per year per customer) x (average years of customer lifespan) = Customer lifetime value
If your numbers look low, consider other strategies like upselling and cross-selling. Rewards programs, follow-ups, and personalized marketing campaigns can also help.
17. Sales growth rate
Your sales growth rate tracks the percentage increase or decrease in revenue over whatever time period you specify. This KPI is excellent for spotting trends, understanding seasonality, and seeing whether your business is on the up-and-up (or, uh, the down-and-down).
The formula for sales growth is:
Sales Growth Rate = (Current period revenue − Previous period revenue) ÷ Previous period revenue × 100
If growth is stagnant or negative, look at what’s happening upstream: product-market fit, marketing effectiveness, sales efficiency, and pricing strategies can all impact revenue growth.
Don't be afraid to be brutal about facing inefficient sales processes and looking for opportunities to support revenue growth for the whole team.
Pipeline KPIs
18. Quota attainment
Quota attainment is the percentage of a sales target achieved by a rep or team. Or, in more straightforward terms, it tells you whether your team is hitting its goals or if targets are getting missed.
So what's the difference between quota attainment and something like "calls per week" or "emails per month?" For one thing, it measures the complete progress of your sales team as a unit. For another, it can help you get a better idea of whether you're in a slump or tough economy... or if you've set unrealistic goals for your team.
You can use the following formula for your entire sales team:
Quota Attainment = Total sales ÷ Quota × 100
Low attainment? As mentioned earlier, check if your quotas are realistic and achievable. Then, evaluate territory assignments, rep coaching, and resources.
Customer Retention and Relationship KPIs
These aren't necessarily a measure of sales per se, but they can still help you measure the quality of leads and closed deals. If customers are unhappy, dissatisfied, and choose to churn relatively quickly, you may need to look closer at whether you're targeting the right people.
19. Renewal rate
Renewal rate is exactly what you think it is: the percentage of existing customers who renew or repurchase. You may also have heard this called "customer retention rate." It's basically the opposite of your customer churn rate — the number of customers who leave your business after a fairly short period of time.
For subscription or repeat-sale businesses, this KPI shows how well you’re keeping customers engaged and satisfied. It's also a great measure of how well your sales team does with
You can calculate your customer renewal rate with the following formula:
Renewal Rate = (Number of renewals ÷ Number of customers up for renewal) × 100
Don't love your renewal rates? Focus on improving the customer experience. This might be offering incentives and/or maintaining communication throughout the subscription period. Remember: preventative strategies often outperform reactive ones. If you
20. Upsell / cross-sell rate
We've talked quite a lot about upselling and cross-selling here. So it should come as no surprise that we're finally talking about your upsell/cross-sell rate: which measures how often existing customers buy additional products or upgrades. This is a phenomenal KPI for spotting opportunities to maximize customer value without forcing your sales team to acquire new leads.
Formula here:
Upsell / Cross-sell Rate = (Number of customers who purchased additional products ÷ Total customers) × 100
Not every customer needs an upsell or cross-sell, but it should still be a healthy percentage of your total sales. If your numbers are low, look at whether your reps are trained to identify opportunities, whether customers know about available products, and if incentives are aligned.
21. Net promoter score (NPS)
NPS gauges customer satisfaction and loyalty by asking how likely customers are to recommend your business to others. It’s an easy-to-understand measure of overall sentiment. It can also signal growth potential — making it a great KPI for measuring what comes after the sale.
The easiest way to calculate customer satisfaction scores is as follows:
NPS = % Promoters − % Detractors
Low NPS? Find out why customers aren’t happy. Surveys, follow-ups, and direct conversations can uncover pain points. Plus, improving product quality, support, or onboarding can help turn detractors into promoters.
Forecasting and Efficiency KPIs
Ahh, forecasting: the bane of every sales manager ever. While we can't promise you sales KPI examples will make you a wizard at reading the "sales funnel tea leaves," they will help you gather valuable insights about net sales, average sales cycle lengths, and new sales opportunities.
22. Forecast accuracy
Forecast accuracy measures how closely your projected sales align with actual results. It’s a great KPI for evaluating whether your sales projections are realistic (and also whether your pipeline is healthy).
Here's the formula for reference:
Forecast Accuracy = (Actual Sales ÷ Forecasted Sales) × 100
If your accuracy is off, dig into the why. Are your forecasts based on outdated assumptions, overly optimistic win rates, or inconsistent data? You might improve your numbers by standardizing reporting, reviewing historical trends, and refining (or redefining) deal qualification criteria.
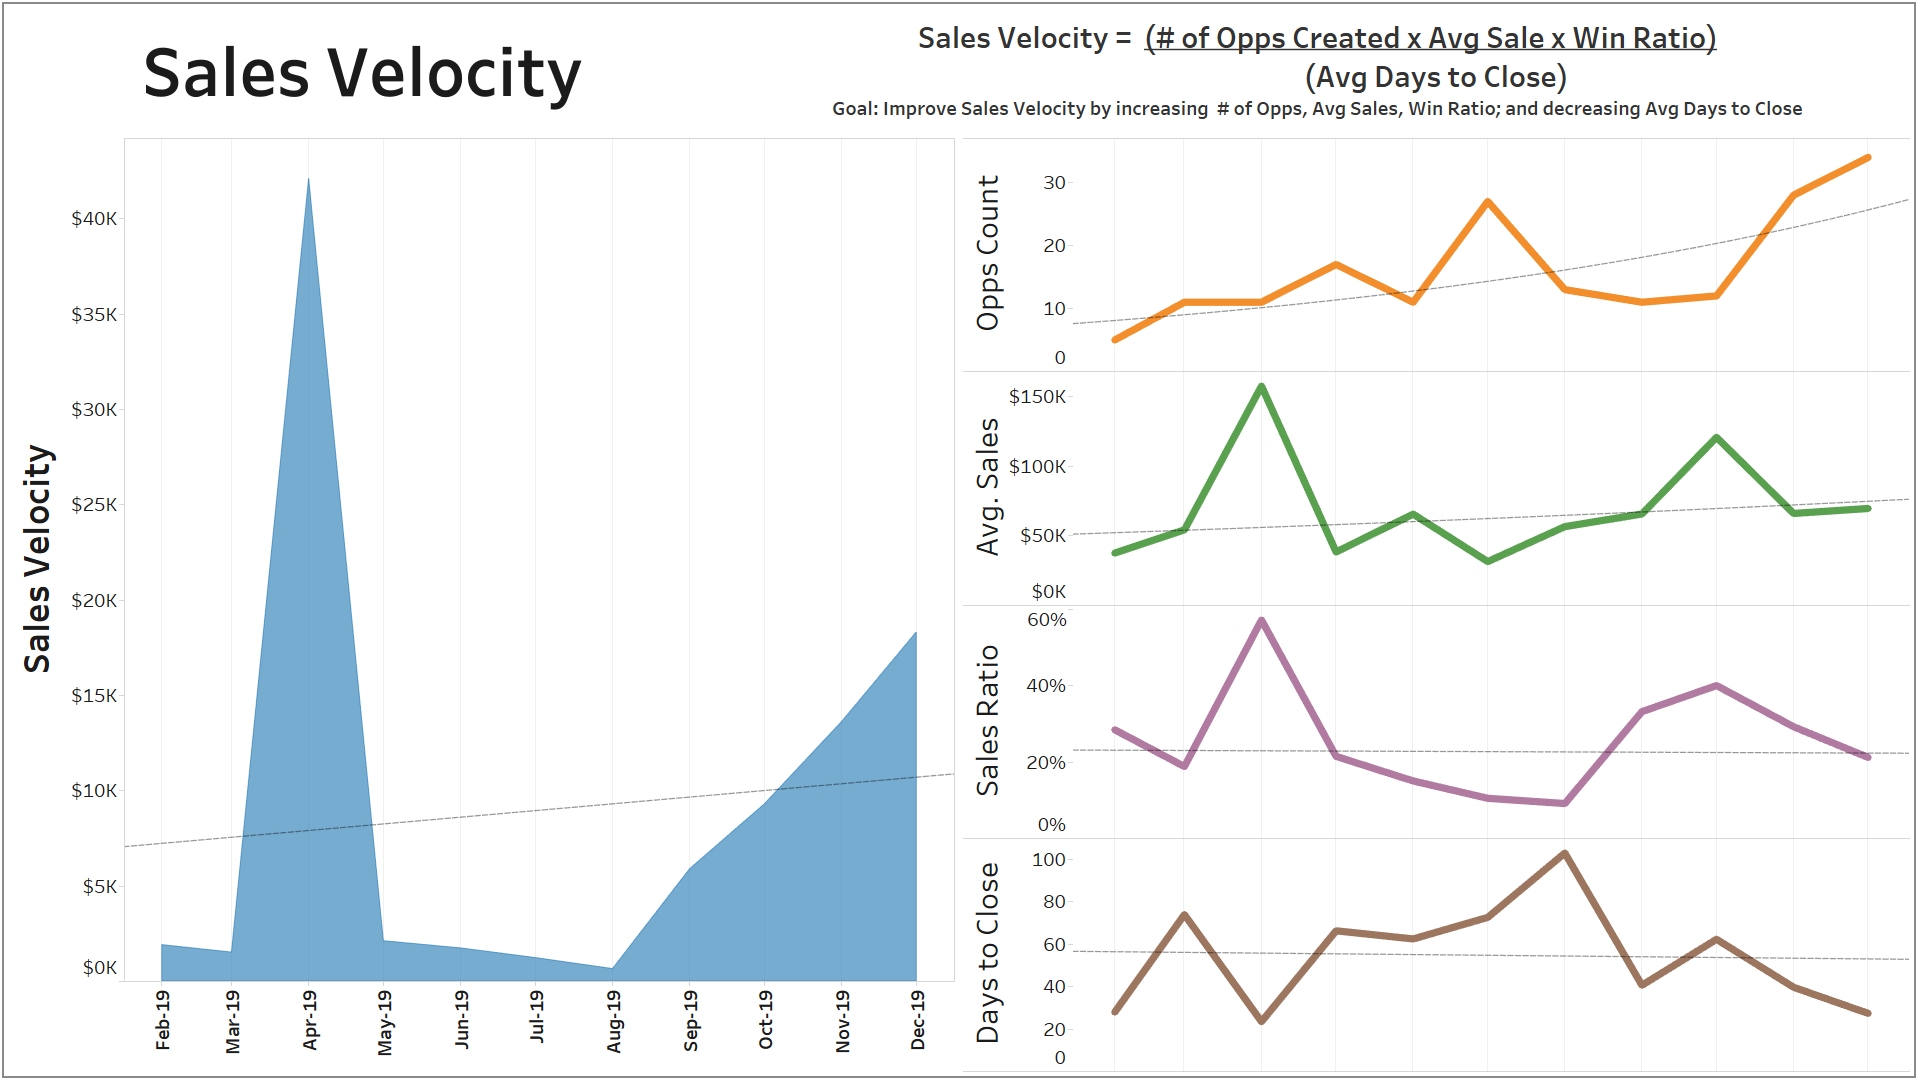
23. Sales velocity
As the name implies, sales velocity tracks how quickly leads move through your pipeline to generate revenue for the business. This KPI is best used for showing the efficiency of your sales team. For example, you can track how often they convert opportunities into cash, or at least spot any bottlenecks that could be lurking in your sales funnel.
Here's a quick formula for calculating the velocity of your sales reps:
Sales Velocity = (Number of Opportunities × Average Deal Size × Win Rate) ÷ Sales Cycle Length
Let's say your sales reps had 50 great opportunities this year worth about $10,000 each. They won 50% of them, although they took 90 days to close. That means your sales velocity would be about $277.78 per day.
If your velocity isn't currently a sustainable number, you might investigate what’s holding your deals back. Maybe prospects are stalling due to long approval processes. Or maybe you have unconvincing messaging and unclear next steps.
Consider streamlining processes, coaching reps on speedier engagement hacks, and giving them tools to keep deals moving faster.
How to choose the right sales KPIs
There's really no such thing as the "best" sales KPIs — only the metrics that make sense for your sales team.
That said, there are a few ways to narrow down which ones to choose. Below are some pointers to help you do just that:
- Does it match your stage of growth?: Start by considering what matters most to your business right now: volume, conversion, deal size, or overall revenue.
- Does it align with your team’s goals?: If your team is focused on growth, track lead generation and pipeline velocity. If you care more about profitability, track average deal size and customer lifetime value.
- Is it practical for your sales team?: A good KPI should tell you what to do next. If tracking it won't help you make decisions about what to do next, it probably doesn't deserve a place on your roster.
- Is it adding one too many KPIs?: As a wise person once said, "less is more." Track a handful of meaningful KPIs rather than dozens of metrics that overwhelm your team. Anywhere from three to five sales KPIs is more than enough. You can also track three to five metrics alongside each KPI.
- Is it leading, or lagging?: Some KPIs are called leading indicators, which means they're designed to show effort (think calls made and emails sent). On the other hand, lagging indicators show results, such as average revenue or win rate. Both types of KPIs are important for sales teams. But the smaller the business, the more lagging indicators you'll want to track. The larger the business, the more lagging indicators you can afford to track.
- Is it easy to measure?: Make sure your KPIs can be tracked reliably over time. Inconsistent sales data makes it impossible to spot trends or improve performance, let alone create a sales KPI dashboard (which we'll cover later on).
- Will it complement your visual dashboards?: You'll want to pick KPIs that appear in a clear, visual format so everyone on your sales team can check their progress in real time.
3 common mistakes in sales KPI tracking
Even the best-intentioned sales teams can stumble when it comes to KPIs. Here are some of the most common pitfalls with sales KPIs, including how to avoid them:
- Tracking too many: As mentioned earlier, it’s tempting to measure everything under the sun. But too many KPIs create noise, confusion, and dashboard fatigue. Instead, stick to a handful of meaningful KPIs and a few supporting metrics. If it's not serving your sales team, feel free to throw it out.
- Misaligned incentives: Your team will naturally optimize to meet goal metrics, even if it hurts your business growth. So you'll want to make sure your KPIs don't reward the wrong behavior. Like sandbagging numbers, for example.
- Poor dashboard hygiene: Outdated, cluttered, or inconsistent dashboards can make even a great KPI completely useless. To combat this, make sure your dashboards are easy to read, updated regularly, and display data that everyone can understand.
Sales KPI dashboard examples for your team
Now that we've talked about tracking sales KPIs, let's look at implementing them for better sales performance.
This usually begins by keeping your KPIs front and center on a dashboard. That way, your most important numbers are easily accessible (and trackable!) for everyone on the team.
Below are several sales KPI dashboard templates you can use to get started, broken down into roles and categories so you can find what you need for each audience.
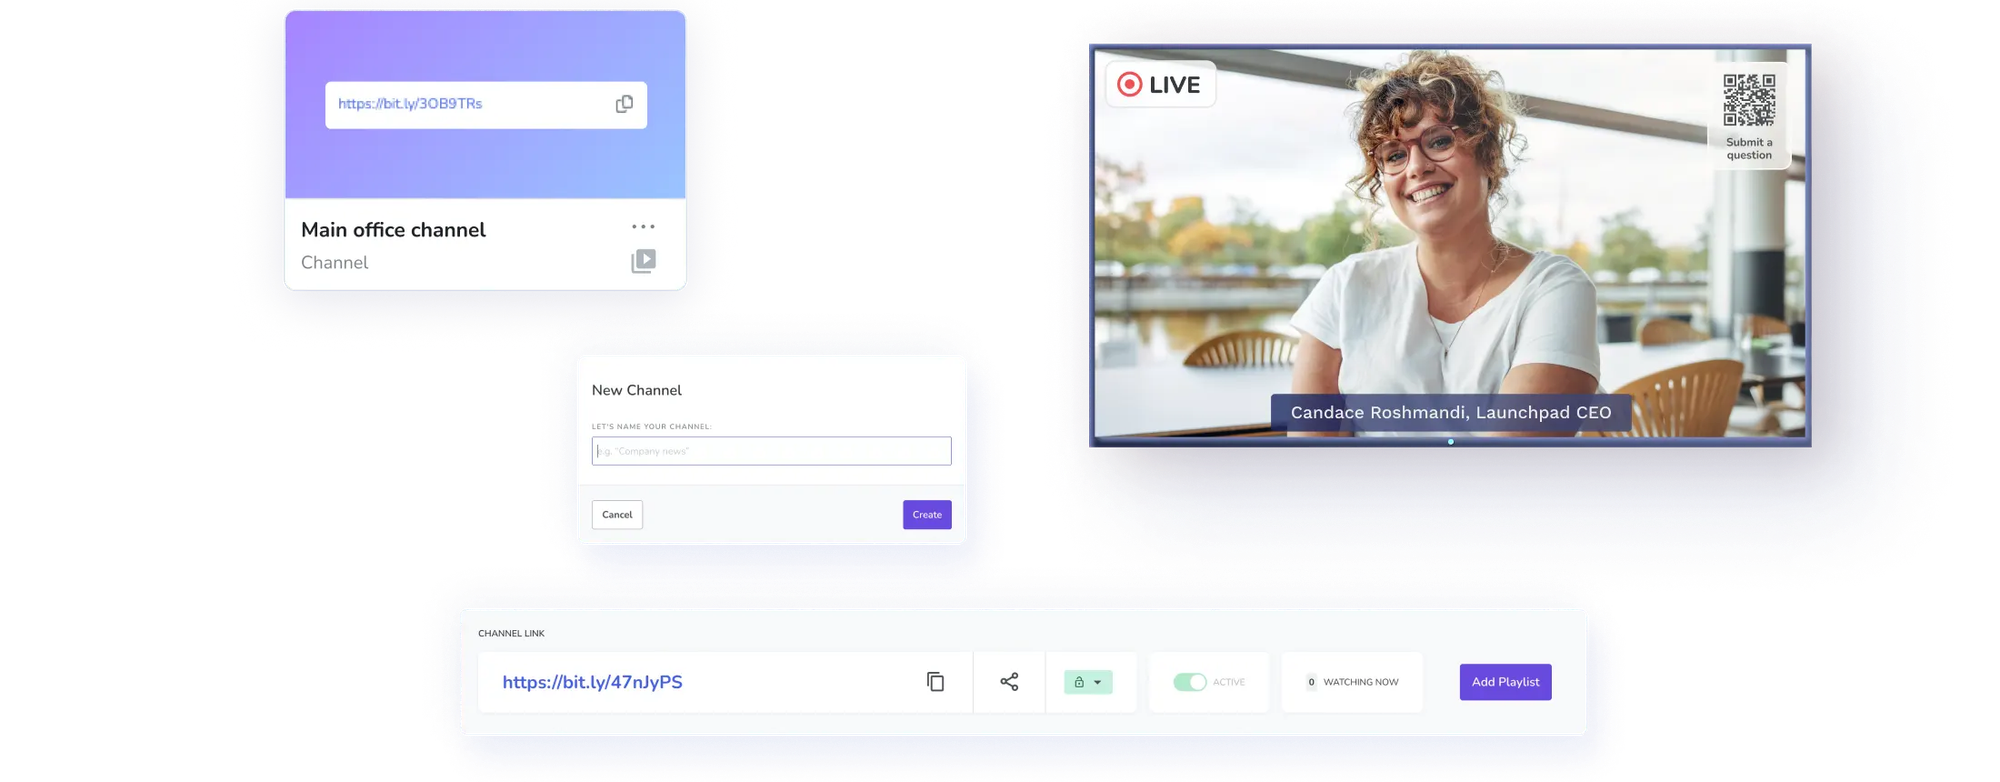
P.S., you can use Fugo to create TV sales KPI dashboards in seconds. For more information, check out our comprehensive guide to TV dashboards.
For chief revenue officers (CROs)
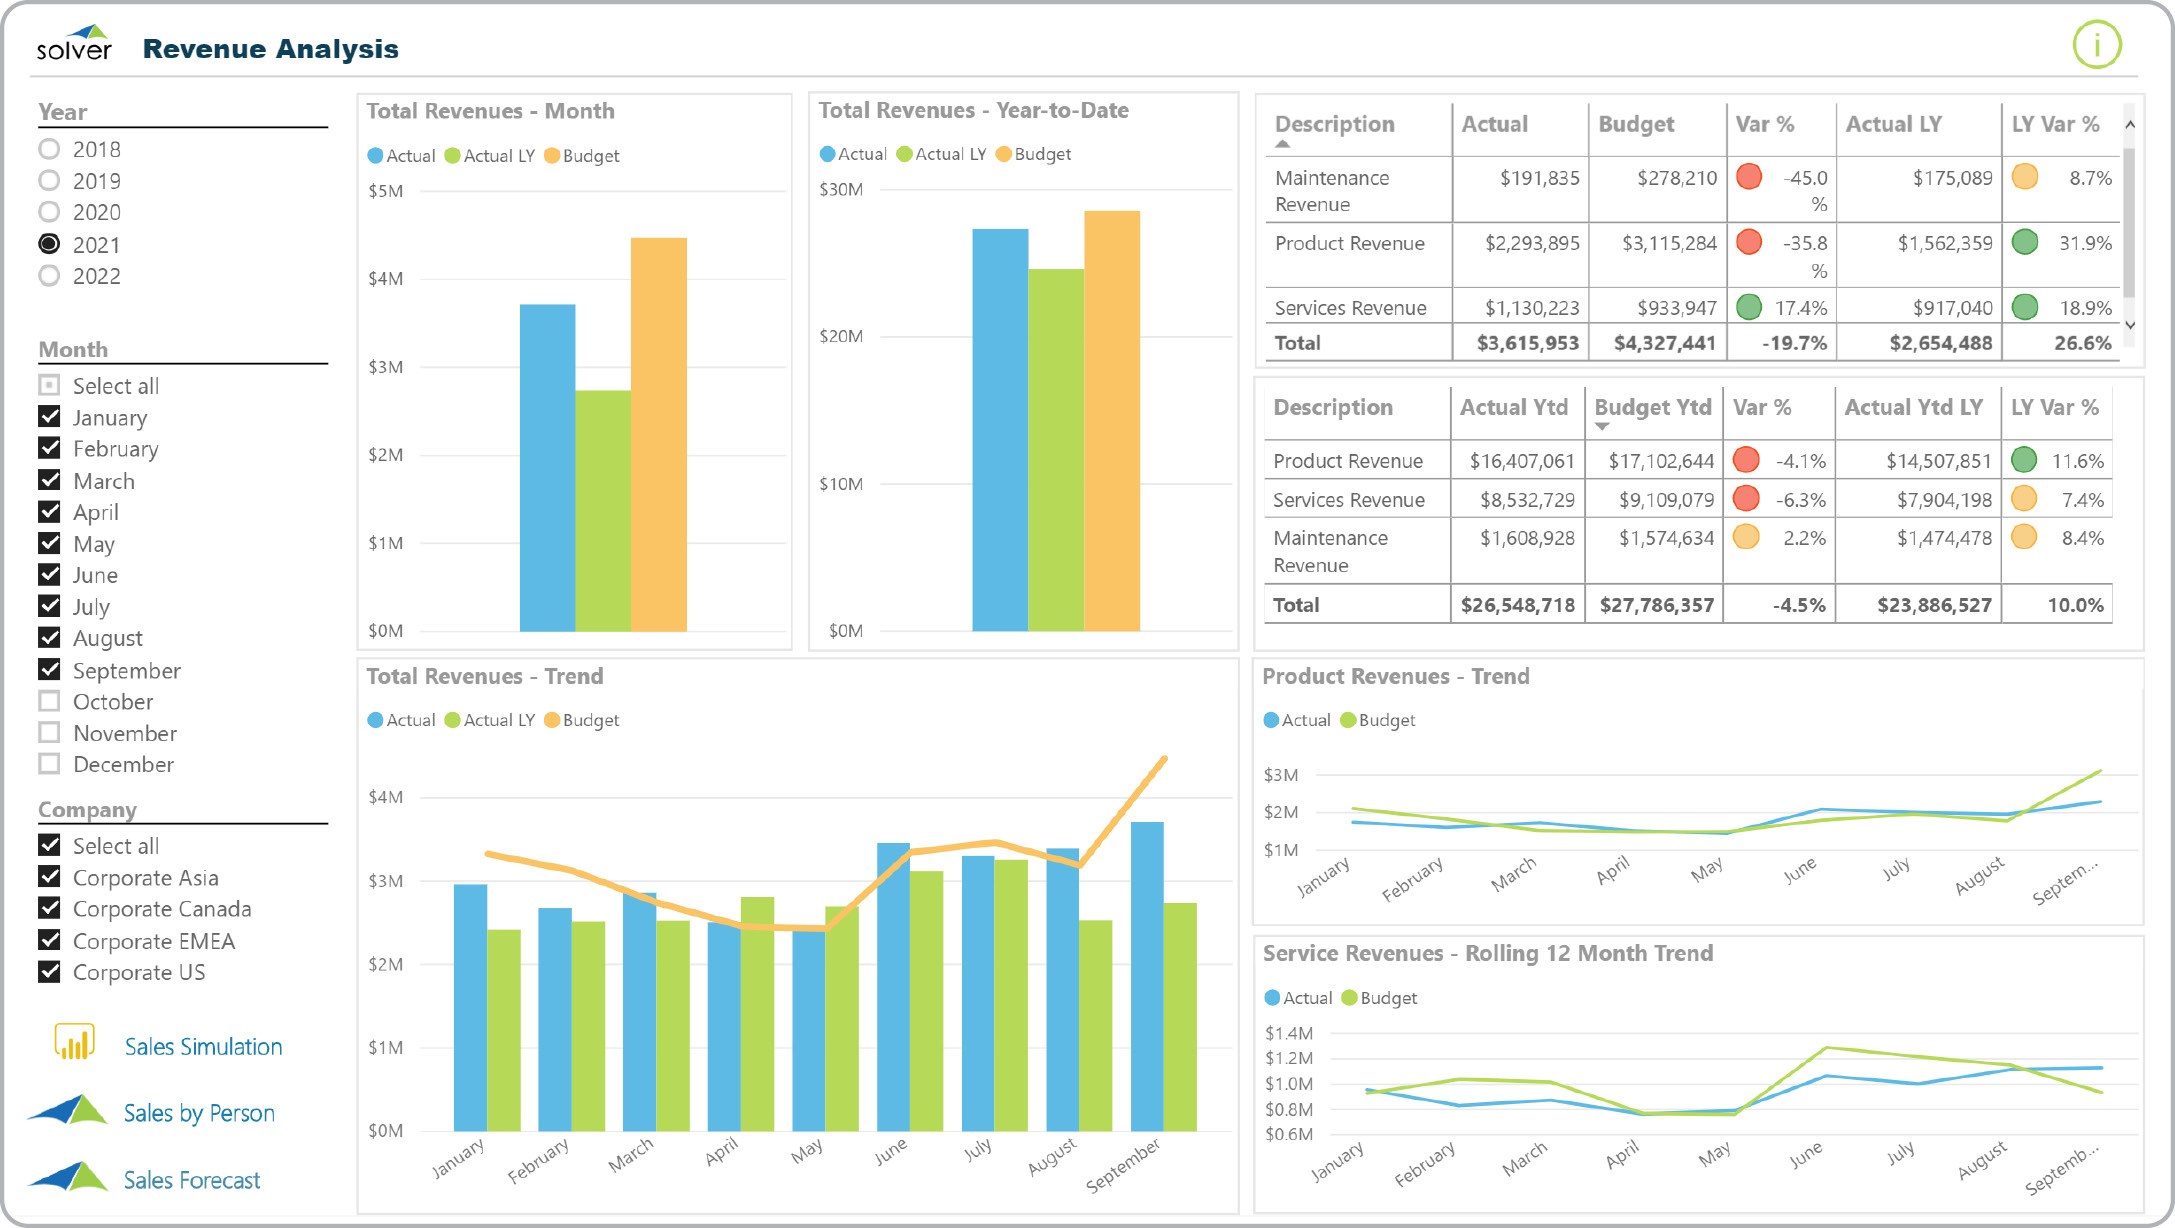
CROs need a bird's-eye view with bird's-eye KPIs to match. If you're one of them, you'll know you need dashboards that help you zoom out and see revenue trends, forecasts, and performance across teams.
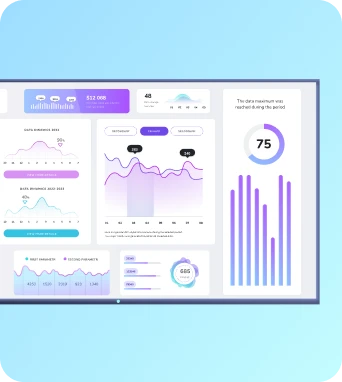
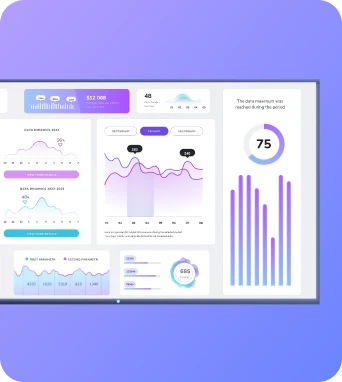
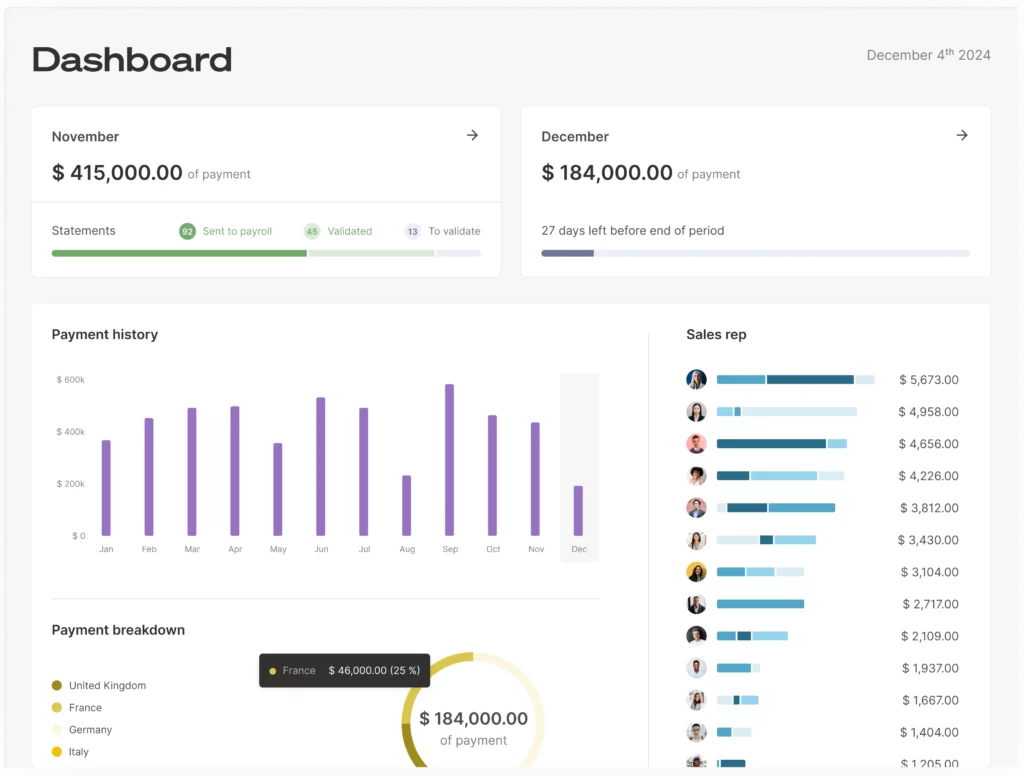
This revenue overview dashboard, for example, makes it easy to track total revenue for your sales team.
Or, you might rely on this sales velocity dashboard to see how fast deals move from lead to close.
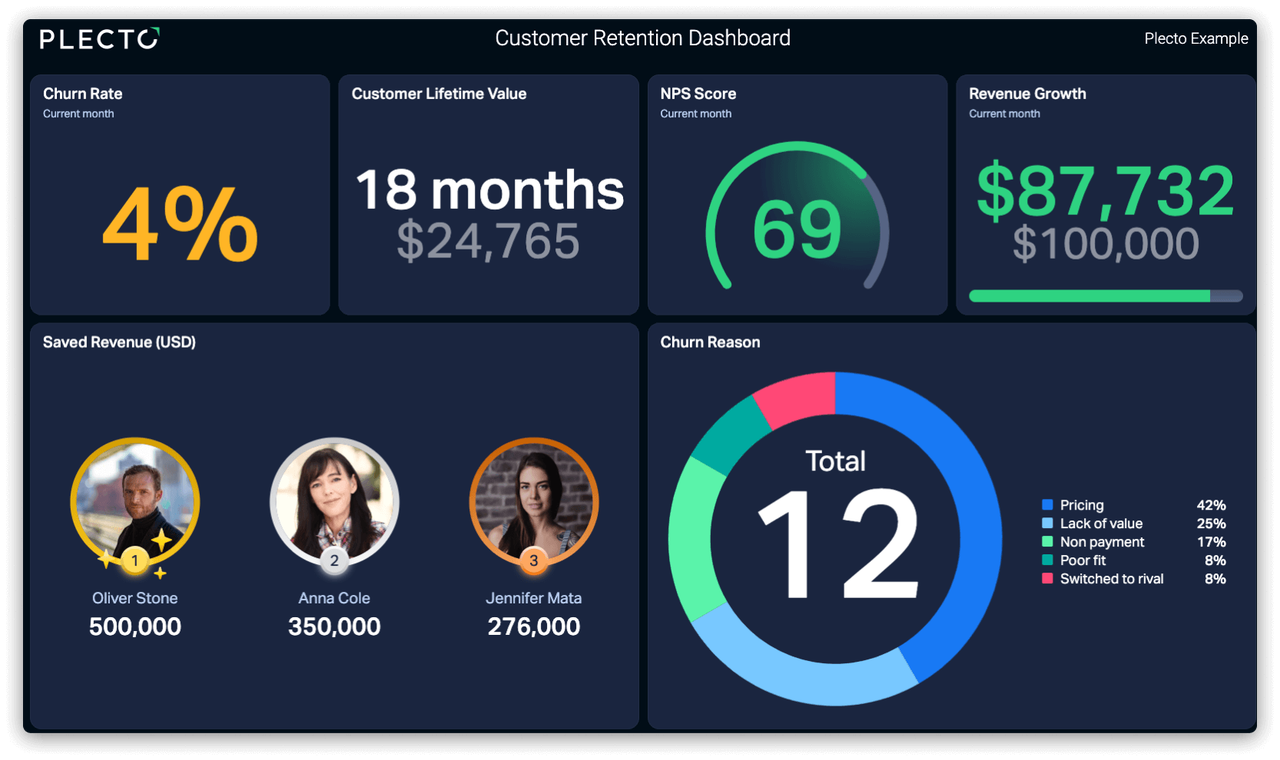
Curious how long your customers stick around? This retention dashboard can help you monitor churn, renewals, and upsell trends long after your sales team has sealed the deal.
For sales leaders and managers
We both know that busy sales managers don't have time to dredge through all the data, numbers, and call recordings at their disposal. So to save your sanity and be prepared for standing meetings, you probably want to rely on a few easy templates.
This team performance tracker, for example, lets you keep tabs on win rates, quotas, and top performers.

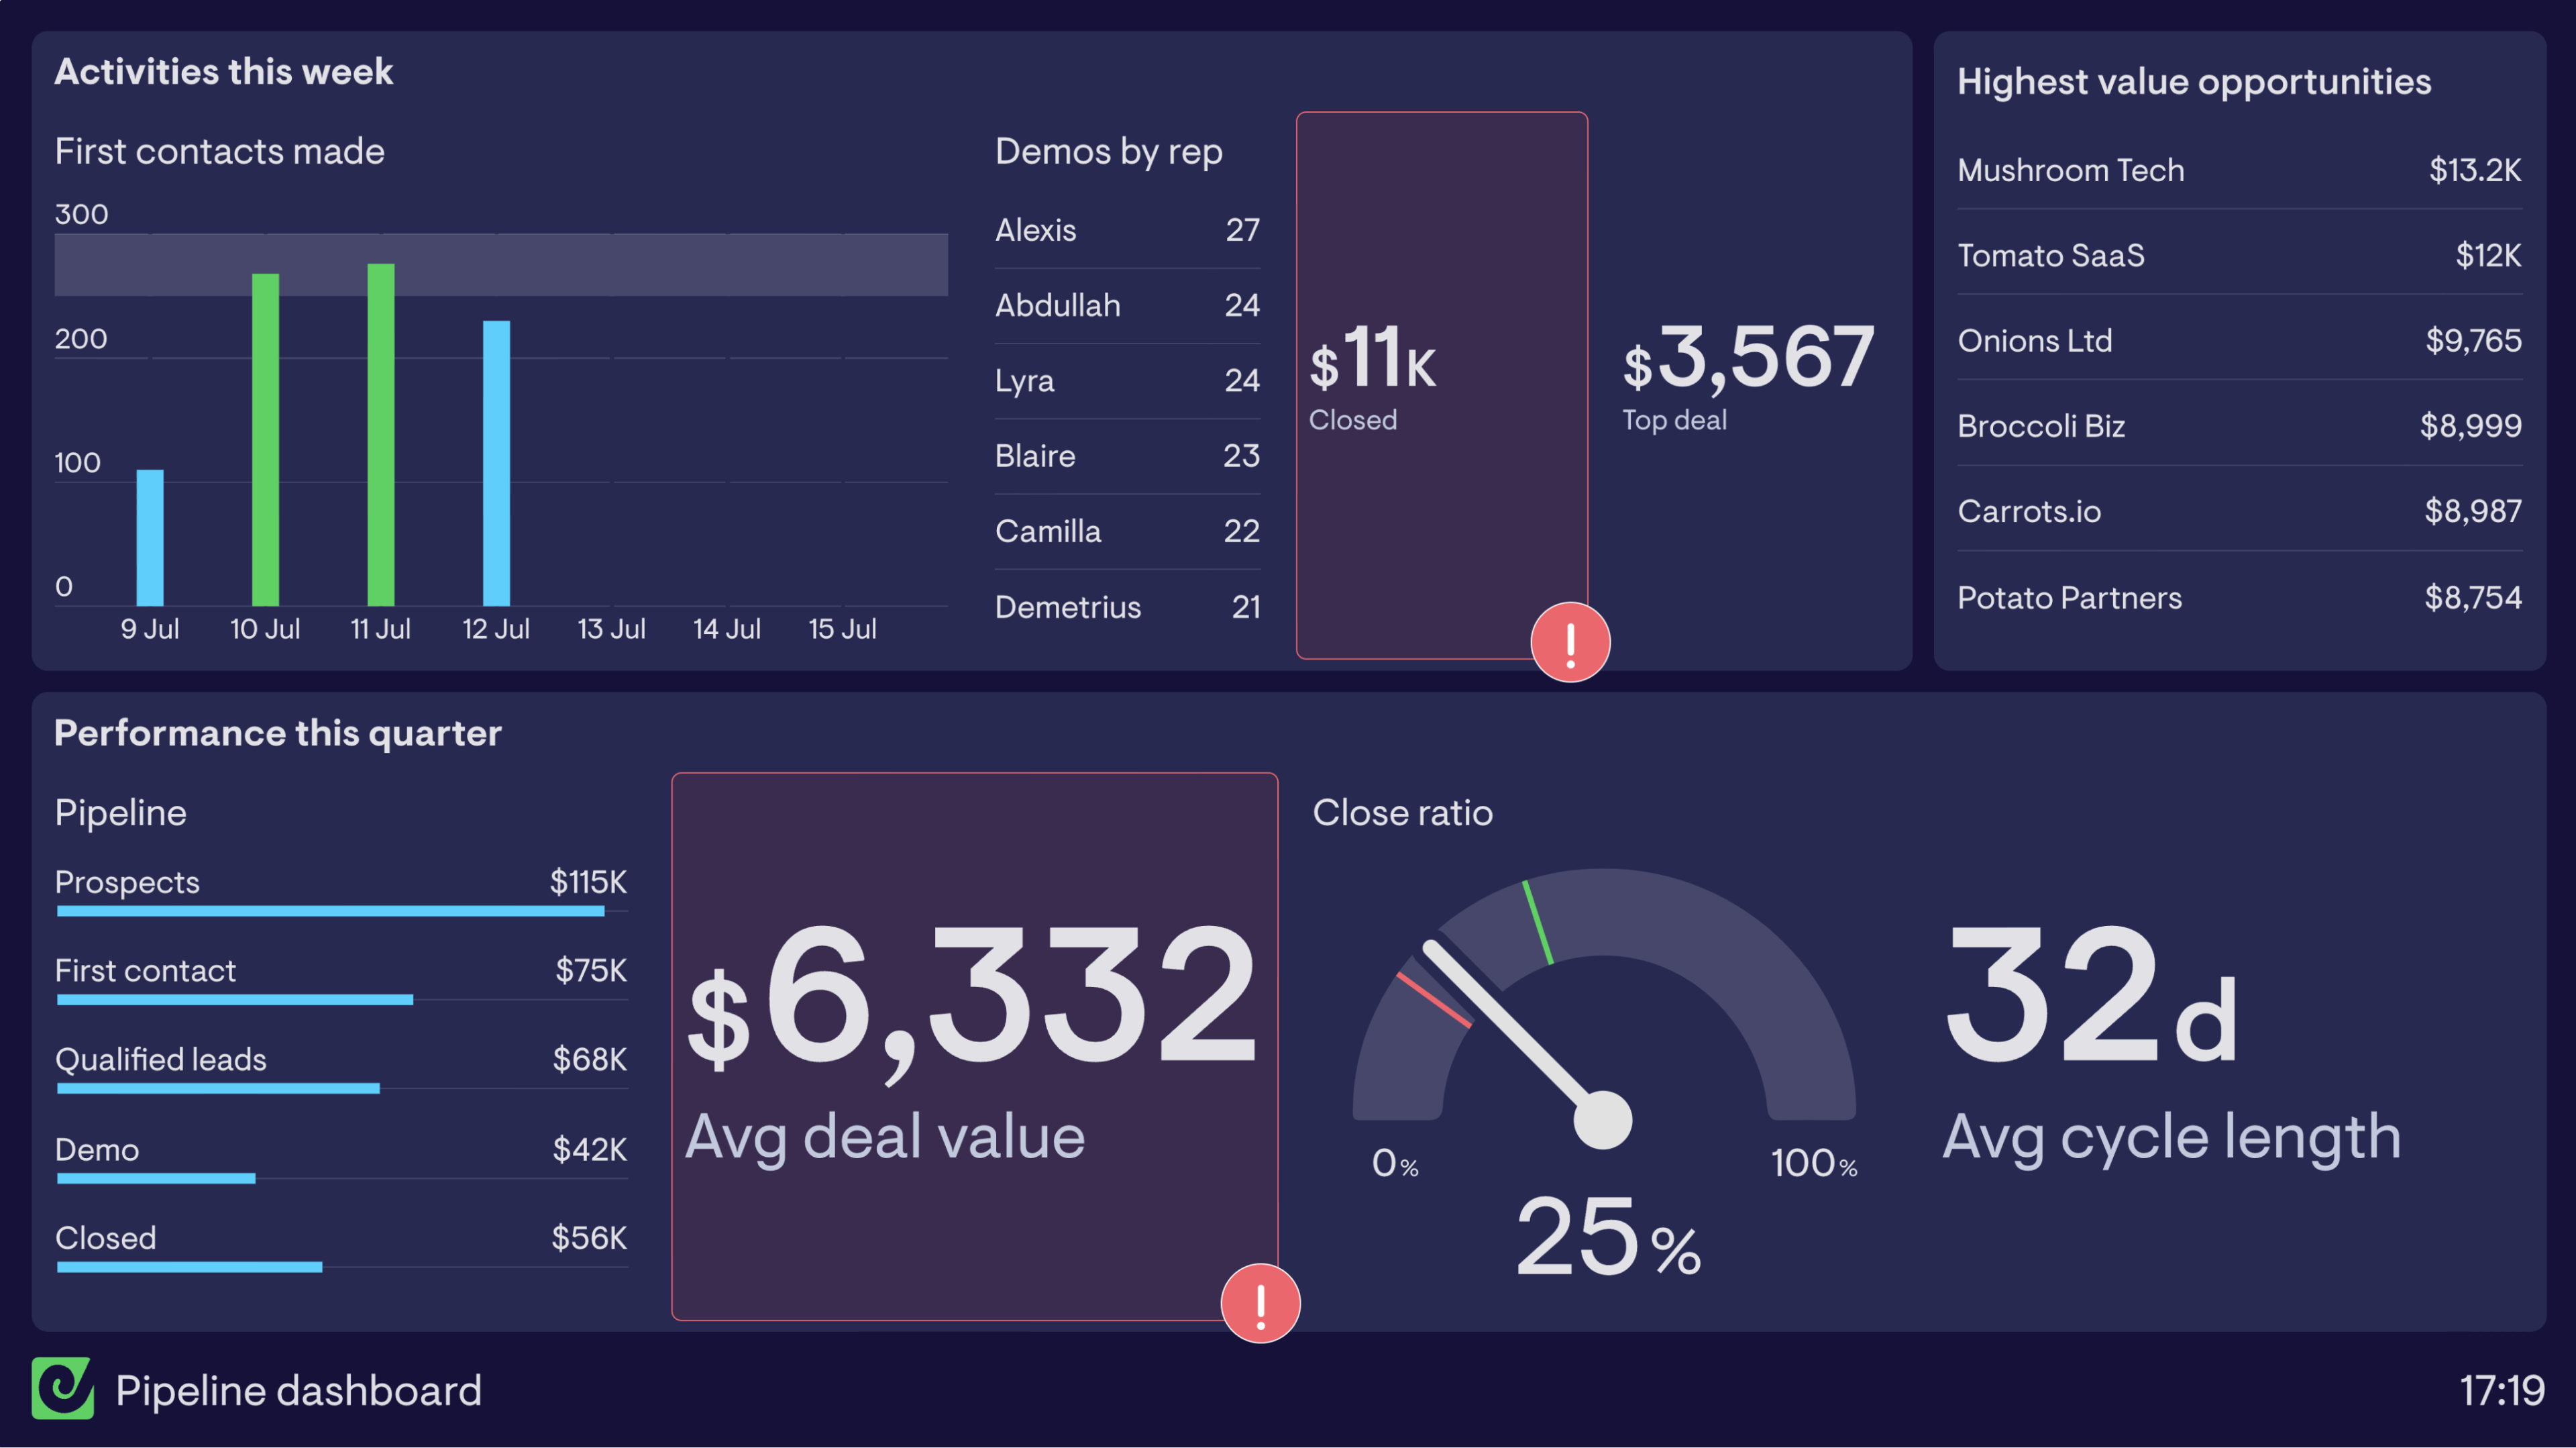
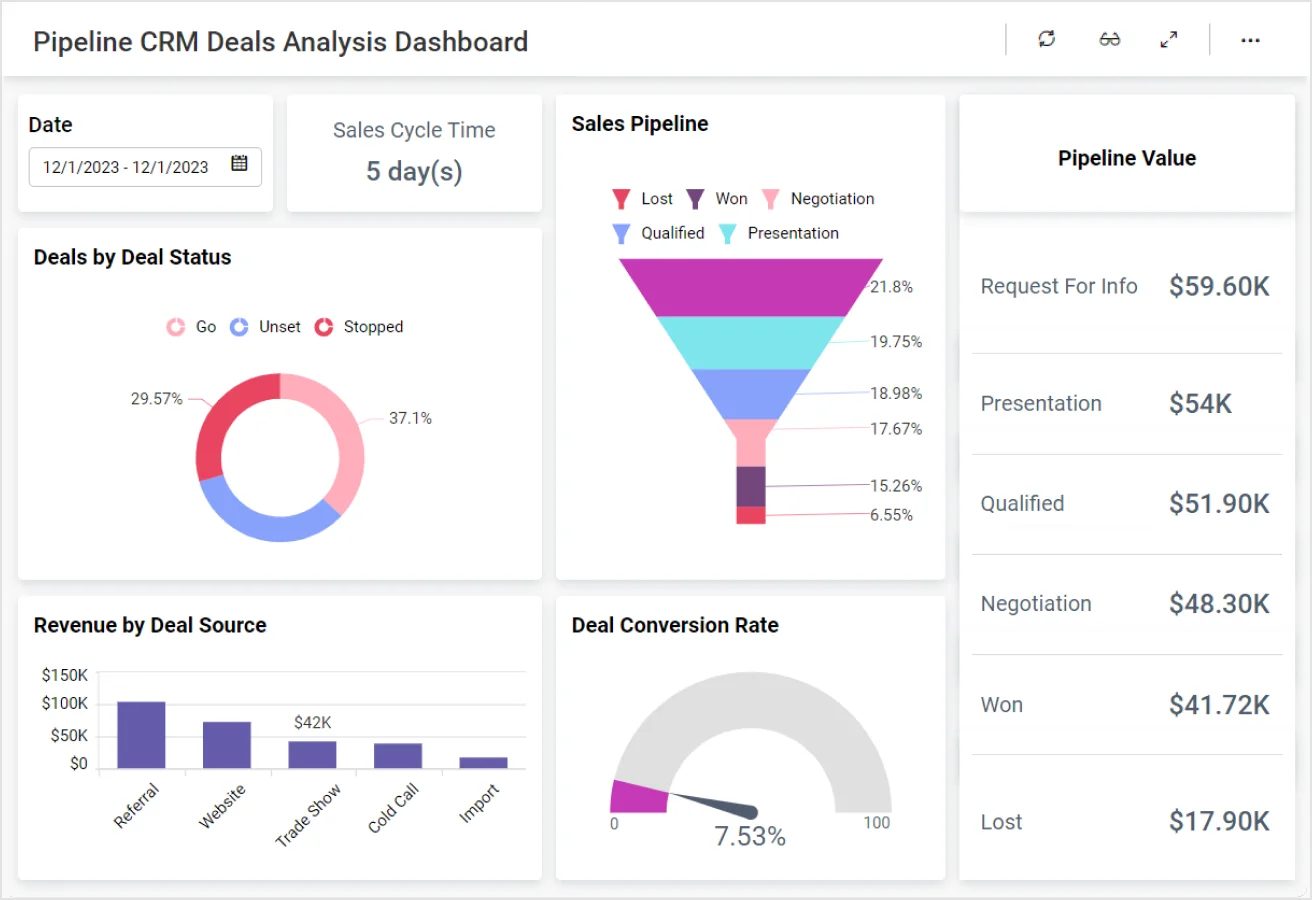
You can also use this pipeline progress board to visualize deal stages and projected closes.
Last but not least is this customer acquisition dashboard. This makes it easy to show other department heads how many new customers you've acquired, whether it's the last several months, a few weeks, or a full year.

For sales ops
The role of sales ops is to keep the engine running smoothly. To do this, you need fuel (aka, sales data). The dashboards you need should help you understand and organize rep activity, optimize process efficiency, and keep your CRM hygiene spotless.
One of these options could be this contact activity tracker. You can grab it here on Fugo and get up and running in 15 minutes or less.
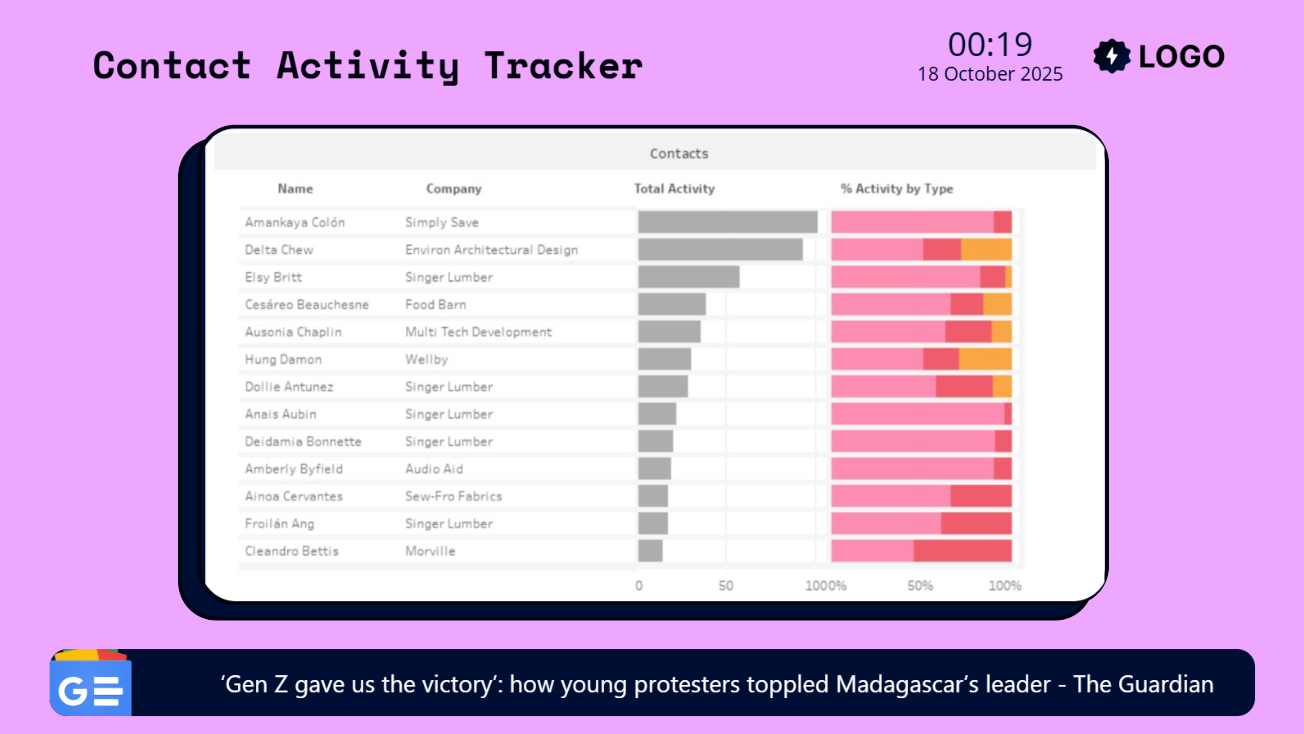
Get the contact activity tracker template here.
Want a less colorful version? This cropped template might save you some time.
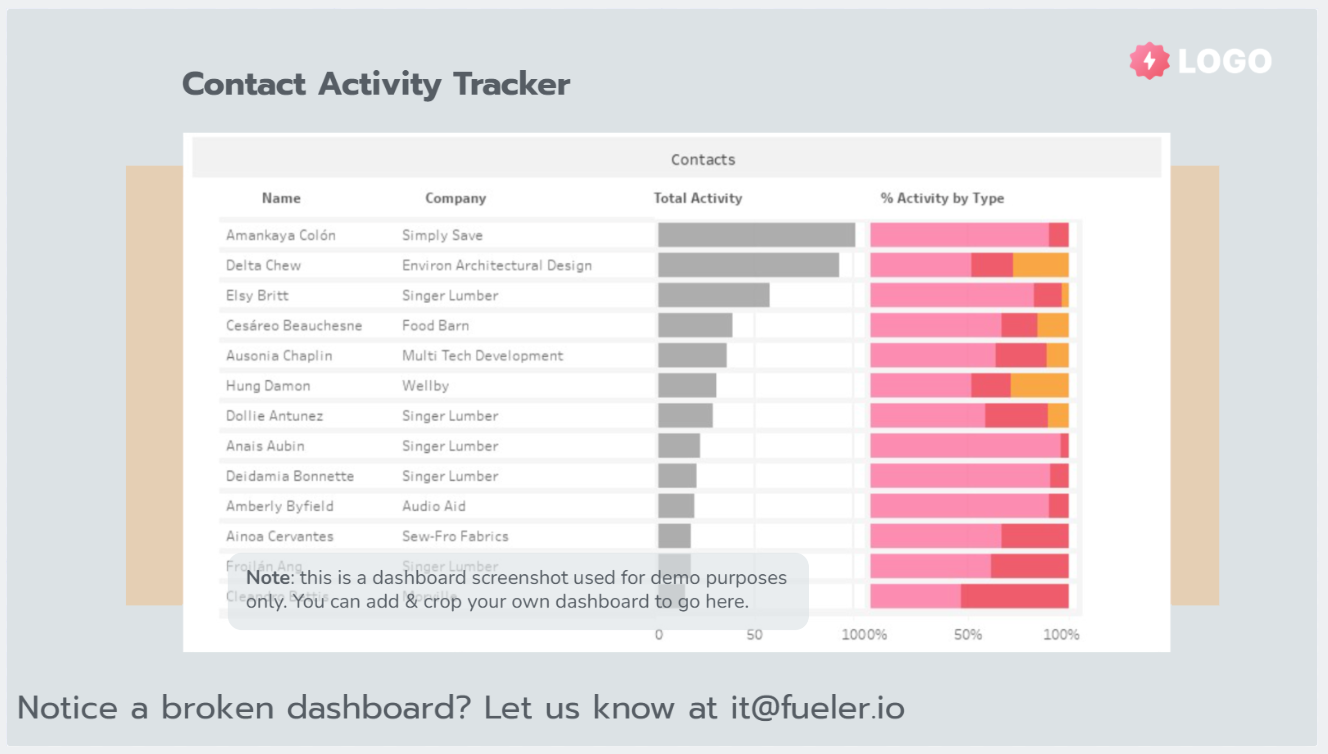
Get the base template for contact activity tracking here.
For sales reps
Because sometimes, motivation is just one leaderboard away. Or you just need a little gamification to keep your spirit high.
That way, you can show off:
- Great monthly sales bookings
- Ultra-high sales team performance
- Top-notch customer relationships
Speaking of gamification: let's start with sales leaderboard dashboards. These are terrific for keeping tabs on your coworkers and tracking your own progress toward monthly quotas or call targets.
Another option: a deal stage tracker. This lets you visualize every active deal in your pipeline. That way, you know exactly what’s close to closing versus what needs a little extra love.
Last but not least is a commission tracker dashboard. Because motivation loves visibility, after all. You can use this dashboard to track your earnings in real time as deals close, so you can see exactly how close you are to hitting that next tier (or planning your next vacation). 😎
💡 What if I need more templates?
Great question!
Explore Fugo's digital signage templates here.
The problem with most sales dashboards
Sales dashboards sound absolutely amazing on paper. But in practice… well, they can be a bit of a headache. They can be slow to set up, hard to design, and very quick to sprawl. So despite good intentions, you end up grabbing blurry screenshots, sifting through messy dropdown boxes, and troubleshooting annoying free slide tools or overpriced BI tools (yeah, we said it).
That's where the magic of AI-generated sales dashboards comes in. These smart dashboards are designed to pull in your sales KPIs automatically — like average deal values, monthly sales bookings, and more — so you can put insights on your screen with a few easy voice prompts.
Plus, AI sales dashboards make it easy to adapt as your team or goals change. Instead of slogging through PowerPoint with endless manual tweaks, you can spend more time tracking sales KPIs and brainstorming ideas that will make them even better.
Oh, and by the way: this tech is already available. At Fugo, we're refining it as we speak. But we need your help to make it happen!
So if you're curious about getting on the front lines to trial tools just like this...
Hop on the hype train for AI sales dashboards by joining our AI Beta Program for free. 😉
Frequently asked questions about sales KPIs
Q: What are the KPIs for sales?
Sales KPIs, also called key performance indicators, are numbers that show how your sales team is doing. Think of them as your sales scoreboard, which shows everything from how many calls were made to how many deals you closed.
You can also customize the KPIs you track to your team's specific goals, whether that’s faster growth, bigger deals, or fewer ghosted leads.
Q: What are the 4 KPIs every manager has to use?
Every great sales manager should keep an eye on these four sales KPI examples:
- Lead-to-opportunity conversion rate: Are your leads turning into potential deals?
- Win rate: How often do reps close what’s in your pipeline?
- Average deal size: What’s the dollar value of your average win?
- Sales growth rate: Is your team trending up or down over time?
Q: What are the 5 key performance indicators examples?
Five common sales KPI examples include:
- Number of calls made
- Meetings booked
- Pipeline value
- Monthly recurring revenue (MRR)
- Customer lifetime value (CLV)
Q: What are the 4 P's of KPI?
For sales metrics, the four Ps of KPIs can help you decide how well you're doing and what (if anything) you need to improve.
The four Ps stand for:
- Purpose: Why this KPI matters
- Progress: How far you’ve come
- Performance: How well you’re doing.
- Predictability: How reliably it forecasts future results