


Built-in AI analytics
Built-in AI analytics refers to onboard machine-learning capabilities within a signage platform that automatically collect and analyze viewer and display performance data—such as audience size, attention time, content engagement, and playback health—delivering real-time insights, automated reports, and actionable recommendations to optimize scheduling, content, and network reliability without external tools.
Built-in AI Analytics
Built-in AI Analytics: Audience Insights and Content Performance
Built-in AI analytics transforms digital signage from a passive display into a continuously learning content platform by automatically measuring who sees what, for how long, and which messages drive engagement. For Fugo.ai users and signage operators this means automated collection of key metrics such as impressions, dwell time, audience size and flow, view-through rates, and simple demographic estimates when applicable. The system can produce heatmaps of screen attention, rank content performance across schedules and locations, and run A/B tests to surface the best-performing creative. Instead of manual log reviews, the analytics engine generates actionable insights and recommendations—suggesting content swaps, optimal dayparts, or location-specific playlists—so operators can iteratively increase relevance and ROI without nomadic spreadsheets.
Operational and security considerations are designed for real-world deployments: analytics can run on-device or in the cloud with privacy-preserving defaults, aggregating anonymized data and avoiding personally identifiable information to meet GDPR and other compliance needs. Network admins will appreciate exportable reports, webhook alerts, and APIs for integrating impressions and health data into existing dashboards or SIEM systems. Built-in anomaly detection flags abnormal drops in playback, device offline events, or sudden traffic changes so IT can respond before campaigns suffer. For campaign managers, scheduled automated reports and threshold alerts make it easy to monitor multiple networks and iterate rapidly, while retained historical analysis supports longitudinal trends and budgeting decisions. When used as part of a disciplined workflow—baseline measurement, controlled experiments, and automated optimization—AI analytics turns digital signage from a broadcast medium into a measurable, adaptive channel that reduces wasted airtime and improves audience impact.
How built-in AI analytics work
Built-in AI analytics turn display endpoints into smart sensors that continuously measure the impact and health of your signage network without requiring separate third-party tools. At the content level, these analytics can assess dwell time, view counts, and engagement rates, compare performance across variants for automated A/B testing, and surface which creative assets and schedules drive the best outcomes. At the operational level, they monitor player status, detect anomalies like playback errors or offline devices, and predict failures from patterns in CPU, memory, or connectivity. Having analytics embedded in the player or CMS reduces latency for real-time decisioning, lowers bandwidth by processing data at the edge, and shortens the loop between insight and action so teams can optimize content schedules, trigger alerts, or update playlists automatically based on observed behavior.
For deployment and governance, built-in AI analytics are typically configurable to respect privacy and compliance needs: metrics can be collected as anonymized or aggregated counts, face-based features can be disabled, and retention windows and export options can be set to meet GDPR and local regulations. IT teams should treat analytics like any other service—plan for model update workflows, security controls, and storage encryption. Choose whether to run inference on-device to minimize cloud transfer costs and latency or in the cloud for more complex models and central aggregation. Make use of APIs and webhooks to feed analytics into existing BI tools or incident management systems, and start with a small pilot to validate key performance indicators and thresholds before scaling across the network.
The practical payoff is measurable: better content relevance and increased viewer attention, fewer unexpected outages, and clearer ROI reporting for stakeholders. Network managers gain per-screen and aggregated views to prioritize maintenance and content investments, while operations teams get timely alerts and automated remediation options. When configured with privacy-forward defaults and clear retention policies, built-in AI analytics become a powerful operational and marketing asset that scales with your digital signage deployment.
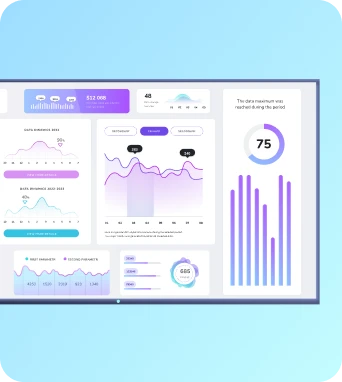
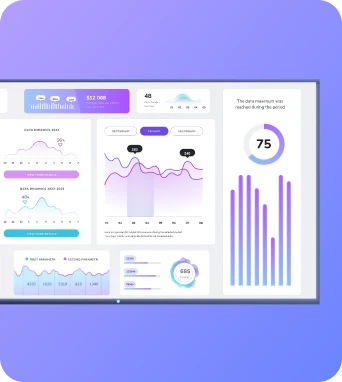
Built-in AI Analytics — real-time audience insights, engagement metrics, and automated reporting
Keep the learning going...
Browser-based CMS
A browser-based CMS is a web-hosted content management system that lets teams create, schedule and publish digital signage content directly from any modern browser. It removes the need for local server installations, supports centralised asset libraries, access controls and real‑time updates for TV dashboards and workplace displays.
Browser-based tools
Browser-based tools are web applications and in-browser utilities that let teams design, manage and preview digital signage and TV dashboards without installing native software. They enable content creation, scheduling, monitoring and integrations through a browser, supporting remote updates and rapid iteration across distributed display networks.
Built-in color correction
Built-in colour correction is a Fugo feature that automatically aligns colour output across TV dashboards and digital signage players. It applies calibration profiles, white balance and gamma adjustments, plus per-screen offsets, to maintain consistent, accurate brand colours, reduce visual drift and simplify large-scale display management and maintenance.