Bandwidth monitoring
Bandwidth monitoring is the continuous measurement and analysis of network throughput, latency and utilisation across connections serving digital signage. It reveals content delivery bottlenecks, measures streaming stability on TV dashboards and provides data for operators to optimise schedules, content quality and network costs to sustain reliable playback.
Bandwidth monitoring
Why bandwidth monitoring matters for signage
Bandwidth constraints and variability are among the most common causes of degraded playback and missed content updates on TV dashboards. Displays often operate over shared office networks, Wi‑Fi or cellular links where available capacity fluctuates with other user activity. Continuous monitoring makes those fluctuations visible: average and peak throughput figures show whether the connection can sustain the bitrate required by video or interactive content, while latency and packet loss metrics indicate risk to real‑time streams. For signage operators using Fugo, these measurements let you correlate playback incidents with network conditions, separating application or player faults from genuine connectivity problems. Beyond incident diagnosis, bandwidth monitoring supports optimisation. Historical usage patterns reveal times of day when links are underused and when they hit congestion, informing decisions about content scheduling, bitrate reduction and off‑peak updates. Monitoring can also guide the selection of delivery strategies such as prefetching, local caching, adaptive streaming and progressive downloads, each chosen to match the measured performance of a site. In multi‑site deployments, centralised reports make it straightforward to prioritise network upgrades or to provision dedicated connections for high‑priority locations such as reception areas or retail tills. Ultimately, a disciplined monitoring practice reduces the manpower needed for firefighting and improves overall uptime for your signage estate.
How to implement effective monitoring
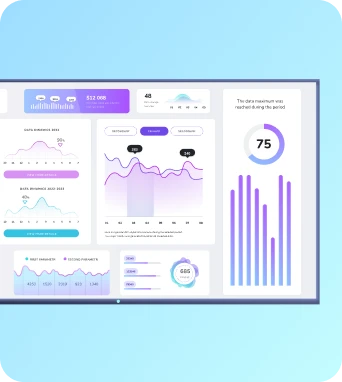
An effective bandwidth monitoring approach combines passive and active techniques tailored to digital signage requirements. Passive monitoring uses telemetry from media players and network devices to collect throughput, error rates and connection history without introducing additional traffic. Active monitoring injects small synthetic tests — periodic ping, traceroute and throughput checks — to assess latency, jitter and available bandwidth under controlled conditions. For Fugo deployments, ensure your media players or gateway devices report metrics back to the management console at regular intervals and include timestamps to enable correlation with playback logs. Design your monitoring to surface the most actionable signals. Track sustained throughput against content bitrates, measure latency and packet loss on both the uplink used for content fetch and the path to any critical cloud services, and record reconnect and buffer events from players. Use thresholds and anomaly detection to trigger alerts for conditions that usually precede playback issues, such as prolonged low throughput during scheduled updates or repeated DNS failures. Visual dashboards that aggregate data by site, ISP and player model support rapid triage and trend analysis. Also consider retention policies: short‑term detailed logs aid debugging, while aggregated long‑term metrics support capacity planning. Finally, integrate monitoring outputs with change management and ticketing systems so network incidents that affect signage can be tracked, assigned and resolved consistently.
Operational best practices
Keep the learning going...
Bandwidth allocation tools
Software or appliances that monitor, prioritize, and control network bandwidth to ensure efficient, predictable performance for users and applications.
Bandwidth utilization tracking
Bandwidth utilization tracking records and analyses the volume, timing and patterns of network traffic used by digital signage devices and TV dashboards. It shows per-player consumption, content-related peaks and trends, enabling operators to detect playback bottlenecks, enforce quotas, and make data-driven decisions for capacity planning and content scheduling.


