Audience engagement metrics
Audience engagement metrics quantify how viewers respond to digital signage and TV dashboards, tracking measures such as dwell time, views, repeat exposure, interactions and attention estimates. These metrics help signage managers, content producers and IT teams assess content performance, compare placements and make data-driven adjustments to schedules, layouts and creative.
Audience engagement metrics
Key engagement metrics explained
Dwell time is one of the most straightforward and commonly used metrics; it measures the average time a viewer spends looking at a screen or within an area of influence. In a retail foyer or a meeting-room lobby, dwell time is useful for gauging whether content holds attention long enough to convey its message. Repeat exposure, or frequency, records how often the same viewer returns to a screen over a period; combined with dwell time it helps distinguish between fleeting glances and meaningful engagement. Impressions and unique views estimate audience reach: how many passes or distinct viewers a display receives. Interaction rates capture deliberate actions such as touch responses, QR-code scans, NFC taps or responses captured by companion apps and are especially valuable for campaigns that aim to drive a measurable call to action. Attention estimates and gaze detection are higher-level signals sometimes derived from camera analytics or sensor fusion; they provide probabilistic measures of whether a viewer looked at the screen, though they rely on careful calibration and privacy-aware processing. Conversion-oriented metrics translate engagement into outcomes: sign-ups, coupon redemptions, footfall into a specific zone, or internal actions like read receipts for an HR announcement. For workplace dashboards, engagement may include completion rates for safety notices or click-throughs from a digital signage portal. Each metric has trade-offs: raw impressions are easy to measure but say little about impact, while attention estimates and conversions offer deeper insight but require more sophisticated instrumentation and careful consideration of consent and anonymity. When designing a measurement strategy, signage managers should select a small, consistent set of metrics aligned to campaign objectives and the technical capabilities of the display network.
Collecting and analysing engagement data
Collecting reliable engagement data for digital signage involves a mix of hardware, software and process. Edge devices connected to displays can log playback statistics and sensor readings locally, forwarding aggregated events to cloud analytics for processing. Motion sensors and Bluetooth beacons provide coarse presence data, while Wi‑Fi probes and anonymised camera analytics offer richer signals such as estimated attention or demographic patterns; however, these richer sources must be handled with privacy-preserving methods and compliance checks. Integration with third-party analytics platforms or CRMs makes it possible to correlate screen engagement with sales or internal KPI changes, enabling attribution models that connect content to measurable business outcomes. Data quality depends on consistent time synchronisation, reliable device health reporting and sensible aggregation intervals; noisy raw data should be smoothed and outliers investigated rather than blindly driving decisions. Analysis practices for engagement metrics emphasise A/B testing, cohort segmentation and trend monitoring. A/B testing can involve swapping creative elements, changing call-to-action phrasing or altering playlist rotation to compare engagement lift. Segmenting by time of day, location or audience type clarifies when and where content is most effective; for example, a store entrance display may perform better for short-form promos during peak footfall and longer-form content during quieter hours. Dashboards tailored for signage operators should show both high-level KPIs and the underlying event distributions so teams can interpret whether improvements stem from content, scheduling or changes in foot traffic. For teams using Fugo.ai, exporting standard metrics and integrating with reporting tools allows cross-channel analysis, while alerting on device issues ensures that zero-engagement periods are investigated promptly.
Putting metrics into practice
Keep the learning going...
Asus fanless Chromebox
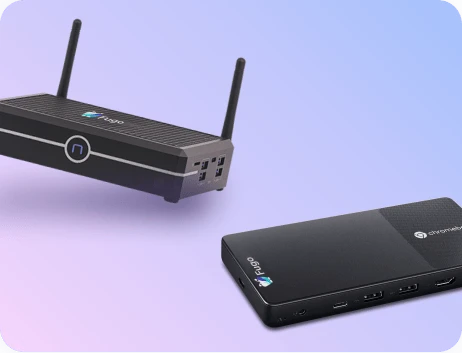
The Asus fanless Chromebox is a compact Chrome OS media player designed for continuous operation without moving parts. It delivers stable, low-noise playback and simplified management for digital signage and TV dashboards, offering efficient thermal design, long uptime and straightforward integration with cloud-based content platforms like Fugo.ai. Ideal for public displays and meeting rooms.
Audience analytics
Audience analytics for digital signage captures anonymised viewer interactions with screens and TV dashboards, measuring metrics such as footfall, dwell time, view rates, and inferred demographics to inform content strategy, scheduling and placement decisions for workplace displays and public screens.
Audio over IP
Audio over IP (AoIP) is the transmission of multichannel digital audio across standard IP/Ethernet networks using packetized protocols and industry standards.


